

Relationship between odor intensity estimates and COVID-19 prevalence prediction in a Swedish population
- PMID: 32441744
- PMCID: PMC7314115
- DOI: 10.1093/chemse/bjaa034
Relationship between odor intensity estimates and COVID-19 prevalence prediction in a Swedish population
Abstract
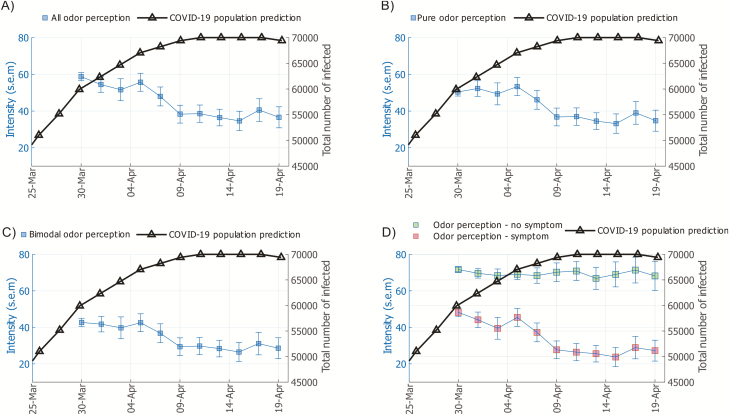
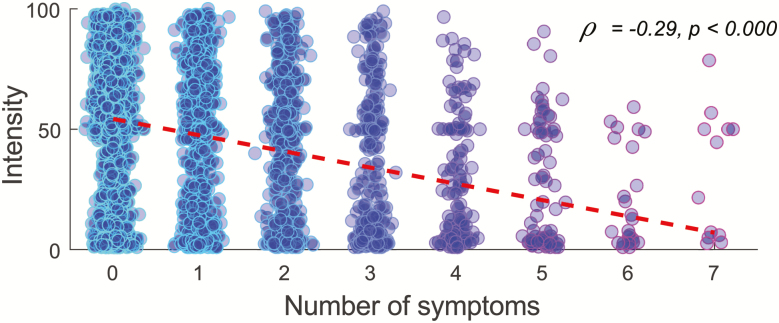
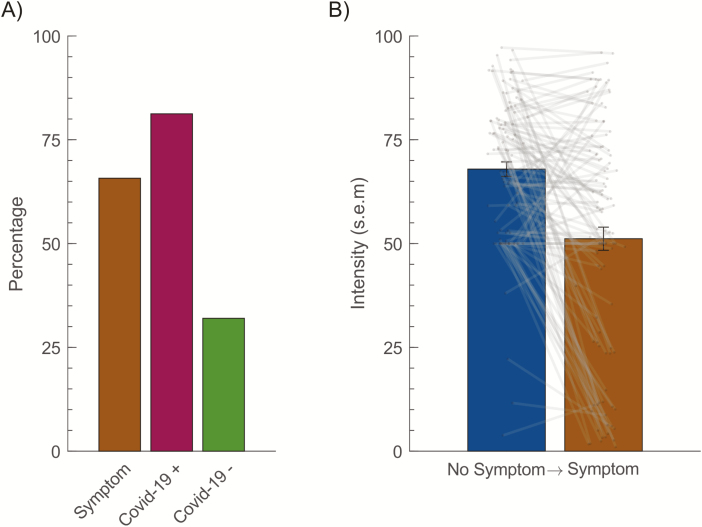
In response to the COVID-19 pandemic, countries have implemented various strategies to reduce and slow the spread of the disease in the general population. For countries that have implemented restrictions on its population in a step-wise manner, monitoring of COVID-19 prevalence is of importance to guide decision on when to impose new, or when to abolish old, restrictions. We are here determining whether measures of odor intensity in a large sample can serve as one such measure. Online measures of how intense common household odors are perceived and symptoms of COVID-19 were collected from 2440 Swedes. Average odor intensity ratings were then compared to predicted COVID-19 population prevalence over time in the Swedish population and were found to closely track each other (r=-0.83). Moreover, we found that there was a large difference in rated intensity between individuals with and without COVID-19 symptoms and number of symptoms was related to odor intensity ratings. Finally, we found that individuals progressing from reporting no symptoms to subsequently reporting COVID-19 symptoms demonstrated a large drop in olfactory performance. These data suggest that measures of odor intensity, if obtained in a large and representative sample, can be used as an indicator of COVID-19 disease in the general population. Importantly, this simple measure could easily be implemented in countries without widespread access to COVID-19 testing or implemented as a fast early response before wide-spread testing can be facilitated.
Keywords: COVID-19; Coronavirus; anosmia; olfactory dysfunction; population prevalence.
© The Author(s) 2020. Published by Oxford University Press.
Figures
References
-
- Eliezer M, Hautefort C. . 2020. MRI evaluation of the olfactory clefts in patients with SARS-CoV-2 infection revealed an unexpected mechanism for olfactory function loss. Acad Radiol. doi: 10.1016/j.acra.2020.05.013. - PMC - PubMed
-
- Frasnelli J, Schuster B, Hummel T. 2007. Interactions between olfaction and the trigeminal system: what can be learned from olfactory loss. Cereb Cortex. 17(10):2268–2275. - PubMed
-
- Gane SB, Kelly C, Hopkins C. Forthcoming. Isolated sudden onset anosmia in COVID-19 infection. A novel syndrome? Rhinology. doi: 10.4193/Rhin20.114. - PubMed
-
- Hummel T, Kobal G, Gudziol H, Mackay-Sim A. 2007. Normative data for the “Sniffin’ Sticks” including tests of odor identification, odor discrimination, and olfactory thresholds: an upgrade based on a group of more than 3,000 subjects. Eur Arch Otorhinolaryngol. 264(3):237–243. - PubMed
Grants and funding
LinkOut - more resources
Full Text Sources
