. 2020 Jul 6;217(7):e20190745.
doi: 10.1084/jem.20190745.

SIRT1-NOX4 signaling axis regulates cancer cachexia

Affiliations

SIRT1-NOX4 signaling axis regulates cancer cachexia

Aneesha Dasgupta et al. J Exp Med. .

Abstract

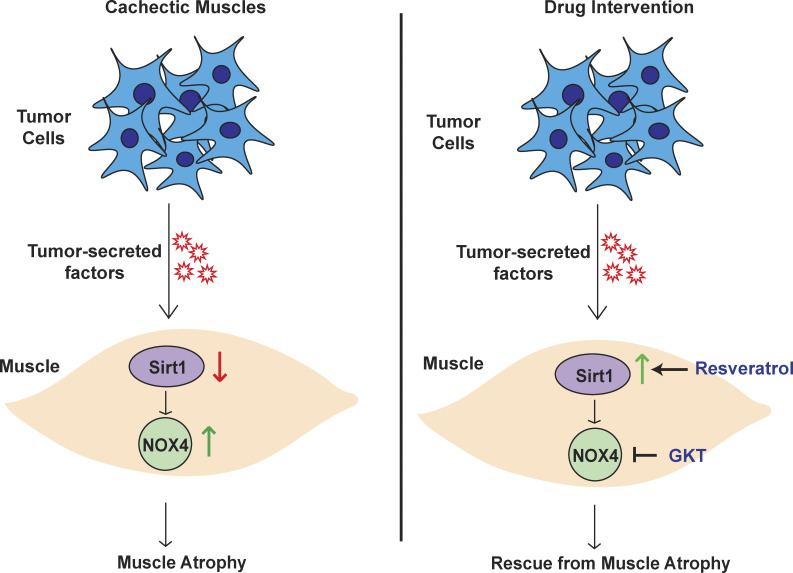
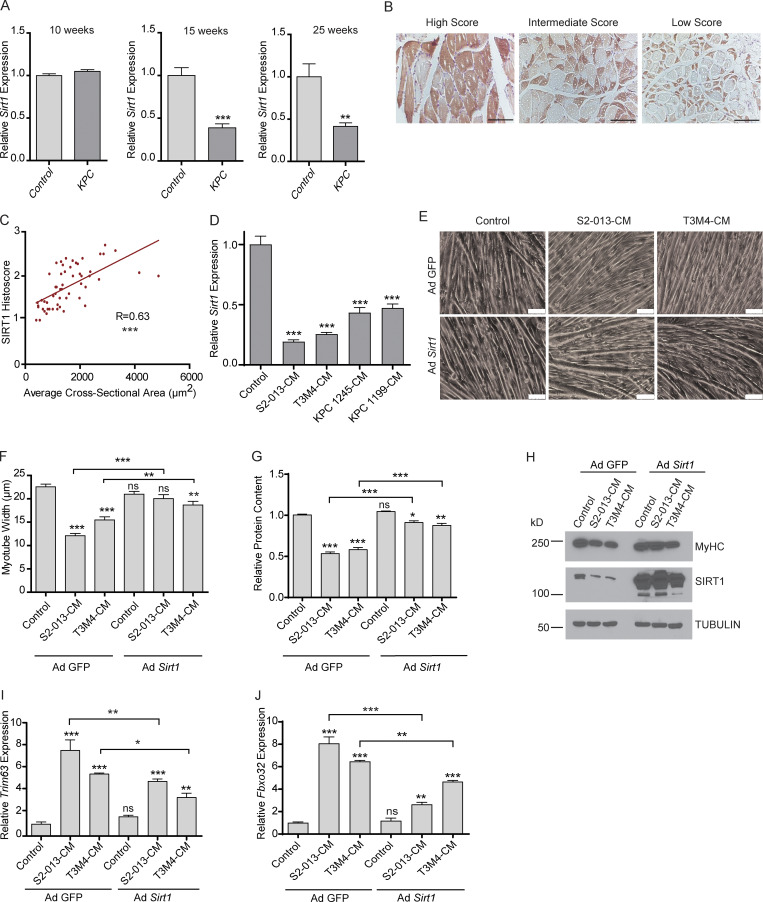
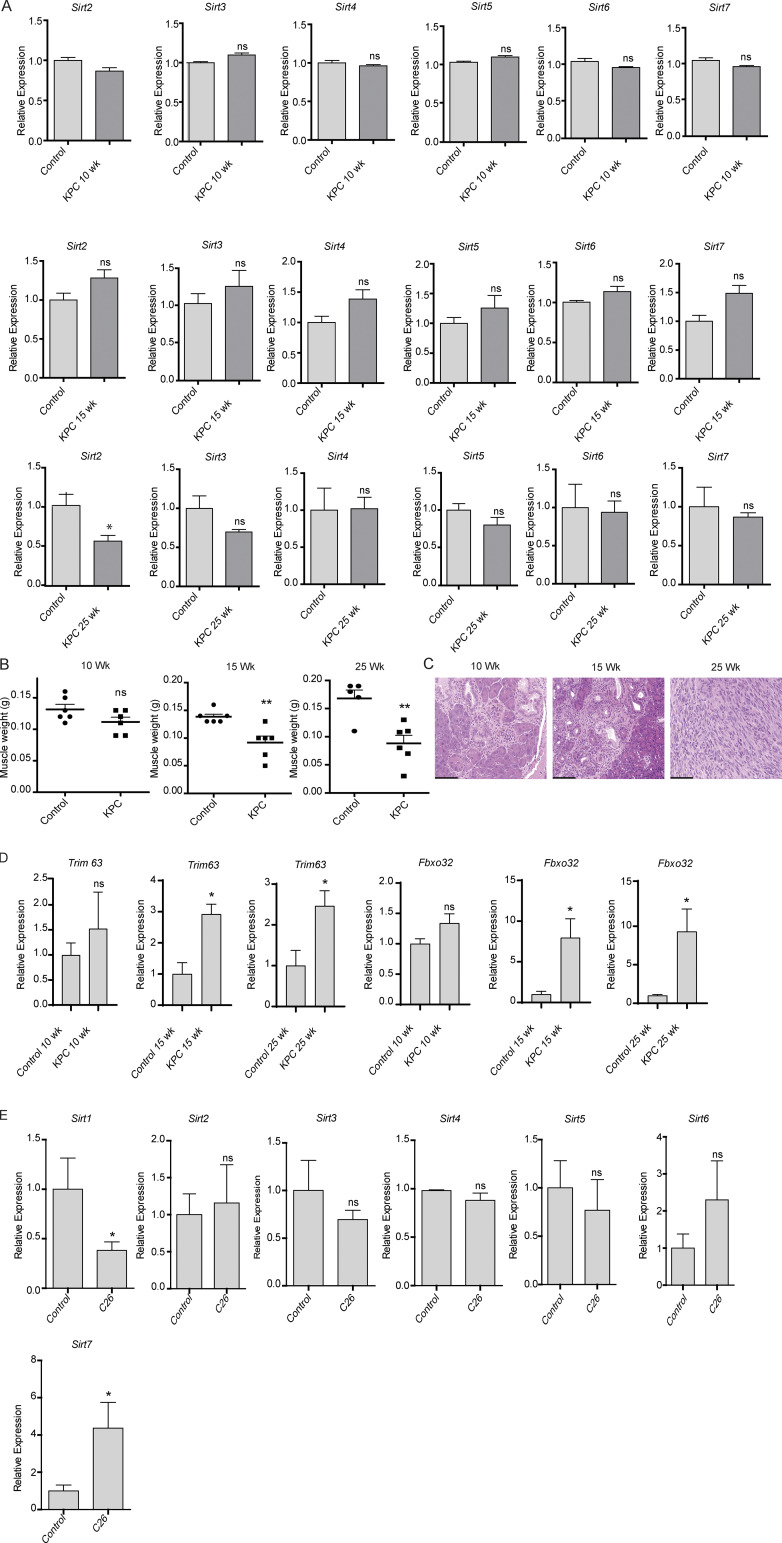
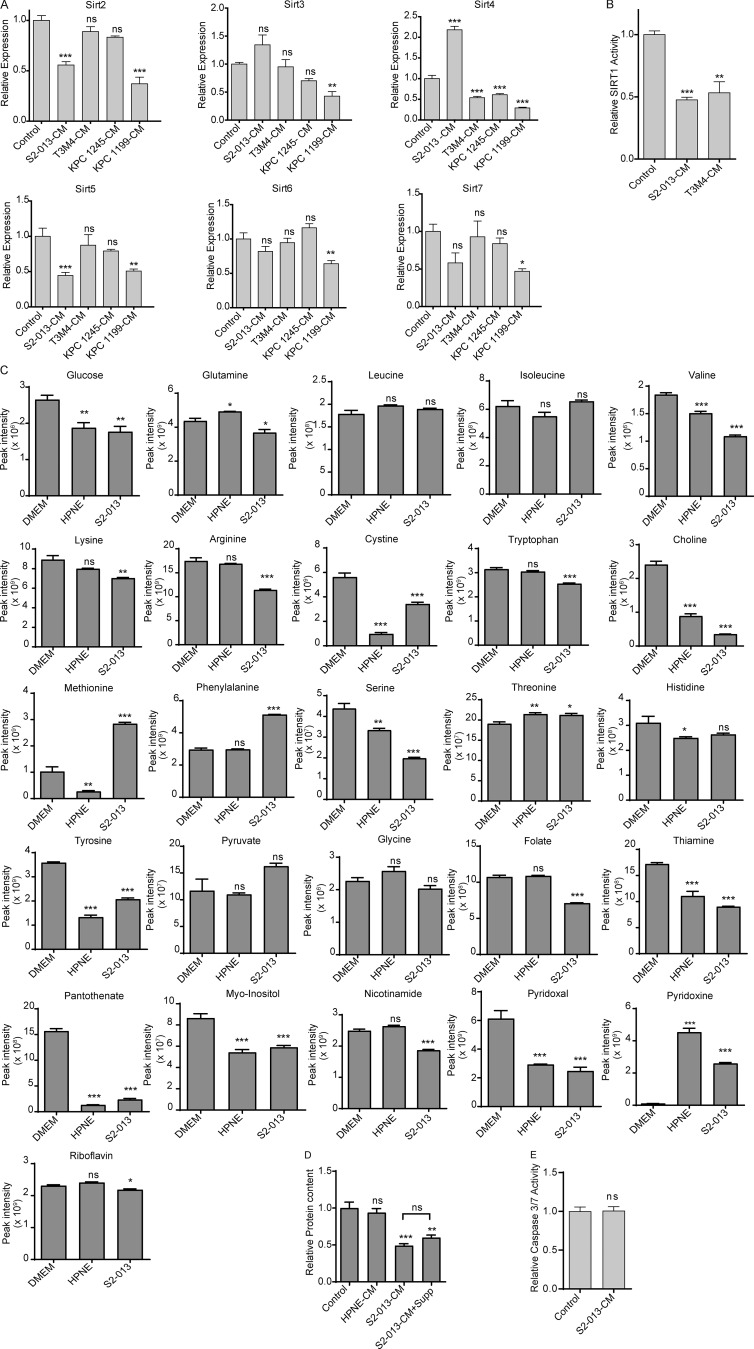
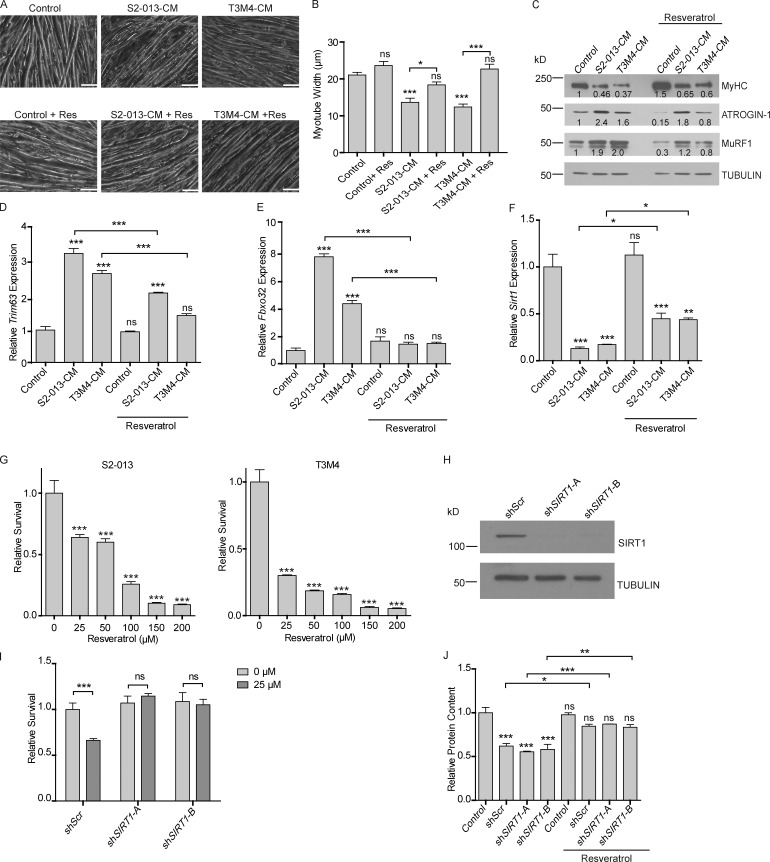
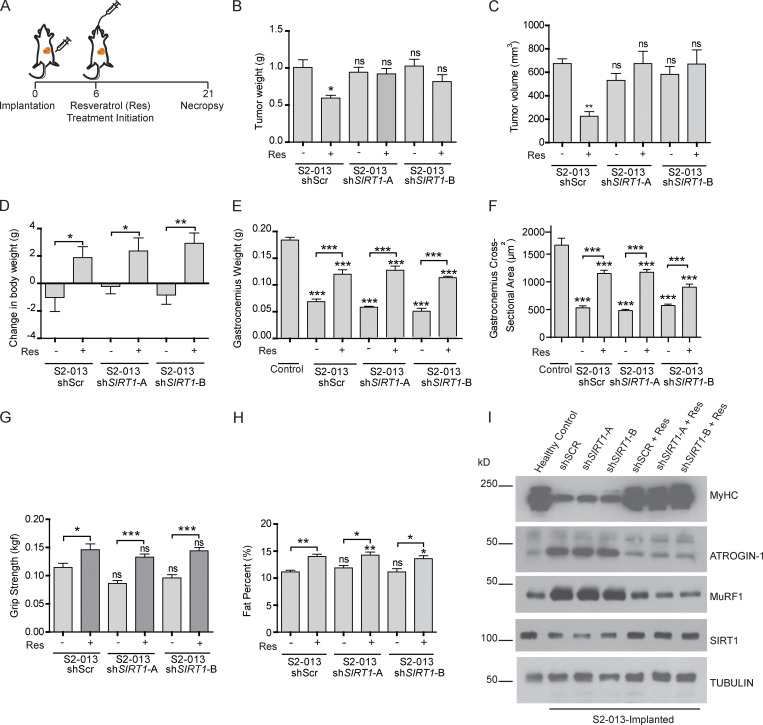
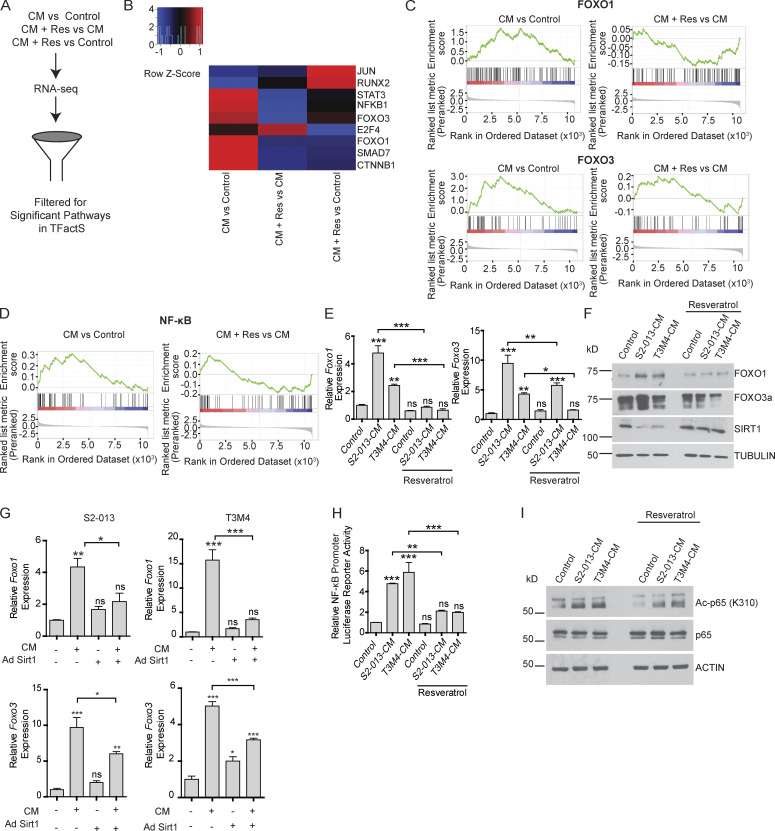
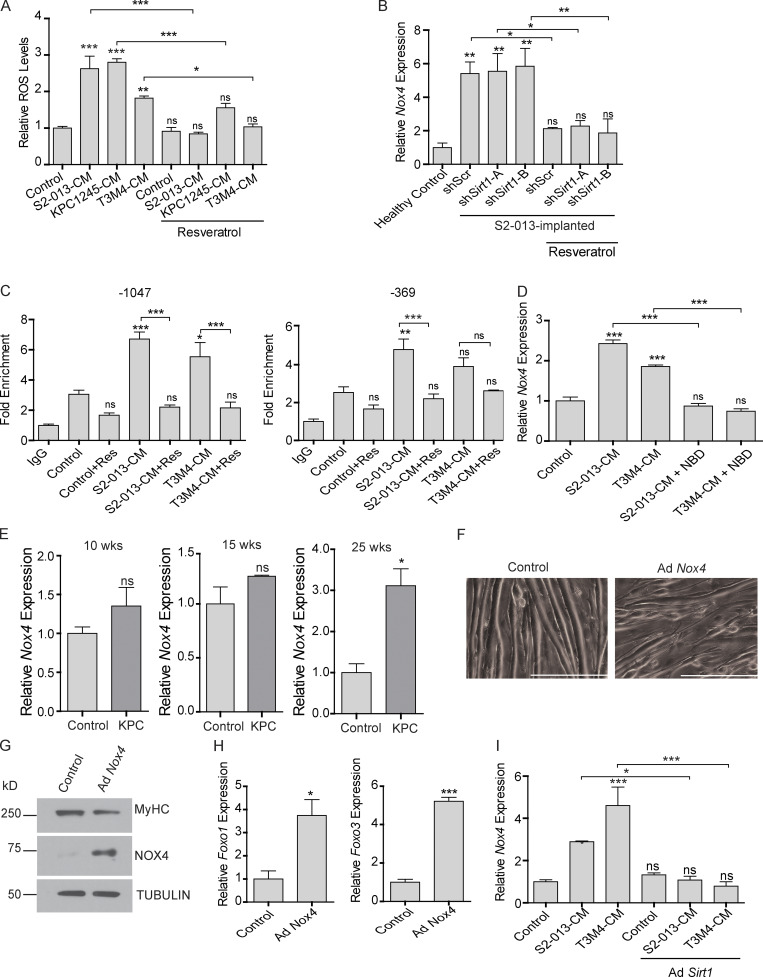
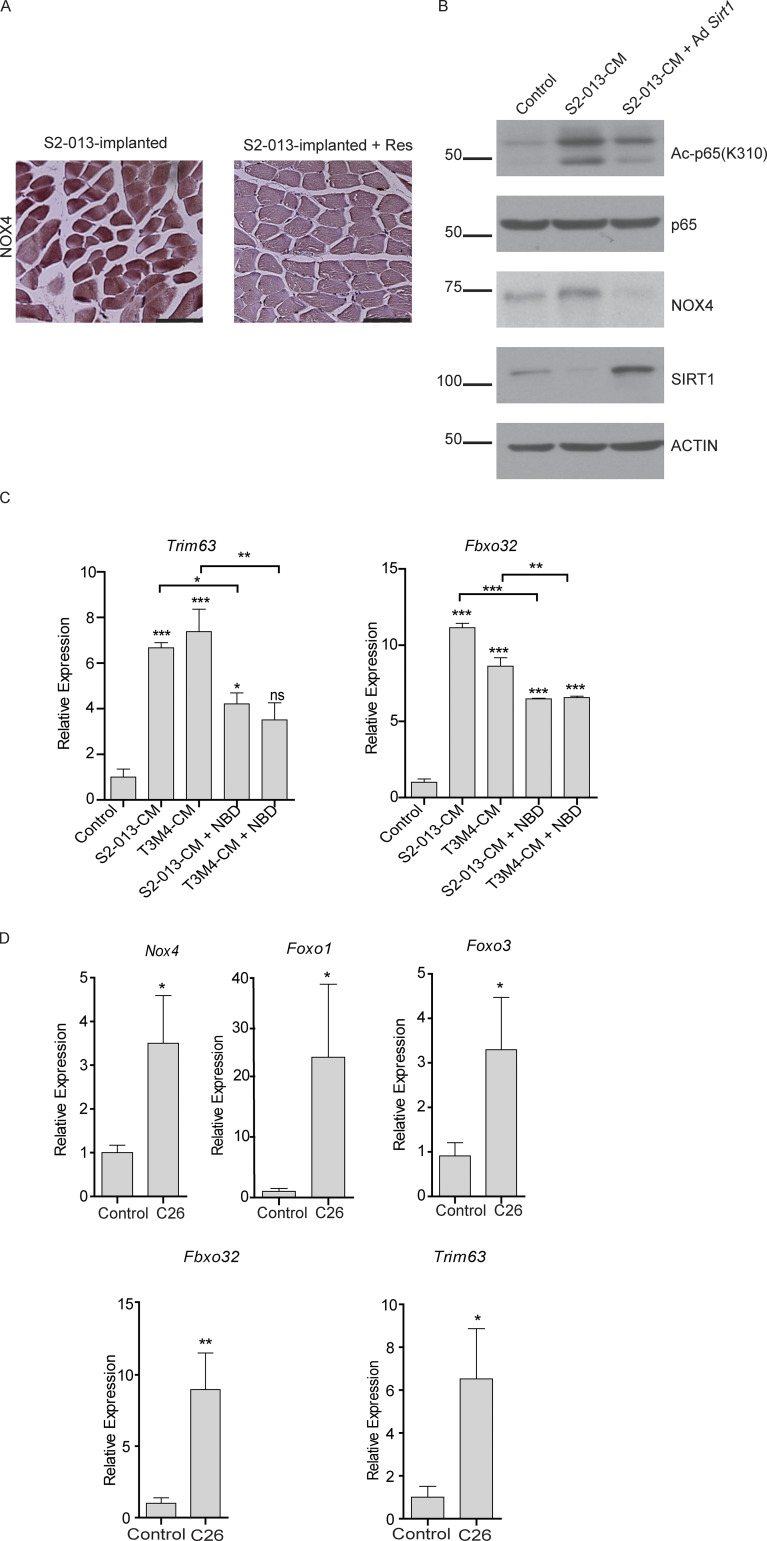
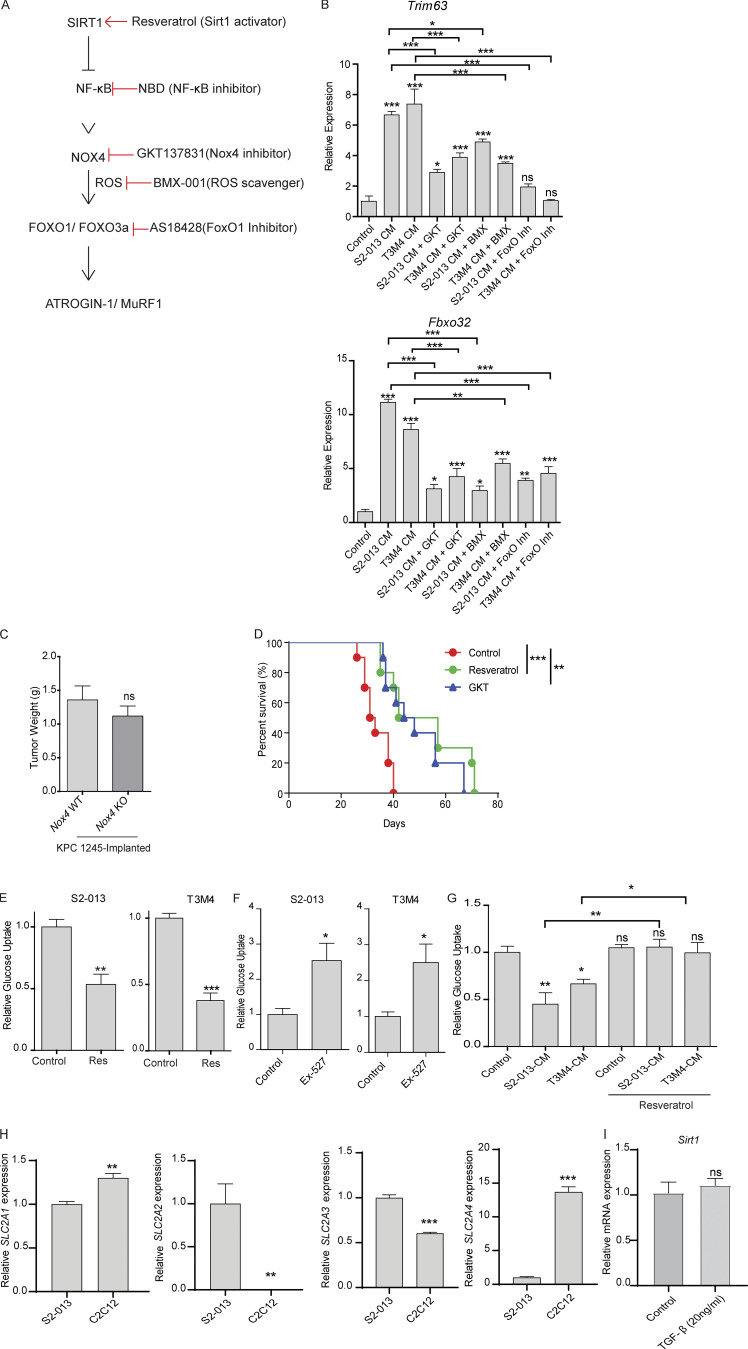
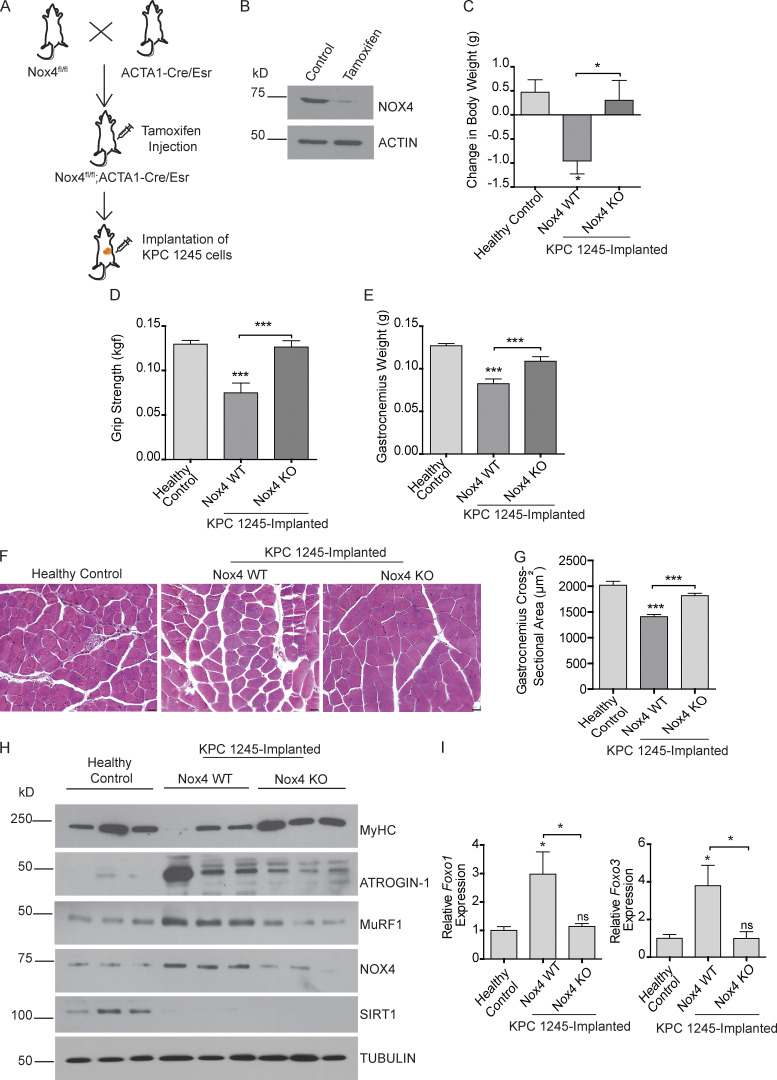
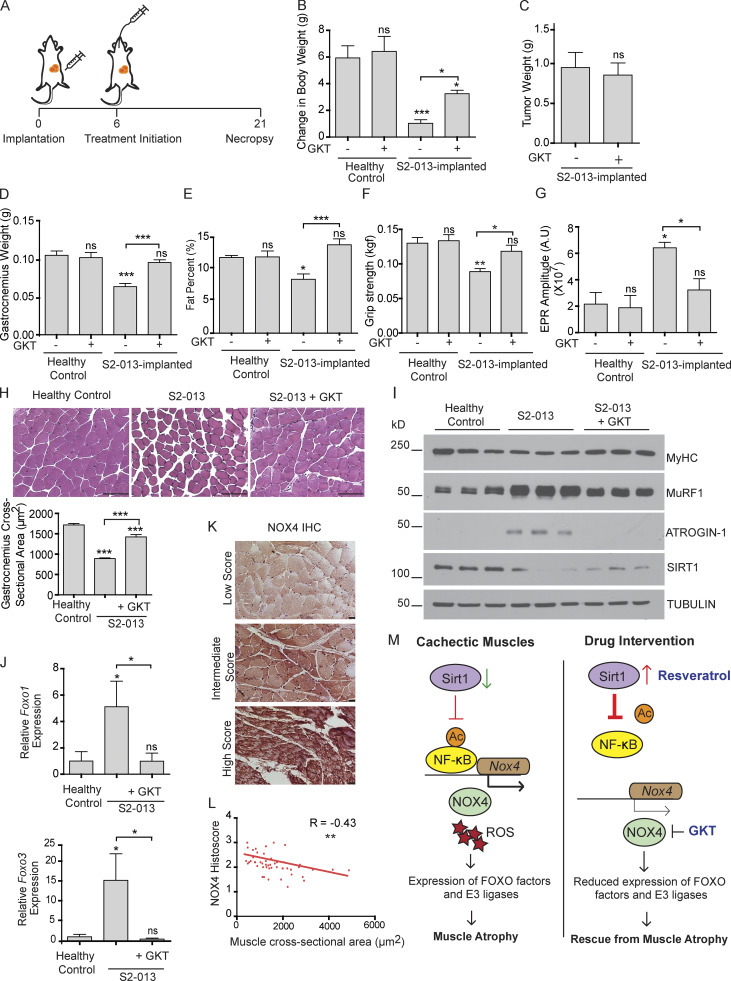
Approximately one third of cancer patients die due to complexities related to cachexia. However, the mechanisms of cachexia and the potential therapeutic interventions remain poorly studied. We observed a significant positive correlation between SIRT1 expression and muscle fiber cross-sectional area in pancreatic cancer patients. Rescuing Sirt1 expression by exogenous expression or pharmacological agents reverted cancer cell-induced myotube wasting in culture conditions and mouse models. RNA-seq and follow-up analyses showed cancer cell-mediated SIRT1 loss induced NF-κB signaling in cachectic muscles that enhanced the expression of FOXO transcription factors and NADPH oxidase 4 (Nox4), a key regulator of reactive oxygen species production. Additionally, we observed a negative correlation between NOX4 expression and skeletal muscle fiber cross-sectional area in pancreatic cancer patients. Knocking out Nox4 in skeletal muscles or pharmacological blockade of Nox4 activity abrogated tumor-induced cachexia in mice. Thus, we conclude that targeting the Sirt1-Nox4 axis in muscles is an effective therapeutic intervention for mitigating pancreatic cancer-induced cachexia.


Conflict of interest statement

Disclosures: D.A. Tuveson reported "other" from Surface Oncology, Leap Therapeutics, and Cygnal Therapeutics; grants from ONO and Fibrogen; personal fees from Chugai and Merck outside the submitted work; SAB, stock from Surface Oncology, Leap Therapeutics, and Cygnal Therapeutics; sponsored research from ONO and Fibrogen; and honoraria from Chugai and Merck. No other disclosures were reported.

Figures

None
Graphical abstract
Figure 1.
Figure 1.
Sirt1 expression decreases in cachectic muscles. (A) Sirt1 mRNA expression in KPC mouse gastrocnemius muscles (n = 3) at 10, 15, and 25 wk after birth. (B) Representative immunohistochemical micrographs of SIRT1 staining in skeletal muscles of pancreatic cancer patients. (C) Correlation of the average skeletal muscle fiber cross section area with the SIRT1 histoscore in 54 muscle autopsy samples of pancreatic cancer patients. R depicts Pearson’s correlation coefficient and P < 0.0001. (D) Sirt1 mRNA expression in myotubes treated with S2-013, T3M4, KPC1245, and KPC1199 CM for 24 h. (E–J) Brightfield microscopy images (at 200×; E), myotube width quantification (F), relative protein content (G), protein lysate immunoblot analysis of MyHC (H), and mRNA expression of Trim63 (MuRF-1) and Fbxo32 (Atrogin-1; I and J) in C2C12 myotubes transfected with either adenoviral GFP or Sirt1 and treated with S2-013 and T3M4-CM for 24 h. Scale bars represent 75 µm. Data are presented as mean ± SEM and were compared with Student’s t test (A), one-way ANOVA with Dunnett’s (D), or Bonferroni’s (F, G, I, and J) multiple comparisons. *, P < 0.05; **, P < 0.01; ***, P< 0.001. ns, not significant. All the in vitro experiments were verified in at least two independent experiments.
Figure S1.
Figure S1.
Muscle wasting with disease progression in KPC mice and colon cancer cachexia model. (A) Sirtuin mRNA expression in gastrocnemius muscles from KPC mice at 10, 15, and 25 wk of age. (B) Gastrocnemius muscle weights and (C) hematoxylin and eosin–stained pancreas sections of control and KPC mice at 10, 15, and 25 wk of age, (D) mRNA expression of Trim63 and Fbxo32 in muscles of control and KPC mice at 10, 15, and 25 wk of age. (E) Sirtuin mRNA expression in gastrocnemius muscles from C26 tumor-bearing mice at 21 d after implantation (n = 5 in each group). Scale bars represent 93.4 µm. Data are mean ± SEM compared with Student’s t test. *, P < 0.05; **, P < 0.01.
Figure S2.
Figure S2.
In vitro characterization of sirtuins and metabolite abundance. (A) Sirt2, Sirt3, Sirt4, Sirt5, Sirt6, and Sirt7 mRNA expression in control myotubes and myotubes treated with S2-013, T3M4, KPC1245, and KPC1199 CM for 24 h. (B) Sirt1 activity in control myotubes and myotubes treated with S2-013 and T3M4 CM for 24 h. (C) Relative metabolite levels in DMEM and HPNE and S2-013 CM. (D) Relative protein content of C2C12 myotubes treated with DMEM and HPNE CM, S2-013 CM, and S2-013 CM + supplements (Supp; metabolites that decreased >25% in S2-013 CM relative to DMEM). (E) Caspase 3/7 activity in control and cancer cell CM–treated C2C12 myotubes. Data are mean ± SEM compared with one-way ANOVA with Dunnett’s (A–D) multiple comparisons and Student’s t test (E). *, P < 0.05; **, P < 0.01; ***, P < 0.001. In vitro experiments were verified in at least two independent experiments.
Figure 2.
Figure 2.
Modulation of SIRT1 levels by resveratrol combats muscle wasting in vitro. (A) Brightfield microscopy images (at 200×) of myotubes treated with S2-013 and T3M4 CM with and without resveratrol (50 µM) treatment for 24 h. Scale bars represent 50 µm. (B) Myotube width was measured by ImageJ. Five measurements were taken along the length of each myotube. (C) Immunoblots of MyHC, Atrogin-1, and MuRF-1 in myotubes treated with S2-013 and T3M4 CM along with resveratrol treatment for 24 h. Tubulin was used as a loading control. Quantification of band intensity was performed via Li-Cor Image Studio Lite and values normalized to the untreated control and to tubulin are indicated below the bands. (D–F) mRNA expression of Trim63 (MuRF-1), Fbxo32 (Atrogin-1), and Sirt1 in myotubes treated with S2-013 and T3M4 CM along with resveratrol (50 µM) for 24 h. (G) MTT assay demonstrating the dose-dependent effect of resveratrol on S2-013 and T3M4 cell survival 72 h after treatment. (H) Immunoblot of SIRT1 in S2-013 cells. Tubulin was used as a loading control. (I) Relative survival of S2-013 shScr, shSIRT1-A, and shSIRT1-B upon resveratrol treatment for 72 h (25 µM) by MTT assays. (J) Protein content in myotubes treated with S2-013 shScr CM, S2-013 shSIRT1-A CM, S2-013 shSIRT1-B CM along with resveratrol (50 µM). All the experiments were performed at least three times in triplicate. Data are mean ± SEM compared with one-way ANOVA with Bonferroni’s (B, D–F, and J) or Dunnett’s (G) multiple comparisons. A two-way ANOVA with Bonferroni’s post-hoc analysis was used considering the interaction between treatment and cell line (I). *, P < 0.05; **, P < 0.01; ***, P < 0.001. All the in vitro experiments were verified in at least two independent experiments.
Figure S3.
Figure S3.
Effect of SIRT1 manipulation in cancer cells on adipose tissue muscle wasting and redox regulators. (A) Cell survival assay of S2-013 cells treated with resveratrol (50 µM), Ex-527 (0.1 µM), or both for 72 h. (B) Gastrocnemius muscle weight of control and PBS-injected mice. (C) Relative mRNA levels of Zag (Zinc α2-glycoprotein) and Ucp 1-3 in adipose tissues of tumor-bearing mice with and without resveratrol treatment. (D) SIRT1 staining in gastrocnemius muscles of healthy controls and tumor-bearing mice treated with vehicle control or resveratrol. Scale bars represent 250 µm. (E) The mRNA levels of redox regulators in gastrocnemius muscles of tumor-bearing mice with and without resveratrol treatment (n = 3 for each group): Nox1–Nox3, superoxide dismutase 1–3 (Sod1Sod3), glutathione peroxidase 1–4 (Gpx1–Gpx4), Catalase, and thioredoxin 1–3 (Trdxn1Trdxn3). Data are mean ± SEM compared with one-way ANOVA with Bonferroni’s (A, C, and E) multiple comparisons or Student’s t test (B). *, P < 0.05, **, P < 0.01; ***, P < 0.001. In vitro experiments were verified in at least two independent experiments.
Figure 3.
Figure 3.
SIRT1 stabilization in muscles regulates muscles wasting in vivo. (A) Schematic illustration of the treatment strategy. (B and C) Postnecropsy measurements of S2-013 shScr (n = 10), shSIRT1-A (n = 10), and shSIRT1-B (n = 10) tumor weights (B) and tumor volumes (C). (D) Change in body weight measurements of the tumor-bearing mice 21 d after implantation. (E) Postnecropsy gastrocnemius muscle weight from S2-013 shScr, S2-013 shSIRT1-A, and S2-013 shSIRT1-B tumor-bearing mice. (F) Quantification of muscle fiber cross-sectional area in hematoxylin and eosin–stained muscle sections from tumor-bearing mice. (G) Measurement of grip strength of the tumor-bearing mice 18 d after implantation. (H) Measurement of fat percentage of S2-013 shScr (n = 8), S2-013 shSIRT1-A (n = 8), and S2-013 shSIRT1-B (n = 8) tumor-bearing mice by dual-energy x-ray absorptiometry scanning 18 d after implantation. (I) Immunoblots of muscle tissue extracts from the tumor-bearing mice treated with resveratrol or solvent control, showing regulation of MyHC, Atrogin-1, MuRF1, and SIRT1. Tubulin was used as a loading control. All in vitro experiments were performed at least three times in triplicate. Data are mean ± SEM compared with one-way ANOVA with Bonferroni’s multiple comparisons (B–H); *, P < 0.05; **, P < 0.01; ***, P < 0.001.
Figure 4.
Figure 4.
SIRT1 modulates transcriptional regulation by NF-κB and FOXO proteins. (A) Schematic illustration of the flow chart of RNA-seq analysis of myotubes treated with control, CM, or CM with resveratrol (Res). (B) Heatmap showing the Z-score changes in the three comparisons. 9 out of 101 pathways in the transcription factor database from TFactS were significantly altered. (C) GSEA plots of genes regulated by FOXO1 and FOXO3. The NESs for FOXO1 are 2.07 (CM treated vs. control) and −1.9 (CM + Res treated vs. CM treated) pathway. The NESs for FOXO3 are 2.5 (CM treated vs. control) and 1.6 (CM + Res treated vs. CM treated). Green line indicates enrichment profile, black vertical lines indicate hits, and gray vertical lines indicate ranking metric scores. (D) GSEA plots for NF-κB. NESs for NF-κB are 2.91 (CM treated vs. control) and 1.6 (CM + Res treated vs. CM treated). Green line indicates enrichment profile, black vertical lines indicate hits, and gray vertical lines indicate ranking metric scores. (E) mRNA levels of Foxo1 and Foxo3 in myotubes upon treatment with tumor cell CM and resveratrol (50 µM). (F) Immunoblots showing altered levels of FOXO1, FOXO3, and SIRT1 in myotubes treated with tumor cell CM and resveratrol (50 µM) for 24 h. (G) Foxo1 and Foxo3 mRNA analysis of myotubes expressing adenovirally transduced (Ad) GFP control or SIRT1 upon treatment with tumor cell CM for 24 h. (H) Luciferase assay to measure NF-κB–responsive promoter-luciferase reporter activity upon treatment of myotubes with cancer cell CM with and without resveratrol (50 µM) for 6 h. (I) Immunoblot analysis of acetylated and total p65 subunit of NF-κB in myotubes treated with cancer cell CM with and without resveratrol (50 µM) for 24 h. Data are mean ± SEM compared with one-way ANOVA with Bonferroni’s multiple comparisons (E, G, and H). *, P < 0.05; **, P < 0.01; ***, P < 0.001. The in vitro experiments were verified in at least two independent experiments.
Figure 5.
Figure 5.
SIRT1 stabilization diminishes ROS levels in cachectic muscles. (A) ROS levels in C2C12 myotubes after treatment with cancer cell CM with or without resveratrol for 8 h. (B) The mRNA levels of Nox4 in the gastrocnemius muscles from tumor cell-implanted mice (n = 3 for each group) with and without resveratrol treatment. (C) ChIP analyses demonstrating distal (−1,047) and proximal (−369) Nox4 promoter region occupancy by NF-κB. All groups are compared with the control. (D) Nox4 mRNA levels in C2C12 myotubes treated with cancer cell CM and NBD. (E) Nox4 mRNA levels in KPC mice muscles at 10, 15, and 25 wk of age (n = 3). (F) Brightfield microscopy images (at 200×) demonstrating thinning of the myotubes upon Nox4 overexpression. Scale bars represent 250 µm. (G) Immunoblot analysis of Nox4 overexpressing myotube extracts depicting decrease in the levels of myosin heavy chain. Tubulin was used as a loading control. (H) Foxo1 and Foxo3 mRNA levels in C2C12 myotubes upon Nox4 overexpression for 48 h. (I) Nox4 mRNA level in C2C12 myotubes upon treatment with cancer cell CM with or without adenoviral (Ad) expression of Sirt1. Data are mean ± SEM compared with one-way ANOVA with Bonferroni’s multiple comparisons (A, B, C, D, and I) or Student’s t test (E and H). *, P < 0.05; **, P < 0.01; ***, P < 0.001. In vitro experiments were verified in at least two independent experiments.
Figure S4.
Figure S4.
Evaluation of NOX4 and atrophy markers upon SIRT1 stabilization and NF-κB inhibition. (A) Representative images of NOX4-stained sections of gastrocnemius muscles of S2-013-implanted mice with and without resveratrol treatment. Scale bars represent 116.9 µm. (B) Immunoblots of C2C12 myotubes treated with S2-013 CM with and without Sirt1 overexpression. (C) mRNA levels of Trim63 and Fbxo32 in C2C12 myotubes treated with cancer cell CM and NBD for 24 h. (D) mRNA levels of Nox4, Foxo1, Foxo3, Fbxo32, and Trim63 in the gastrocnemius muscles of healthy control and C26 tumor-bearing mice (n = 5 in each group). Data are mean ± SEM compared with one-way ANOVA with Bonferroni’s (C) multiple comparisons or Student’s t test (D). *, P < 0.05; **, P < 0.01; ***, P < 0.001. In vitro experiments were verified in at least two independent experiments.
Figure S5.
Figure S5.
The SIRT1–NOX4 axis of myodegeneration. (A) Schematic illustration of the proposed pathway. (B) mRNA levels of Trim63 and Fbxo32 in C2C12 myotubes treated with control or cancer cell CM with solvent control or GKT137831 (10 µM), AS1842856 (0.1 µM; FOXO1 inhibitor), and BMX-001 (1 µM) for 24 h. (C) Postnecropsy tumor weights from tumor-implanted Nox4 WT and Nox4 KO mice. (D) Kaplan-Meier survival analysis of S2-013 tumor-bearing mice treated solvent control, GKT137831 (GKT), or resveratrol (n = 10 mice in each group). (E) Relative glucose uptake in S2-013 and T3M4 cells upon resveratrol treatment (50 µM) for 24 h. (F) Glucose uptake in S2-013 and T3M4 cells upon Ex-527 (0.5 µM) treatment for 24 h. (G) Glucose uptake in C2C12 myotubes upon treatment with cancer cell CM with solvent control or resveratrol for 24 h. (H) mRNA expression of SLC2A1-4 in S2-013 cells and C2C12 myotubes. (I) mRNA expression of Sirt1 in the C2C12 myotubes upon treatment with solvent control or TGF-β (20 ng/ml) for 24 h. Data are mean ± SEM compared with one-way ANOVA with Bonferroni’s (B and G) multiple comparisons, Student’s t test (C, E, F, H, and I), or log-rank (Mantel-Cox) test (D). *, P < 0.05; **, P < 0.01; ***, P < 0.001. In vitro experiments were verified in at least two independent experiments.
Figure 6.
Figure 6.
Nox4 overexpression drives cachexia in orthotopic pancreatic tumor models. (A) Schematic illustration of pancreatic cancer cachexia model using Nox4fl/fl; ACTA1-cre/Esr1 mice. (B) Immunoblot analysis of muscle extracts from control and Nox4 KO mice depicting deletion of Nox4 in the muscles. Actin was used as a loading control. (C) Change in body weight of mice after 21 d of implantation. (D) Grip strength of tumor-bearing Nox4 WT and Nox4 KO mice on day 18 after implantation. (E) Postnecropsy gastrocnemius muscle weight of healthy control (n = 10), tumor-bearing Nox4 WT (n = 8), and tumor-bearing Nox4 KO (n = 8) mice. (F) Representative hematoxylin and eosin-stained muscle sections depicting changes in the muscle fiber cross-sectional area. Scale bars represent 25 µm. (G) Quantification of the gastrocnemius muscle cross-sectional area of healthy controls and tumor-implanted mice (n = 3). (H) Immunoblot analyses of muscle extracts from Nox4 WT and Nox4 KO tumor-bearing mice. (I) Foxo1 and Foxo3 mRNA levels in gastrocnemius muscles from control and tumor-implanted mice (n = 5 for each group). Data are mean ± SEM compared by one-way ANOVA with Bonferroni’s multiple comparisons (C–E, G, and I). *, P < 0.05; ***, P < 0.001.
Figure 7.
Figure 7.
Pharmacological inhibition of NOX4 rescues muscle wasting in a cancer cachexia model. (A) Schematic illustration of S2-013 tumor cell implantation and GKT137831 (GKT) therapy initiation in athymic nude mice. (B) Change in the mouse body weight 21 d after implantation for healthy controls (n = 9), healthy controls with GKT (n = 4), S2-013 implanted (n = 9), and S2-013 implanted with GKT treatment (n = 10). (C and D) Postnecropsy tumor weight (C) and gastrocnemius muscle weight (D) for S2-013–implanted mice with and without GKT treatment. (E) Body fat percentage at day 18 in tumor-bearing mice with and without GKT treatment. (F) Grip strength measurements on day 18 after implantation. (G) Gastrocnemius muscle ROS measurement by EPR in tumor-bearing mice with and without GKT treatment (n = 5 for each group). (H) Representative images of hematoxylin and eosin–stained gastrocnemius muscle cross sections. Quantification of the cross-sectional area measured via ImageJ (n = 3). Scale bars represent 100 µm. (I) Immunoblot analysis of gastrocnemius muscle extracts from mice with indicted treatments. (J) Foxo1 and Foxo3 mRNA levels in gastrocnemius muscles from mice with indicted treatments (n = 3 for each group). (K) Representative images of NOX4-stained human muscle specimens. Scale bars represent 25 μm. (L) Correlation of Nox4 staining histoscore and muscle fiber cross-sectional area in skeletal muscles from human pancreatic cancer patients (n = 47). (M) Schematic illustration of the action of resveratrol and GKT as potential therapeutic interventions in combating muscle wasting in cancer. Data are mean ± SEM compared with one-way ANOVA with Bonferroni’s multiple comparisons (B, D–H, and J) or Student’s t test (C). *, P < 0.05; **, P < 0.01; ***, P < 0.001.

References

    1. Aapro M., Arends J., Bozzetti F., Fearon K., Grunberg S.M., Herrstedt J., Hopkinson J., Jacquelin-Ravel N., Jatoi A., Kaasa S., et al. ; ESMO (European School of Medical Oncology) . 2014. Early recognition of malnutrition and cachexia in the cancer patient: a position paper of a European School of Oncology Task Force. Ann. Oncol. 25:1492–1499. 10.1093/annonc/mdu085 - DOI - PubMed
    1. Abrego J., Gunda V., Vernucci E., Shukla S.K., King R.J., Dasgupta A., Goode G., Murthy D., Yu F., and Singh P.K.. 2017. GOT1-mediated anaplerotic glutamine metabolism regulates chronic acidosis stress in pancreatic cancer cells. Cancer Lett. 400:37–46. 10.1016/j.canlet.2017.04.029 - DOI - PMC - PubMed
    1. Ábrigo J., Elorza A.A., Riedel C.A., Vilos C., Simon F., Cabrera D., Estrada L., and Cabello-Verrugio C.. 2018. Role of Oxidative Stress as Key Regulator of Muscle Wasting during Cachexia. Oxid. Med. Cell. Longev. 2018 2063179 10.1155/2018/2063179 - DOI - PMC - PubMed
    1. Amat R., Planavila A., Chen S.L., Iglesias R., Giralt M., and Villarroya F.. 2009. SIRT1 controls the transcription of the peroxisome proliferator-activated receptor-gamma Co-activator-1alpha (PGC-1alpha) gene in skeletal muscle through the PGC-1alpha autoregulatory loop and interaction with MyoD. J. Biol. Chem. 284:21872–21880. 10.1074/jbc.M109.022749 - DOI - PMC - PubMed
    1. Archambeau J.O., Tovmasyan A., Pearlstein R.D., Crapo J.D., and Batinic-Haberle I.. 2013. Superoxide dismutase mimic, MnTE-2-PyP(5+) ameliorates acute and chronic proctitis following focal proton irradiation of the rat rectum. Redox Biol. 1:599–607. 10.1016/j.redox.2013.10.002 - DOI - PMC - PubMed

Publication types

MeSH terms