. 2021 Aug;158(3):724-736.
doi: 10.1111/jnc.15096. Epub 2020 Jun 15.

Receptor for advanced glycation end products up-regulation in cerebral endothelial cells mediates cerebrovascular-related amyloid β accumulation after Porphyromonas gingivalis infection

Affiliations

Receptor for advanced glycation end products up-regulation in cerebral endothelial cells mediates cerebrovascular-related amyloid β accumulation after Porphyromonas gingivalis infection

Fan Zeng et al. J Neurochem. 2021 Aug.

Abstract

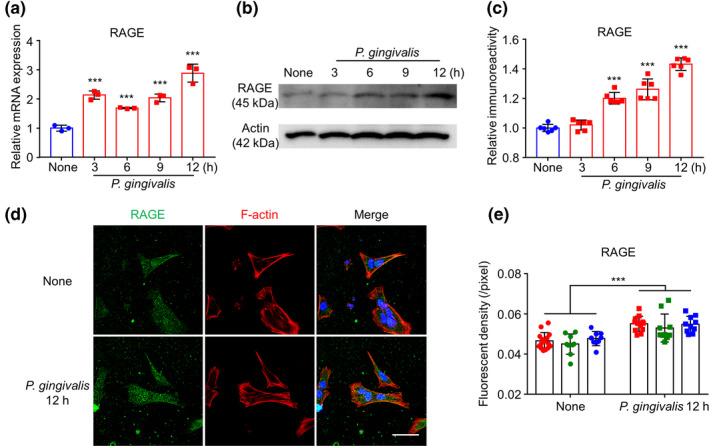
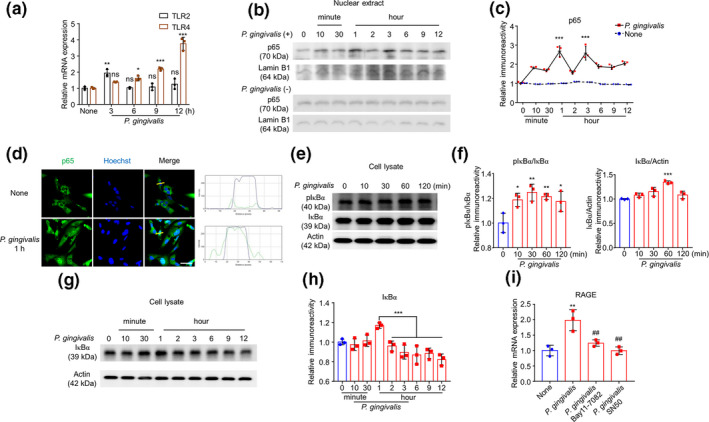
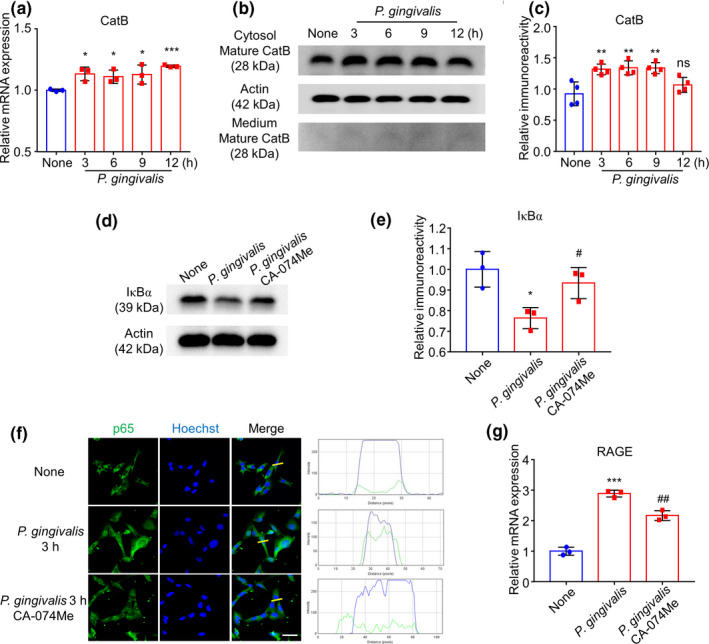
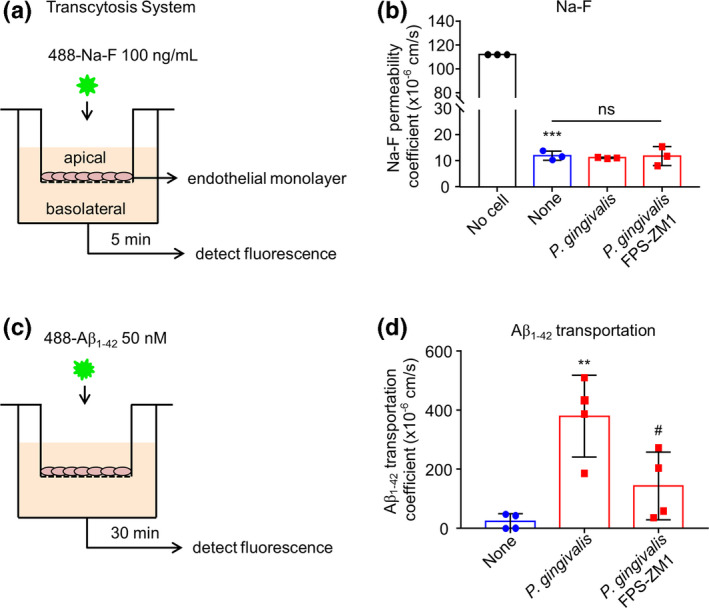
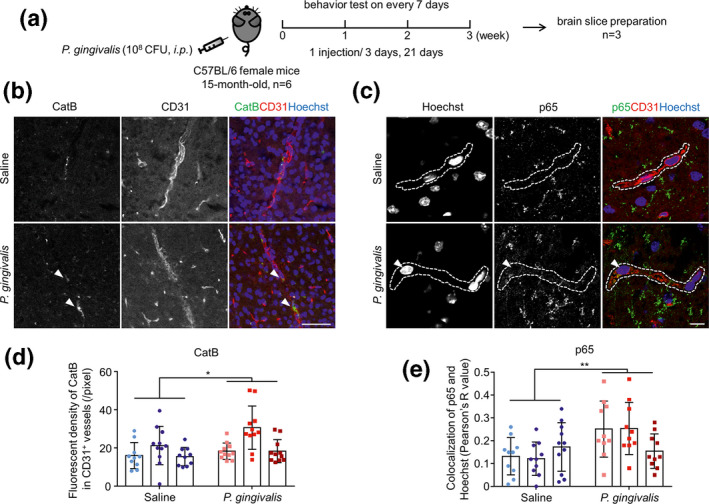
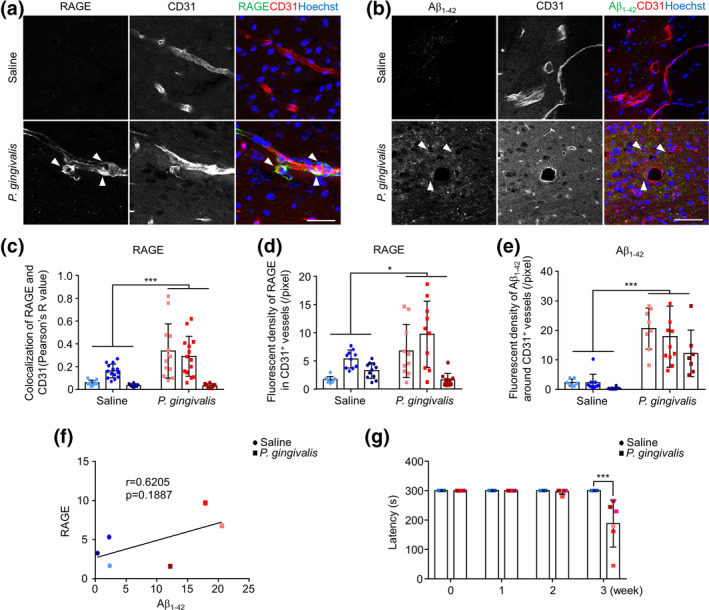
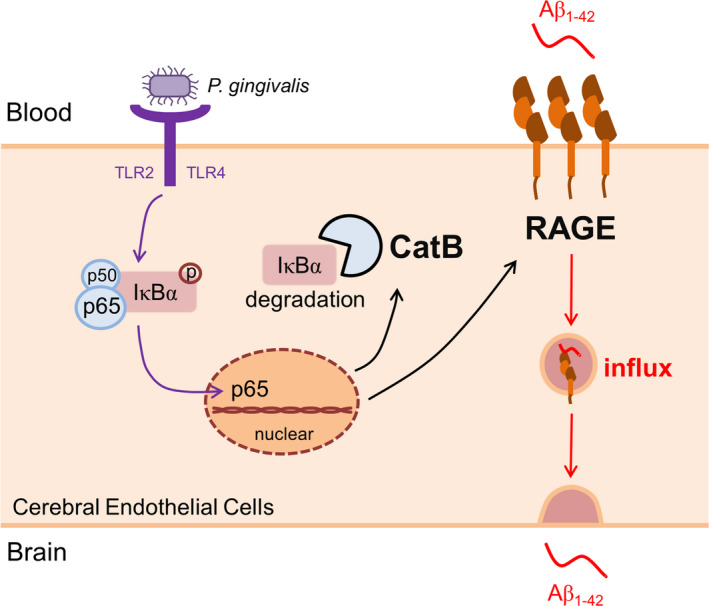
Cerebrovascular-related amyloidogenesis is found in over 80% of Alzheimer's disease (AD) cases, and amyloid β (Aβ) generation is increased in the peripheral macrophages during infection of Porphyromonas gingivalis (P. gingivalis), a causal bacterium for periodontitis. In this study, we focused on receptor for advanced glycation end products (RAGE), the key molecule involves in Aβ influx after P. gingivalis infection to test our hypothesis that Aβ transportation from periphery into the brain, known as "Aβ influx," is enhanced by P. gingivalis infection. Using cultured hCMEC/D3 cell line, in comparison to uninfected cells, directly infection with P. gingivalis (multiplicity of infection, MOI = 5) significantly increased a time-dependent RAGE expression resulting in a dramatic increase in Aβ influx in the hCMEC/D3 cells; the P. gingivalis-up-regulated RAGE expression was significantly decreased by NF-κB and Cathepsin B (CatB)-specific inhibitors, and the P.gingivalis-increased IκBα degradation was significantly decreased by CatB-specific inhibitor. Furthermore, the P. gingivalis-increased Aβ influx was significantly reduced by RAGE-specific inhibitor. Using 15-month-old mice (C57BL/6JJmsSlc, female), in comparison to non-infection mice, systemic P. gingivalis infection for three consecutive weeks (1 × 10⁸ CFU/mouse, every 3 days, intraperitoneally) significantly increased the RAGE expression in the CD31-positive endothelial cells and the Aβ loads around the CD31-positive cells in the mice's brains. The RAGE expression in the CD31-positive cells was positively correlated with the Aβ loads. These observations demonstrate that the up-regulated RAGE expression in cerebral endothelial cells mediates the Aβ influx after P. gingivalis infection, and CatB plays a critical role in regulating the NF-κB/RAGE expression. Cover Image for this issue: https://doi.org/10.1111/jnc.15073.

Keywords: Porphyromonas gingivalis; NF-κB; amyloid β; cathepsin B; cerebral endothelial cells; receptor for advanced Glycation end products.


Conflict of interest statement

The authors F. Zeng, J. Ni, Y. Liu, W. Huang, H. Qing, T. Kadowaki, H. Kashiwazaki, and Z. Wu declare that they have no conflict of interest.

Figures

FIGURE 1
FIGURE 1
RAGE expression increased in hCMEC/D3 cells after P. gingivalis infection. (a) The mean mRNA expression level of RAGE increased in cultured hCMEC/D3 cells after P. gingivalis infection (n = 3 independent cell culture preparations, ***p < .001; one‐way ANOVA). Asterisks indicate a statistically significant difference versus “None” group. (b) The immunoblots show RAGE increased in hCMEC/D3 cells after P. gingivalis infection. (c) The quantitative analysis of RAGE in the immunoblots in (b) (n = 6 independent cell culture preparations, ***p < .001; one‐way ANOVA). Asterisks indicate a statistically significant difference versus “None” group. (d) The immunofluorescent CLMS images of RAGE (green) in hCMEC/D3 cells with Hoechst‐stained nuclei (blue) and F‐actin (red) 12 hr after P. gingivalis infection. Scale bar, 50 μm. (e) The quantitative analysis of RAGE fluorescence density in the images in (d) (each color represents one independent cell culture preparations, ***p < .01; multiple t‐test). Asterisks indicate a statistically significant difference versus “None” group
FIGURE 2
FIGURE 2
RAGE elevation was dependent on NF‐κB activation in hCMEC/D3 cells after P. gingivalis infection. (a) The mean mRNA expression level of TLR2/4 in cultured hCMEC/D3 cells after P. gingivalis infection (n = 3 independent cell culture preparations, ns: no significant difference, *p < .05, **p < .01, ***p < .001; one‐way ANOVA). Asterisksindicate a statistically significant difference versus “None” group. (b) The immunoblot images show p65 in nuclear extract with or without P. gingivalis infection. (c) The quantitative analysis of p65 in the immunoblots shown in (b) (n = 3 independent cell culture preparations, ***p < .001; two‐way ANOVA). Asterisks indicate a statistically significant difference versus “None” group. (d) The immunofluorescent CLMS images indicating the nuclear translocation of p65 (green) in hCMEC/D3 cells with Hoechst‐stained nuclei (blue) after P. gingivalis infection for 1 hr. Scale bar, 50 μm. (e) The immunoblot images show pIκBα and IκBα in cell lysate in hCMEC/D3 cells after P. gingivalis infection. (f) The quantitative analysis of immunoblots shown in (e), pIκBα/IκBα (left) and IκBα/Actin (right) (n = 3 independent cell culture preparations, *p < .05, **p < .01, ***p < .001; one‐way ANOVA). Asterisks indicate a statistically significant difference versus “0” group. (g) The immunoblots show IκBα degradation in cell lysate after P. gingivalis infection. (h) The quantitative analysis of IκBα in the immunoblots shown in (g) (n = 3 independent cell culture preparations; one‐way ANOVA) (i) The effects of Bay11‐7082 and SN50, two specific NF‐κB inhibitors, on the mRNA expression of RAGE in hCMEC/D3 cells after P. gingivalis infection for 12 hr (n = 3 independent cell culture preparations, **p < .01, ## p < .01; one‐way ANOVA). Asterisks indicate a statistically significant difference versus “None” group and pounds indicate a statistically significant difference versus “P. gingivalis” group
FIGURE 3
FIGURE 3
CatB/NF‐κB pathway regulated late‐phase expression of RAGE after P. gingivalis infection. (a) The mean mRNA expression level of CatB of cultured hCMEC/D3 cells increased after P. gingivalis infection (n = 3 independent cell culture preparations, *p < .05, ***p < .001; one‐way ANOVA). Asterisks indicate a statistically significant difference versus “None” group. (b) The immunoblots show mature CatB in cytosol and medium in hCMEC/D3 after P. gingivalis infection. (c) The quantitative analysis of cytosol CatB in (b) (n = 4 independent cell culture preparations, ns: no significant difference, **p < .01; one‐way ANOVA). Asterisks indicate a statistically significant difference versus “None” group. (d) The effect of CA‐074Me, a specific CatB inhibitor, on IκBα degradation after P. gingivalis infection for 12 hr. (e) The quantitative analysis of (d) (n = 3 independent cell culture preparations, *p < .05, # p < .05; one‐way ANOVA). Asterisks indicate a statistically significant difference versus “None” group and pounds indicate a statistically significant difference versus “P. gingivalis” group. (f) The effect of CA‐074Me on the nuclear translocation of p65 (green) in hCMEC/D3 cells with Hoechst‐stained nuclei (blue) at 3 hr after P. gingivalis infection. Scale bar, 50 μm. (g) The effect of CA‐074Me on the mRNA expression of RAGE in hCMEC/D3 cells after P. gingivalis infection (n = 3 independent cell culture preparations, ***p < .001, ## p < .01; one‐way ANOVA). Asterisks indicate a statistically significant difference versus “None” group and pounds indicate a statistically significant difference versus “P. gingivalis” group
FIGURE 4
FIGURE 4
RAGE expression mediated Aβ1‐42 transportation after P. gingivalis infection in a transcytosis system. (a) The schematic of the in vitro transcytosis system for Na‐F transportation. (b) The quantitative analysis of Na‐F (100 ng/mL) permeability after P. gingivalis infection for 12 hr in the presence or absence of FPS‐ZM1 pre‐treatment. The “No cell” means no cell in the transcytosis system (n = 3 independent cell culture preparations, ns: no significant difference, ***p < .001; one‐way ANOVA). Asterisks indicate a statistically significant difference versus “No cell” group and “ns” indicates the result compared with “None” group. (c) The schematic of the in vitro transcytosis system for Aβ1‐42 transportation. (d) The transportation of Aβ1‐42 from apical to basolateral compartment after P. gingivalis infection for 12 hr. (n = 4 independent cell culture preparations, **p < .01, # p < .05, one‐way ANOVA). Asterisks indicate a statistically significant difference compared with “None” group and pounds indicate a statistically significant difference compared with “P. gingivalis” group
FIGURE 5
FIGURE 5
Increased CatB and translocation of p65 in cerebral endothelial cells of mice after systemic P. gingivalis infection. (a) Time schedule of systemic P. gingivalis infection and behavior test. (b) The immunofluorescent CLMS images of brain slice stained with CatB (green), CD31 (red), and Hoechst (blue) after systemic P. gingivalis infection. (c) The immunofluorescent CLMS images of brain slice stained with p65 (green), CD31 (red), and Hoechst (blue) after systemic P. gingivalis infection. Dash lines marked the location of blood vessels. (d) The quantitative analysis of CatB fluorescence density in CD31+ vessels in the images in (b). (e) Co‐localization analysis of p65 and Hoechst in the images in (c) using ImageJ (COLOC 2 plugin of Fiji is just ImageJ). Three mice per group were used and each mouse has its own color. Asterisks indicate a statistically significant difference versus “Saline” group using multiple t‐test. *p < .05, **p < .01. Scale bars in b: 50 μm; c: 10 μm
FIGURE 6
FIGURE 6
Increased RAGE expression in cerebral endothelial cells and the induction of Aβ1‐42 around cerebral endothelial cells of mice after systemic P. gingivalis infection. (a) The immunofluorescent CLMS images of brain slice stained with RAGE (green), CD31 (red), and Hoechst (blue) after systemic P. gingivalis infection. (b) The immunofluorescent CLMS images of brain slice stained with Aβ1‐42 (green), CD31 (red), and Hoechst (blue) after systemic P. gingivalis infection. (c) Co‐localization analysis of RAGE and CD31 in the images in (a) using COLOC 2 plugin. (d)The quantitative analysis of RAGE fluorescence density in CD31+ vessels in the images in (a). (e) The quantitative analysis of Aβ1‐42 fluorescence density around CD31+ vessels in the images in (b). (f) Pearson's correlation between the fluorescence density of RAGE and Aβ1‐42. (a–f) Three mice per group were used and each mouse has its own color. (g) Memory decline in mice after 3 weeks of systemic P. gingivalis infection (n = 6 mice/group). Asterisks indicate a statistically significant difference versus “Saline” group using multiple t‐test. *p < .05, **p < .01, ***p < .001. Scale bar, 50 μm
FIGURE 7
FIGURE 7
The schematic of the critical role of RAGE in cerebral endothelial cell after P. gingivalis infection. P. gingivalis activates NF‐κB pathway through binding TLR2/4, triggers transcription of RAGE and CatB. The increased CatB further involves in RAGE up‐regulation via regulating NF‐κB activation. At last, elevated RAGE mediates the influx of Aβ from blood to the brain

Similar articles

Cited by

References

    1. Abbott, N. J., Ronnback, L., & Hansson, E. (2006). Astrocyte‐endothelial interactions at the blood‐brain barrier. Nature Reviews Neuroscience, 7, 41–53. 10.1038/nrn1824 - DOI - PubMed
    1. Attems, J., & Jellinger, K. A. (2014). The overlap between vascular disease and Alzheimer’s disease‐lessons from pathology. BMC Medicine, 12, 206. 10.1186/s12916-014-0206-2 - DOI - PMC - PubMed
    1. Bielecka, E., Scavenius, C., Kantyka, T., Jusko, M., Mizgalska, D., Szmigielski, B., … Potempa, J. (2014). Peptidyl arginine deiminase from Porphyromonas gingivalis abolishes anaphylatoxin C5a activity. Journal of Biological Chemistry, 289, 32481–32487. - PMC - PubMed
    1. Bien, S., Ritter, C. A., Gratz, M., Sperker, B., Sonnemann, J., Beck, J. F., & Kroemer, H. K. (2004). Nuclear factor‐kappaB mediates up‐regulation of cathepsin B by doxorubicin in tumor cells. Molecular Pharmacology, 65, 1092–1102. - PubMed
    1. Bu, X. L., Xiang, Y., Jin, W. S., Wang, J., Shen, L.‐L., Huang, Z.‐L., … Wang, Y.‐J. (2018). Blood‐derived amyloid‐beta protein induces Alzheimer's disease pathologies. Molecular Psychiatry, 23, 1948–1956. - PubMed

Publication types

MeSH terms

Substances