. 2020 May;128(5):57007.
doi: 10.1289/EHP5899. Epub 2020 May 22.

Current and Projected Distributions of Aedes aegypti and Ae. albopictus in Canada and the U.S

Affiliations

Current and Projected Distributions of Aedes aegypti and Ae. albopictus in Canada and the U.S

Salah Uddin Khan et al. Environ Health Perspect. 2020 May.

Abstract

Background: Aedes aegypti and Ae. albopictus are mosquito vectors of more than 22 arboviruses that infect humans.

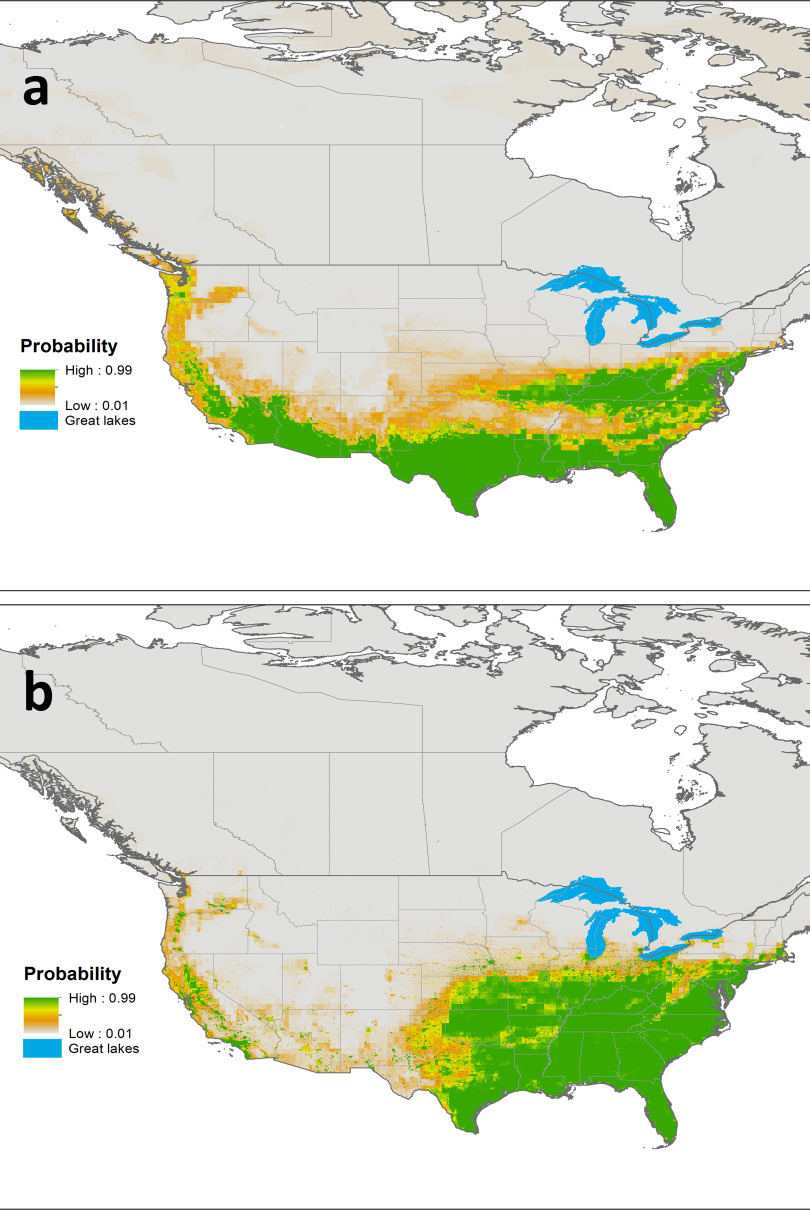
Objectives: Our objective was to develop regional ecological niche models for Ae. aegypti and Ae. albopictus in the conterminous United States and Canada with current observed and simulated climate and land-use data using boosted regression trees (BRTs).

Methods: We used BRTs to assess climatic suitability for Ae. albopictus and Ae. aegypti mosquitoes in Canada and the United States under current and future projected climates.

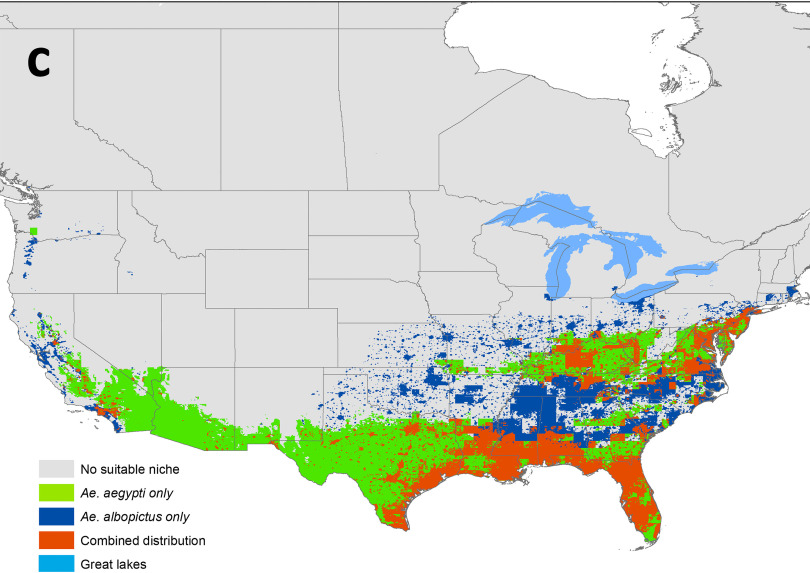
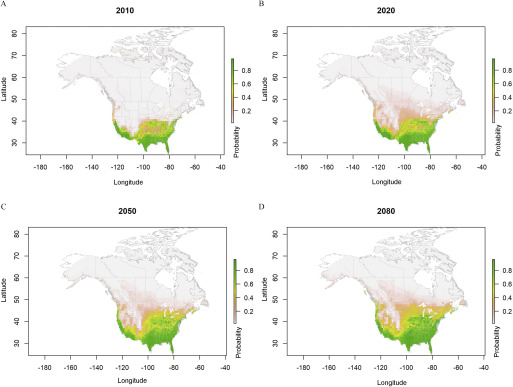
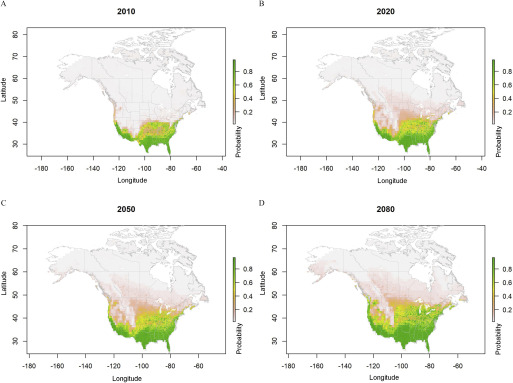
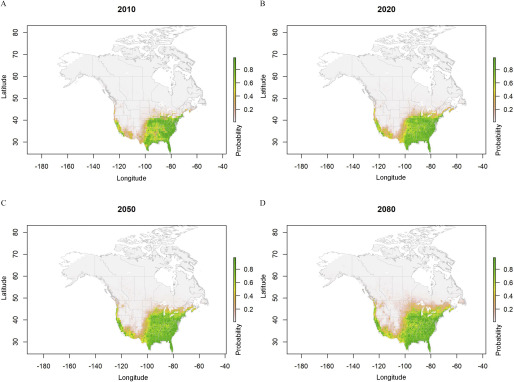
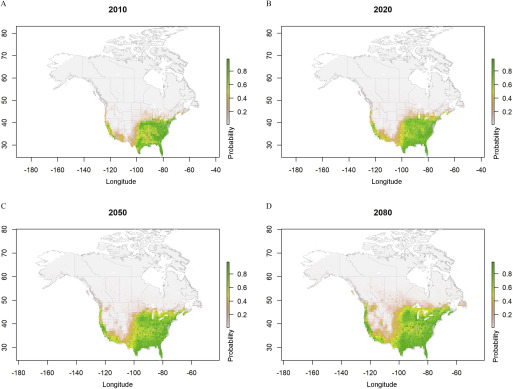
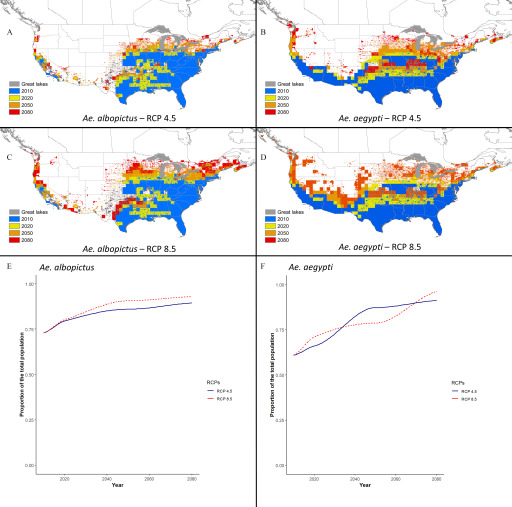
Results: Models for both species were mostly influenced by minimum daily temperature and demonstrated high accuracy for predicting their geographic ranges under the current climate. The northward range expansion of suitable niches for both species was projected under future climate models. Much of the United States and parts of southern Canada are projected to be suitable for both species by 2100, with Ae. albopictus projected to expand its range north earlier this century and further north than Ae. aegypti.

Discussion: Our projections suggest that the suitable ecological niche for Aedes will expand with climate change in Canada and the United States, thus increasing the risk of Aedes-transmitted arboviruses. Increased surveillance for these vectors and the pathogens they carry would be prudent. https://doi.org/10.1289/EHP5899.


Figures

Figures 1a and 1b are maps, displaying the probability of Aedes Aegypti mosquitos and Aedes albopictus mosquitos, respectively, on a scale ranging from high: 0.99 to low: 0.01 and the great lakes in different regions. Figure 1c is a map, displaying the areas with no suitable niche, Aedes aegypti only, Aedes albopictus only, combined distribution, and great lakes.
Figure 1.
Predicted ecological niche (probability from 0 to 1) for (A) Aedes aegypti and (B) Ae. albopictus mosquitoes, and (C) areas predicted to be an ecological niche for Aedes aegypti [True Skill Statistics (TSS): 0.69], Ae. albopictus (TSS: 0.80), in the continental United States and Canada under current climatic conditions (2001–2016). When both species had a suitable ecological niche in a geographical location, a niche overlap was considered.
Figures 2A, 2B, 2C, and 2D comprise a set of four maps titled 2010, 2020, 2050, and 2080, respectively, with latitude ranging from 30 to 80 in increments of 10 across longitude ranging from negative 180 to negative 40 in increments of 20, plotting probability on a scale ranging from 0.2 to 0.8 in increments of 0.2.
Figure 2.
Predicted probabilities for Aedes aegypti ecological niche areas based on ensemble model simulations using four regional climate model data sets (CanRCM4-CanESM2, CRCM5-CanESM2, CRCM5-MPI-ESM-LR, and HIRHAM5-EC-EARTH), under representative concentration pathway (RCP) 4.5 from the year 2006 to 2100. Estimated probabilities shown for (A) 2010, (B) 2020, (C) 2050, and (D) 2080 are climatological conditions averaged over the 2006–2016, 2011–2040, 2041–2070, and 2071–2100 periods, respectively.
Figures 3A, 3B, 3C, and 3D comprise a set of four maps titled 2010, 2020, 2050, and 2080, respectively, with latitude ranging from 30 to 80 in increments of 10 across longitude ranging from negative 180 to negative 40 in increments of 20, plotting probability on a scale ranging from 0.2 to 0.8 in increments of 0.2.
Figure 3.
Predicted probabilities for Aedes aegypti ecological niche areas based on ensemble model simulations using four regional climate model data sets (CanRCM4-CanESM2, CRCM5-CanESM2, CRCM5-MPI-ESM-LR, and HIRHAM5-EC-EARTH), under representative concentration pathway (RCP) 8.5, from the year 2006 to 2100. Estimated probabilities shown for (A) 2010, (B) 2020, (C) 2050, and (D) 2080 are climatological conditions averaged over the 2006–2016, 2011–2040, 2041–2070, and 2071–2100 periods, respectively.
Figures 4A, 4B, 4C, and 4D comprise a set of four maps titled 2010, 2020, 2050, and 2080, respectively, with latitude ranging from 30 to 80 in increments of 10 across longitude ranging from negative 180 to negative 40 in increments of 20, plotting probability on a scale ranging from 0.2 to 0.8 in increments of 0.2.
Figure 4.
Predicted probabilities for Aedes albopictus ecological niche areas based on ensemble model simulations using four regional climate models data sets (CanRCM4-CanESM2, CRCM5-CanESM2, CRCM5-MPI-ESM-LR, and HIRHAM5-EC-EARTH) under representative concentration pathway (RCP) 4.5, from the year 2006 to 2100. Estimated probabilities shown for (A) 2010, (B) 2020, (C) 2050, and (D) 2080 are climatological conditions averaged over the 2006–2016, 2011–2040, 2041–2070, and 2071–2100 periods, respectively.
Figures 5A, 5B, 5C, and 5D comprise a set of four maps titled 2010, 2020, 2050, and 2080, respectively, with latitude ranging from 30 to 80 in increments of 10 across longitude ranging from negative 180 to negative 40 in increments of 20, plotting probability on a scale ranging from 0.2 to 0.8 in increments of 0.2.
Figure 5.
Predicted probabilities for Aedes albopictus ecological niche areas based on ensemble model simulations using four regional climate models data sets (CanRCM4-CanESM2, CRCM5-CanESM2, CRCM5-MPI-ESM-LR, and HIRHAM5-EC-EARTH) under representative concentration pathway (RCP) 8.5, from the year 2006 to 2100. Estimated probabilities shown for (A) 2010, (B) 2020, (C) 2050, and (D) 2080 are climatological conditions averaged over the 2006–2016, 2011–2040, 2041–2070, and 2071–2100 periods, respectively.
Figures 6A and 6C are maps titled Aedes albopictus RCP4.5 and 8.5, respectively, displaying Great lakes and probabilities for the years 2010, 2020, 2050, and 2080. Figures 6B and 6D are maps titled Aedes Aegypti RCP4.5 and 8.5, respectively, displaying Great lakes and probabilities for the years 2010, 2020, 2050, and 2080. Figure 6E and 6F are graphs titled Aedes albopictus and Aedes Aegypti, respectively, plotting proportion of the total population ranging from 0.00 to 1.00 with increments of 0.25 (y-axis) across year ranging from 2020 to 2080 with increments of 2 years (x-axis) for RCP4.5 and 8.5.
Figure 6.
An overview of the ecological niche expansion of Aedes albopictus and Ae. aegypti mosquitoes from 2006–2100 under moderate (RCP4.5) and high (RCP8.5) representative concentration pathways (RCP) scenarios and the proportion of humans living within the projected ecological niche. (A–D) The ecological niche expansion from 2010 to 2080, with Ae. albopictus, RCP4.5 and RCP8.5, (A and C, respectively) and Ae. aegypti, RCP4.5 and RCP8.5, (B and D, respectively). True Skill Statistics (TSS: 0.53 for Ae. aegypti, and TSS: 0.65 for Ae. albopictus) were calculated to determine the cutoffs for the presence of an ecological niche. The 2010 predicted ecological niche was placed as the bottom layer and subsequent additional expansions for the years 2020 to 2080 were stacked on top, the 2080 being the topmost layer. (E) and (F) proportion of total projected human population in the continental United States and Canada living within the projected ecological niche of Aedes mosquitoes [Ae. albopictus (E), Ae. aegypti (F)] from 2010–2100 under the moderate and high RCPs.

References

    1. Allouche O, Tsoar A, Kadmon R. 2006. Assessing the accuracy of species distribution models: prevalence, kappa and the true skill statistic (TSS). J Appl Ecol 43(6):1223–1232, 10.1111/j.1365-2664.2006.01214.x. - DOI
    1. Angel S, Parent J, Civco DL, Blei A, Potere D. 2011. The dimensions of global urban expansion: estimates and projections for all countries, 2000–2050. Prog Plann 75(2):53–107, 10.1016/j.progress.2011.04.001. - DOI
    1. Awuor L, Meldrum R, Liberda EN. 2019. Prospects of leveraging an existing mosquito-borne disease surveillance system to monitor other emerging mosquito-borne diseases: a systematic review of West Nile Virus surveillance in Canada (2000–2016). Environ Health Rev 62(3):82–91, 10.5864/d2019-020. - DOI
    1. Bargielowski IE, Lounibos LP, Carrasquilla MC. 2013. Evolution of resistance to satyrization through reproductive character displacement in populations of invasive dengue vectors. Proc Natl Acad Sci USA 110(8):2888–2892, PMID: 23359710, 10.1073/pnas.1219599110. - DOI - PMC - PubMed
    1. Berman M, Diggle P. 1989. Estimating weighted integrals of the second‐order intensity of a spatial point process. J R Stat Series B Stat Methodol 51(1):81–92, 10.1111/j.2517-6161.1989.tb01750.x. - DOI

Publication types

Grants and funding

LinkOut - more resources