. 2020 Jun 8;53(5):545-560.e7.
doi: 10.1016/j.devcel.2020.04.018. Epub 2020 May 21.

Developmentally Programmed Tankyrase Activity Upregulates β-Catenin and Licenses Progression of Embryonic Genome Activation

Affiliations

Developmentally Programmed Tankyrase Activity Upregulates β-Catenin and Licenses Progression of Embryonic Genome Activation

Andrés Gambini et al. Dev Cell. .

Abstract

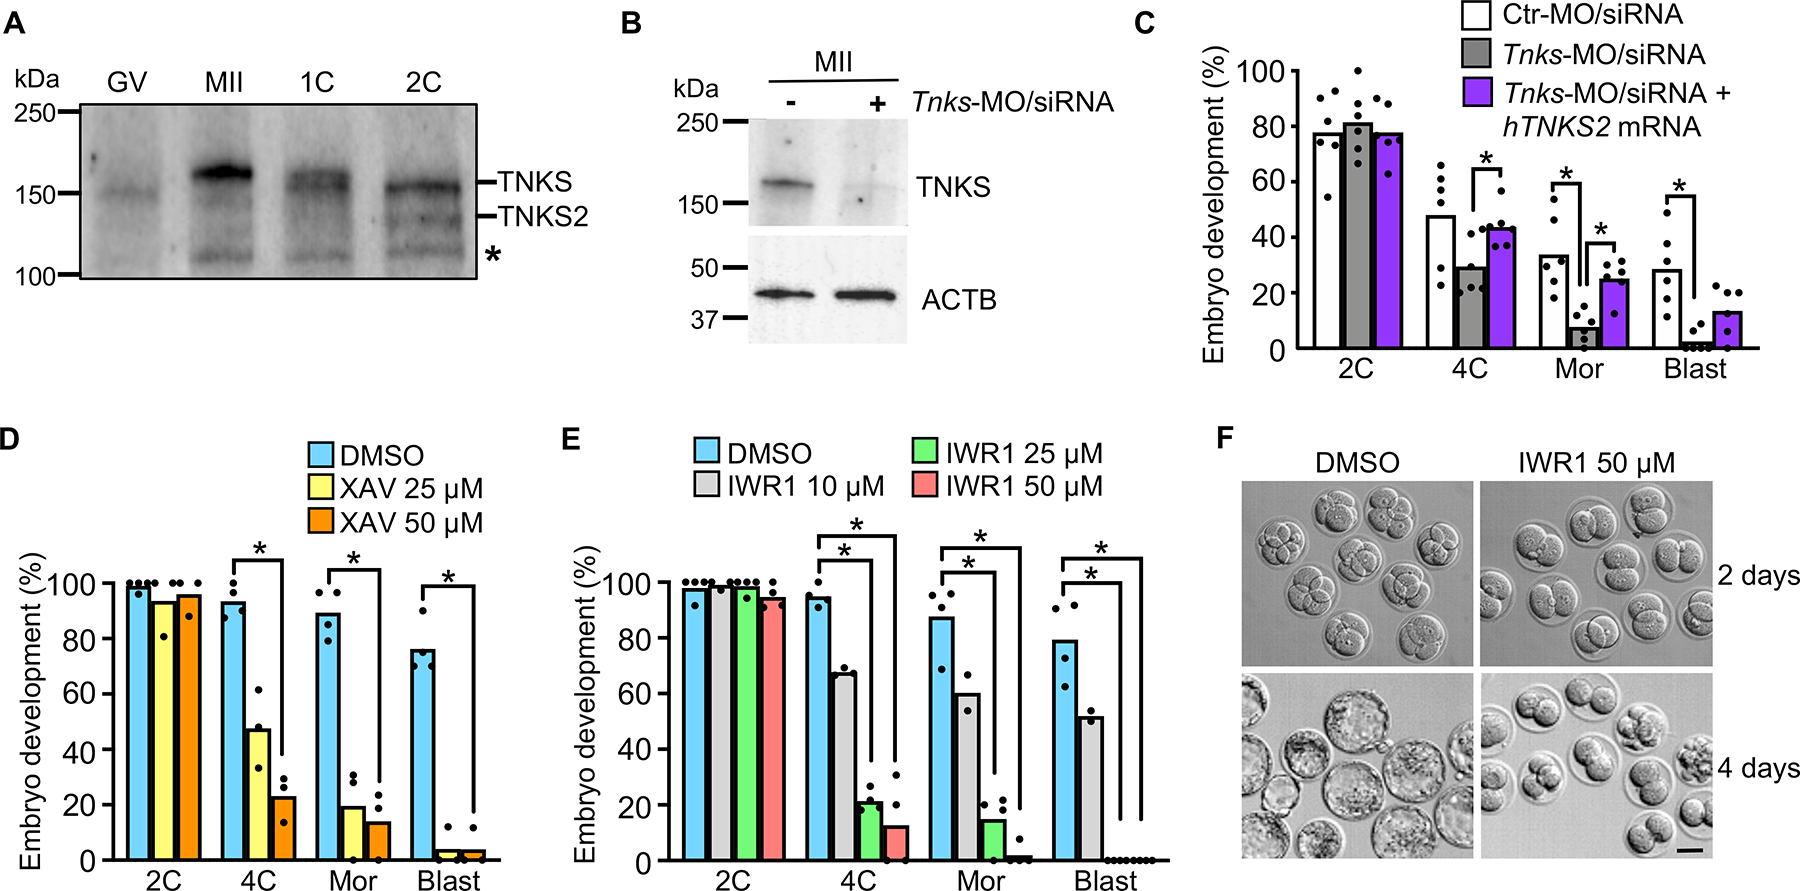
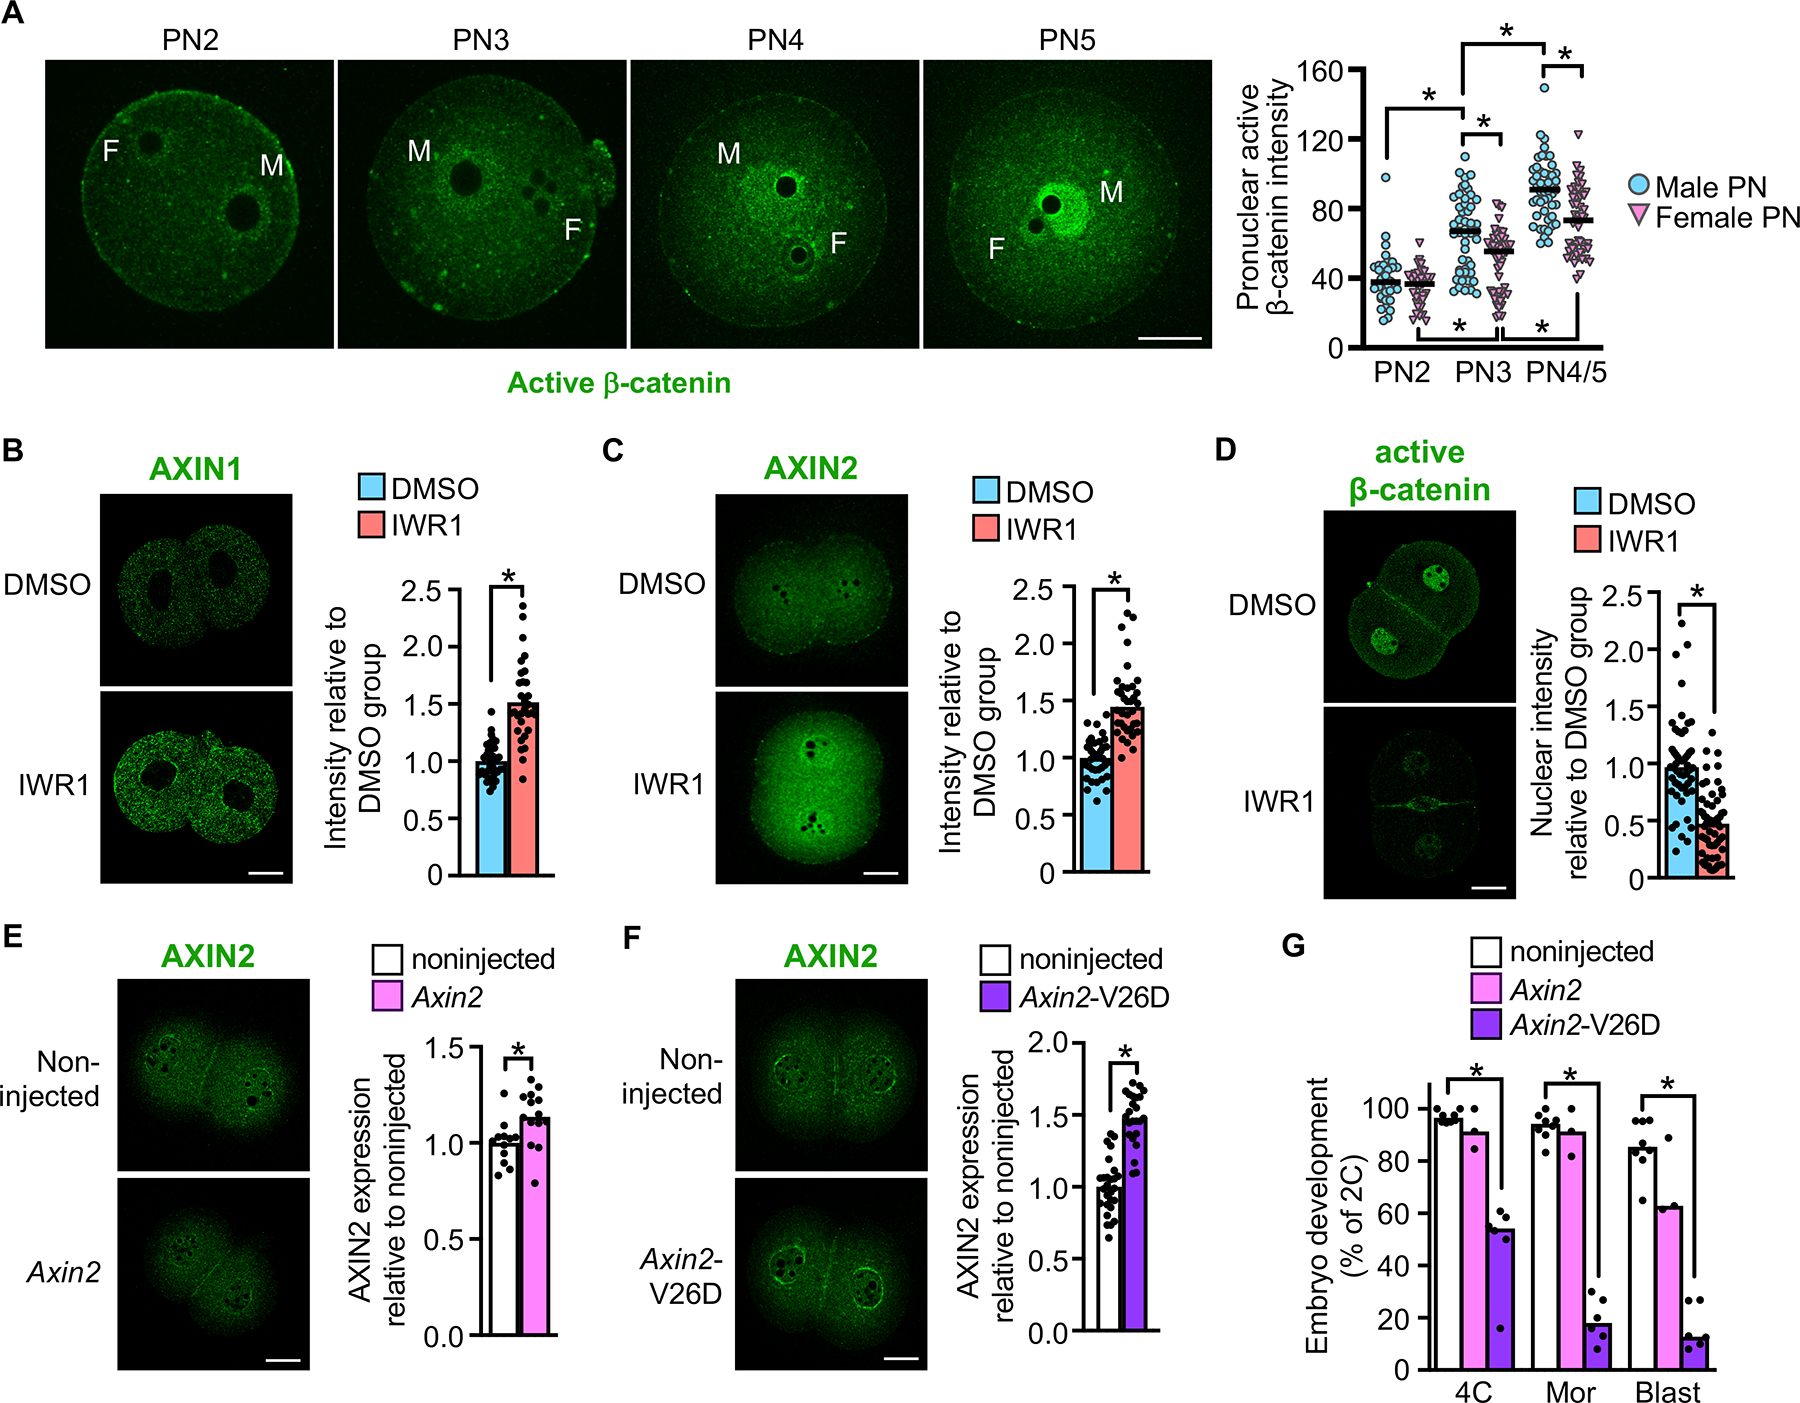
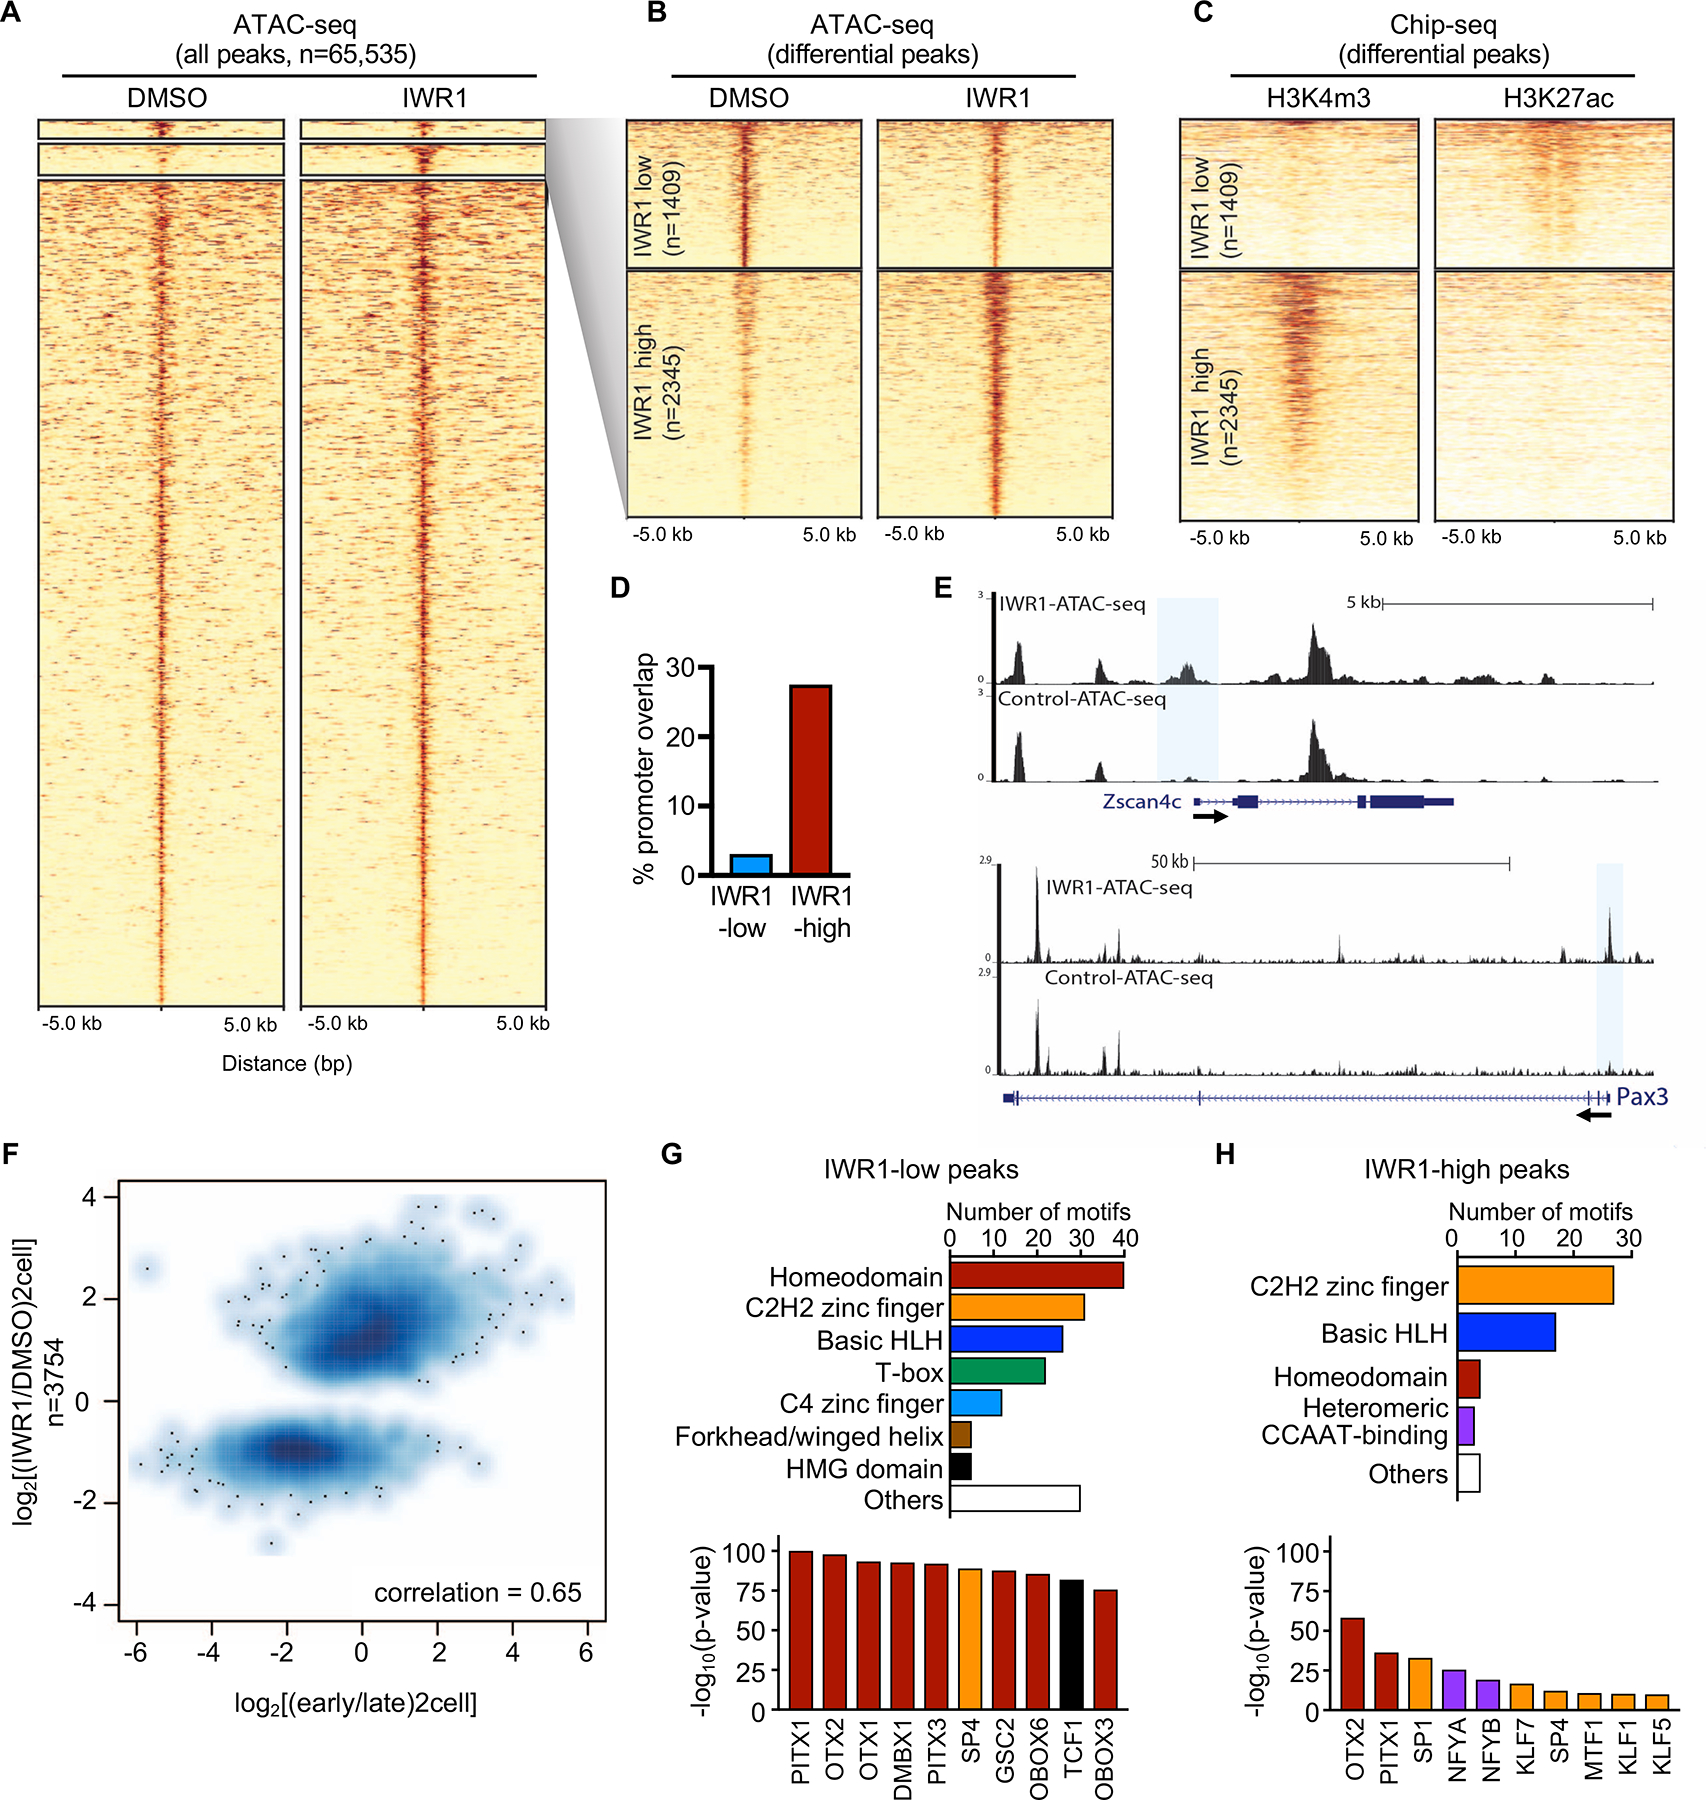
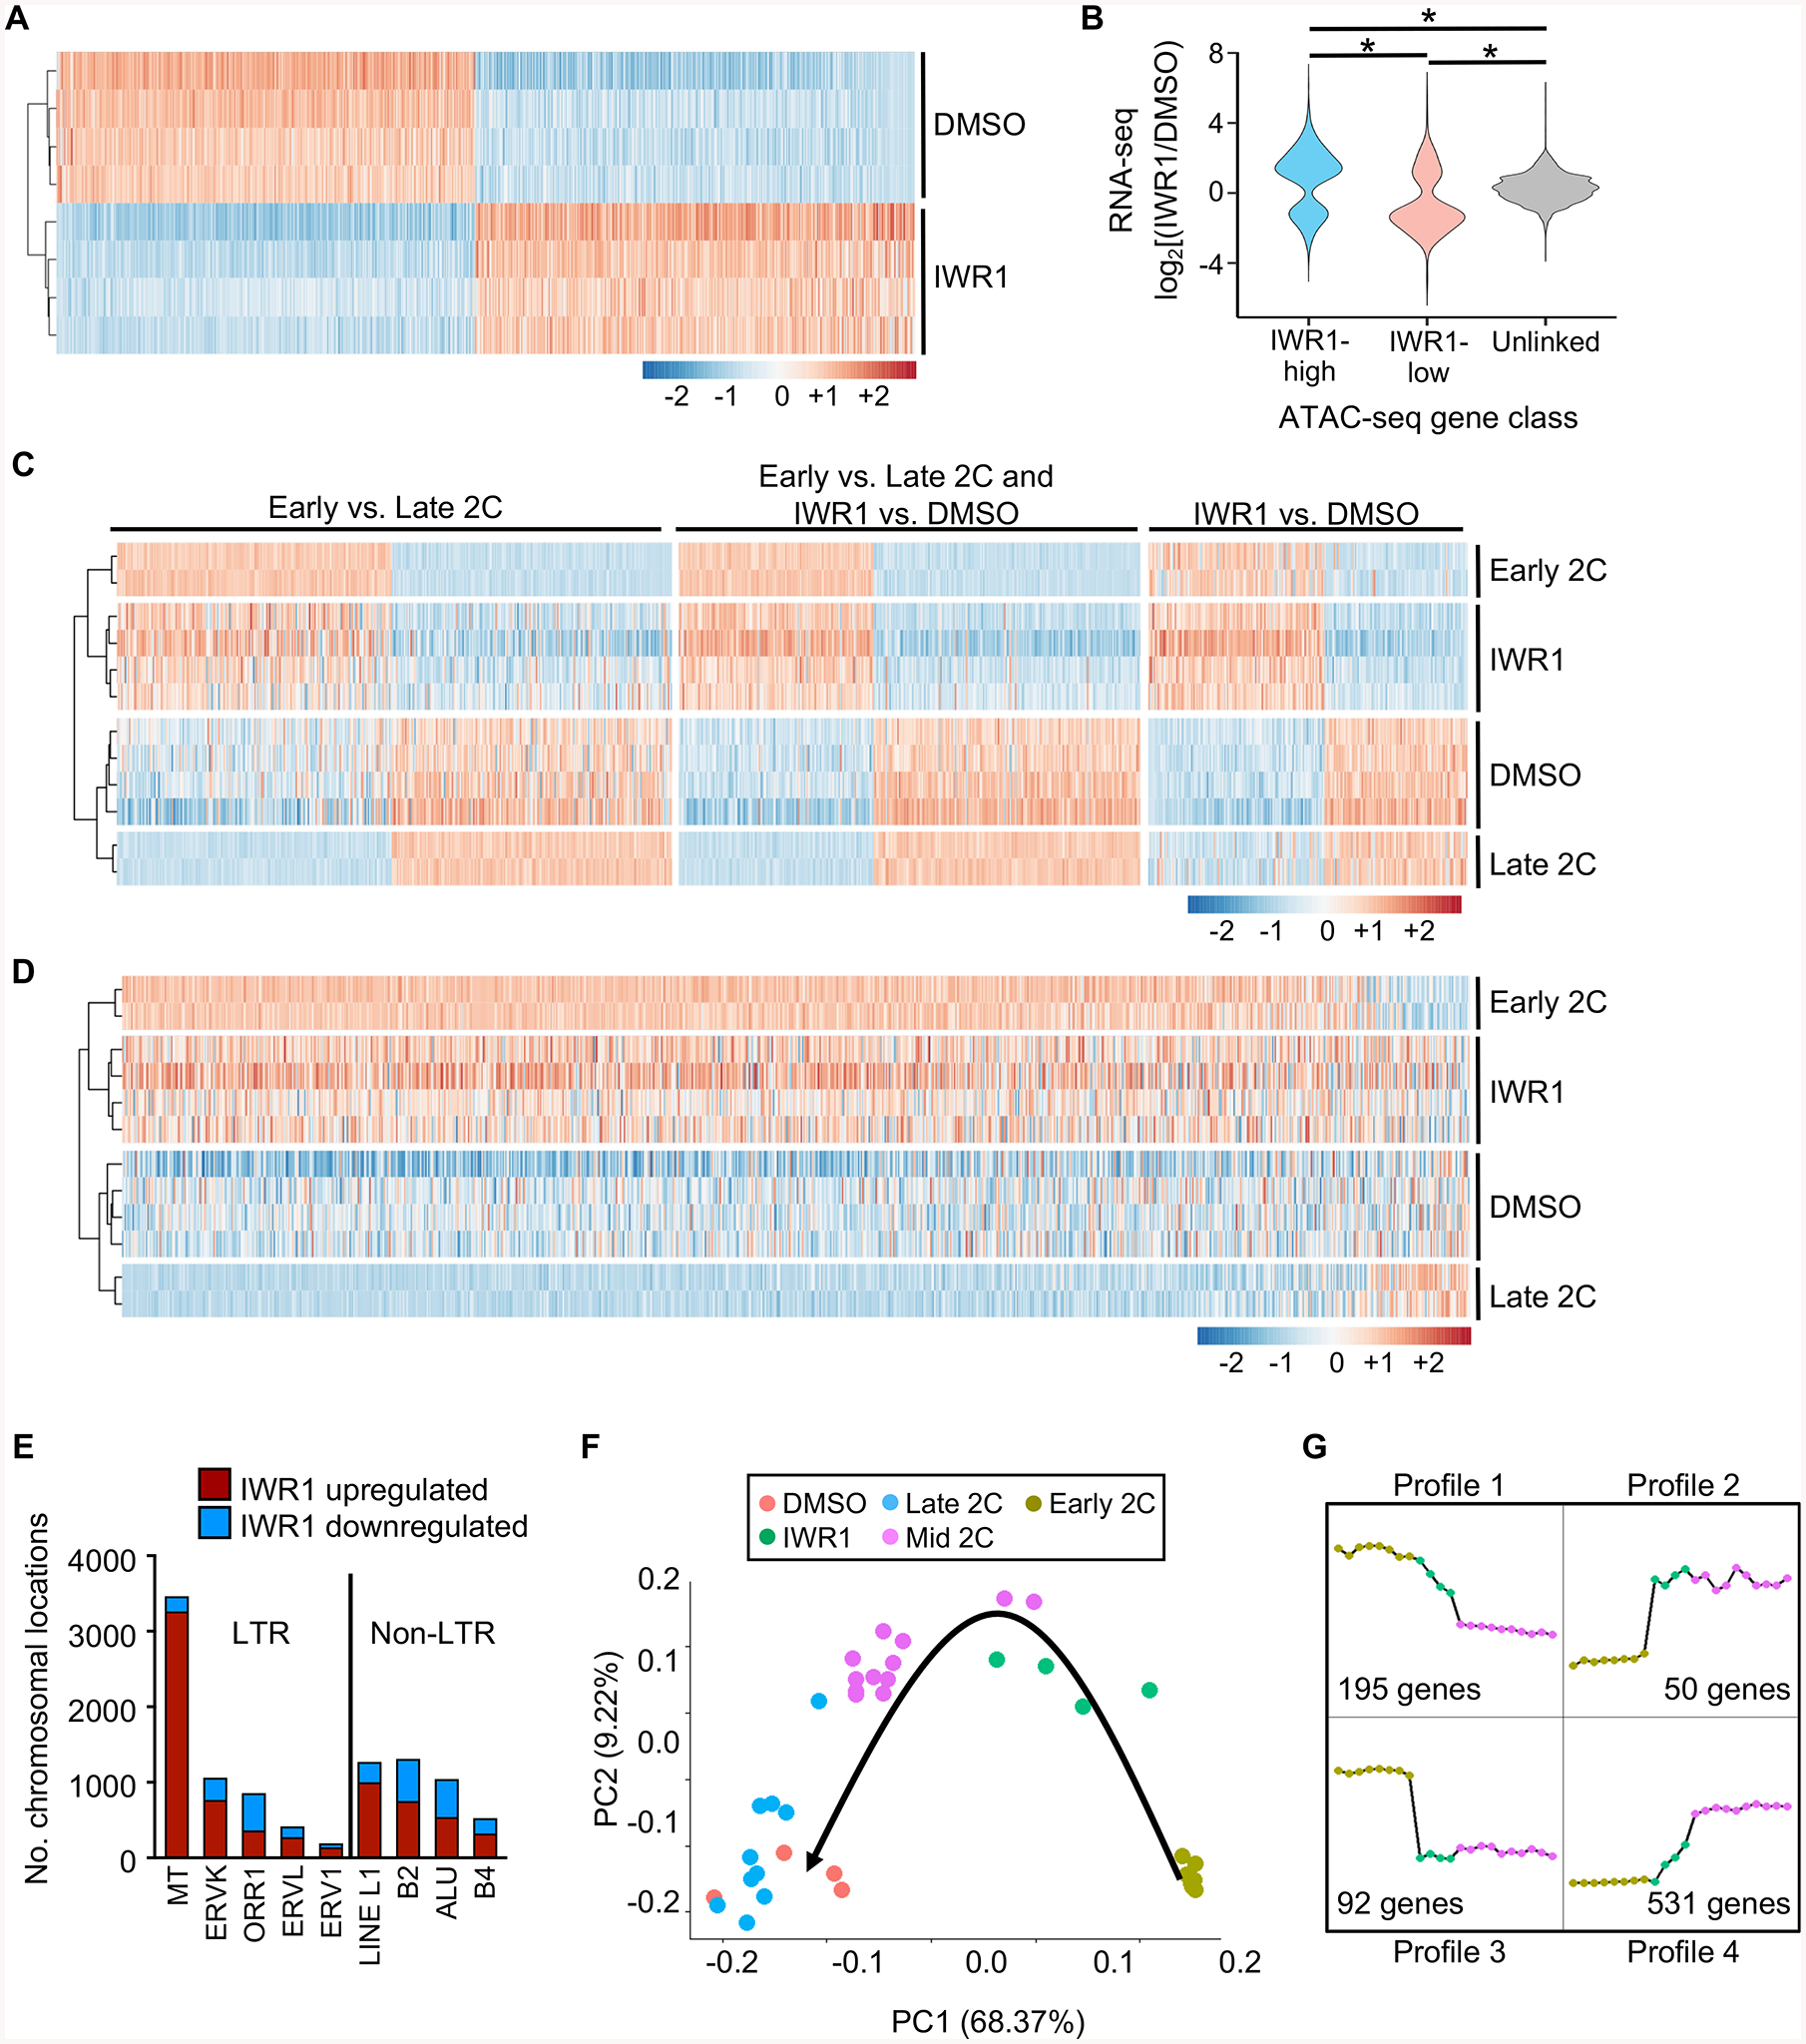
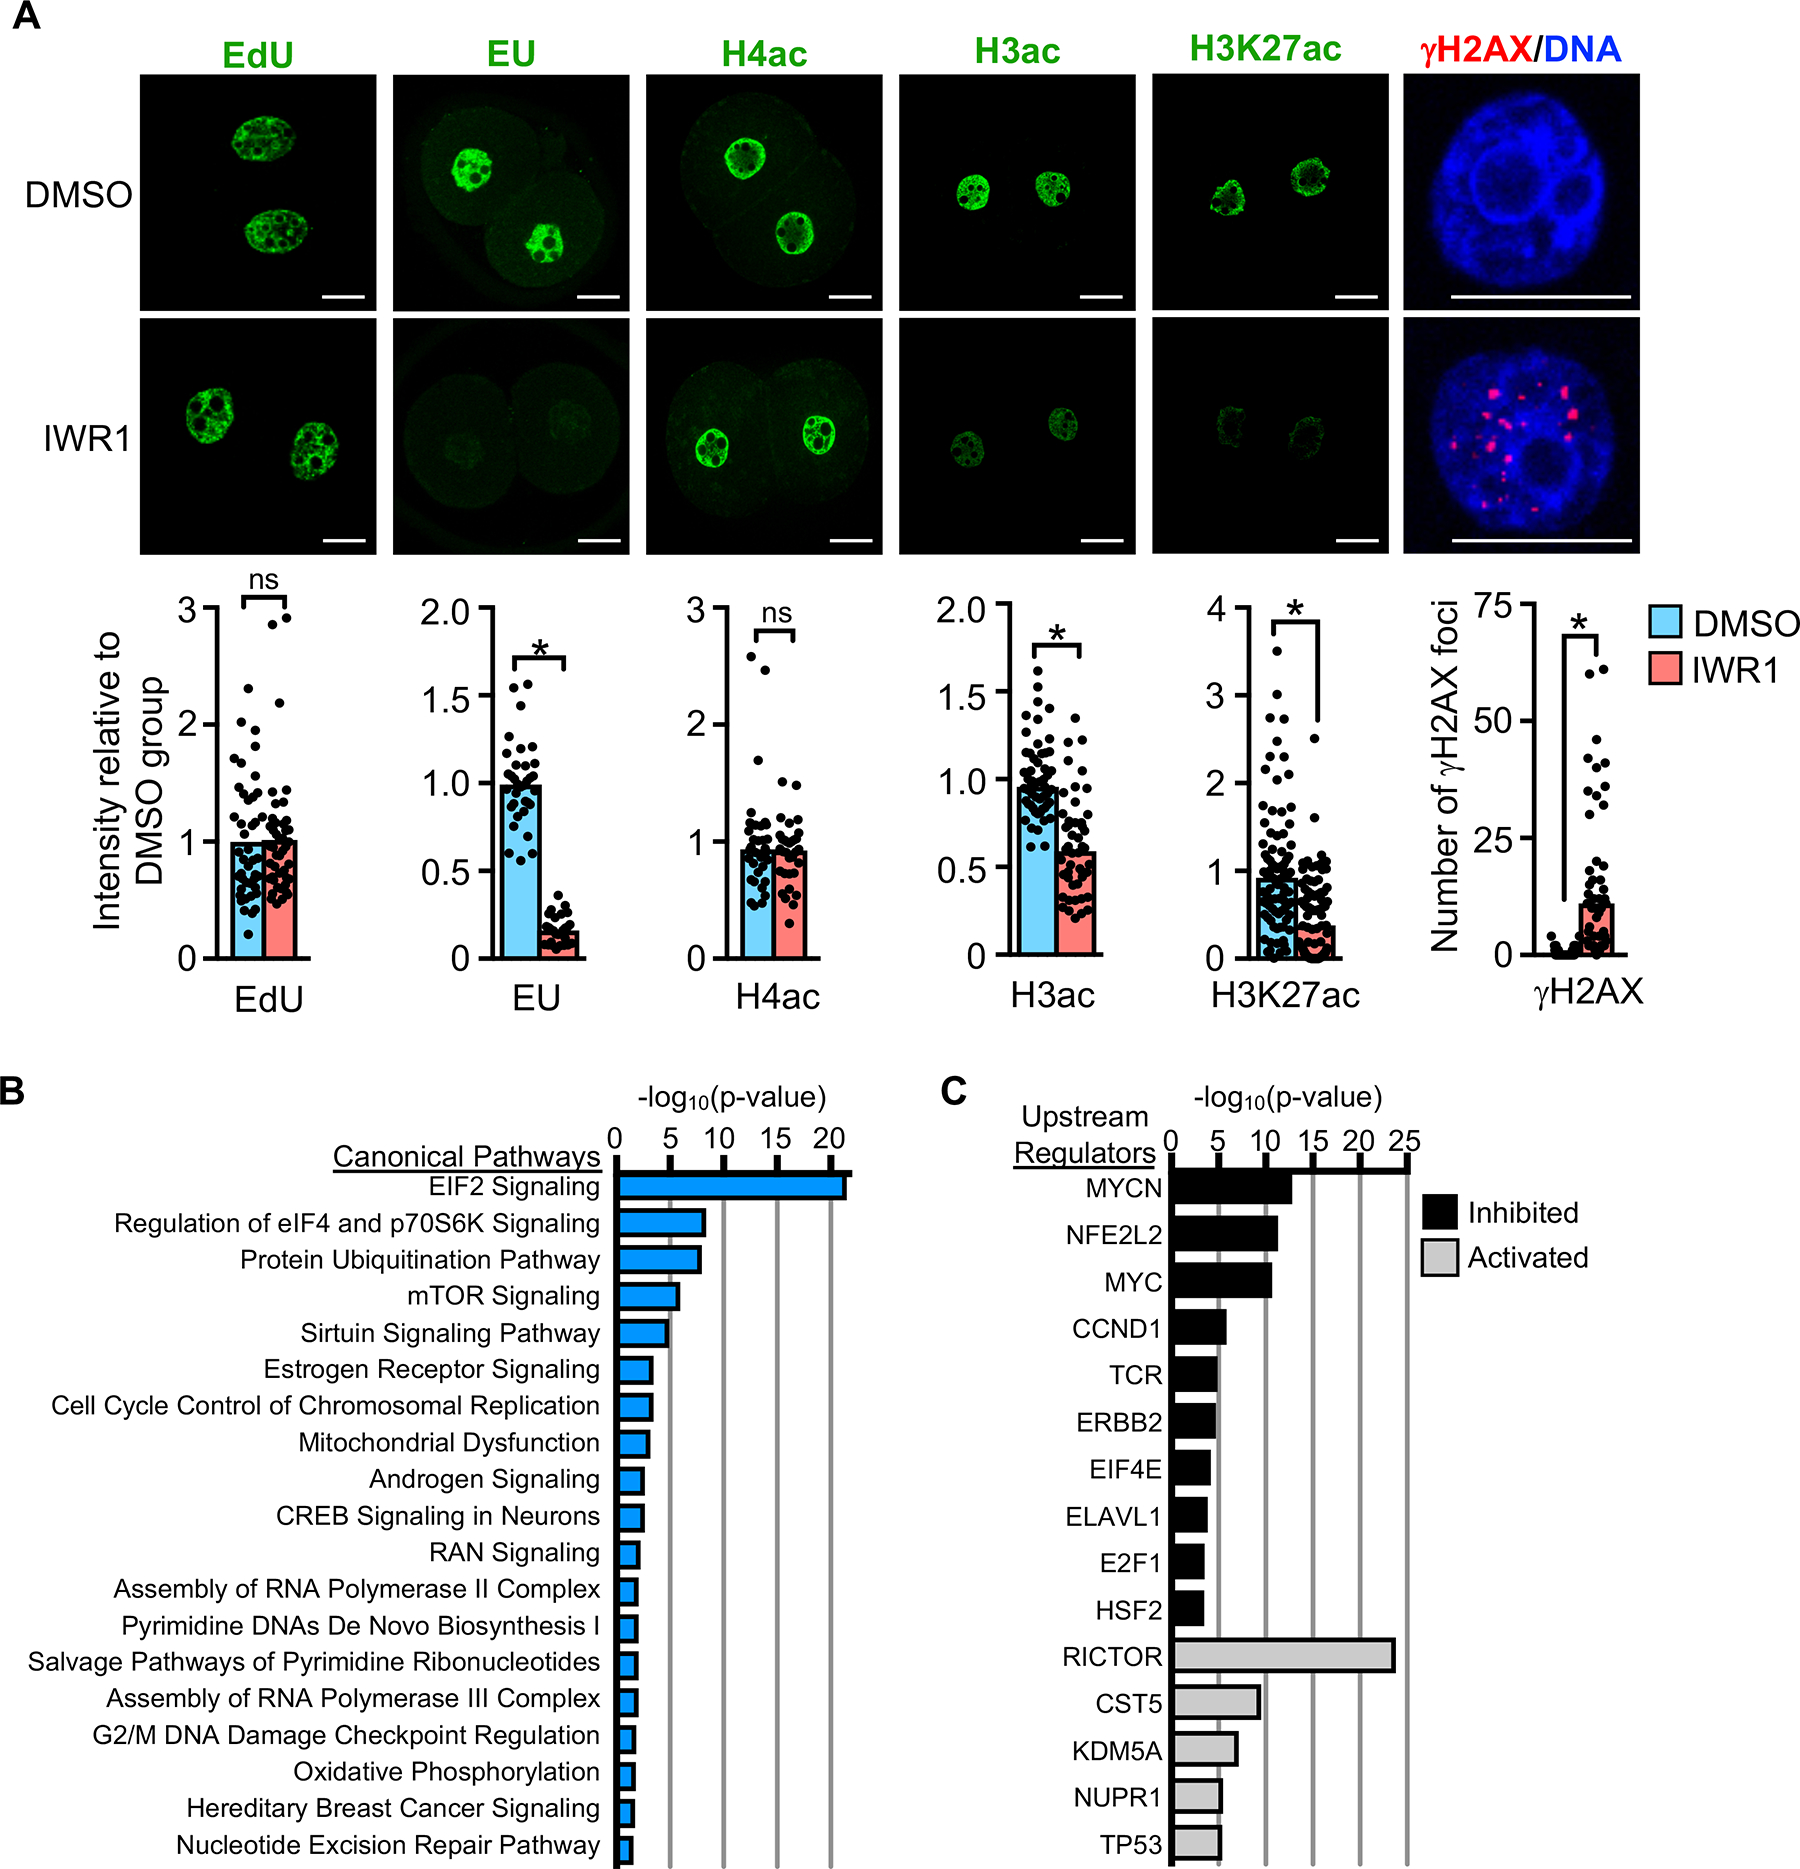
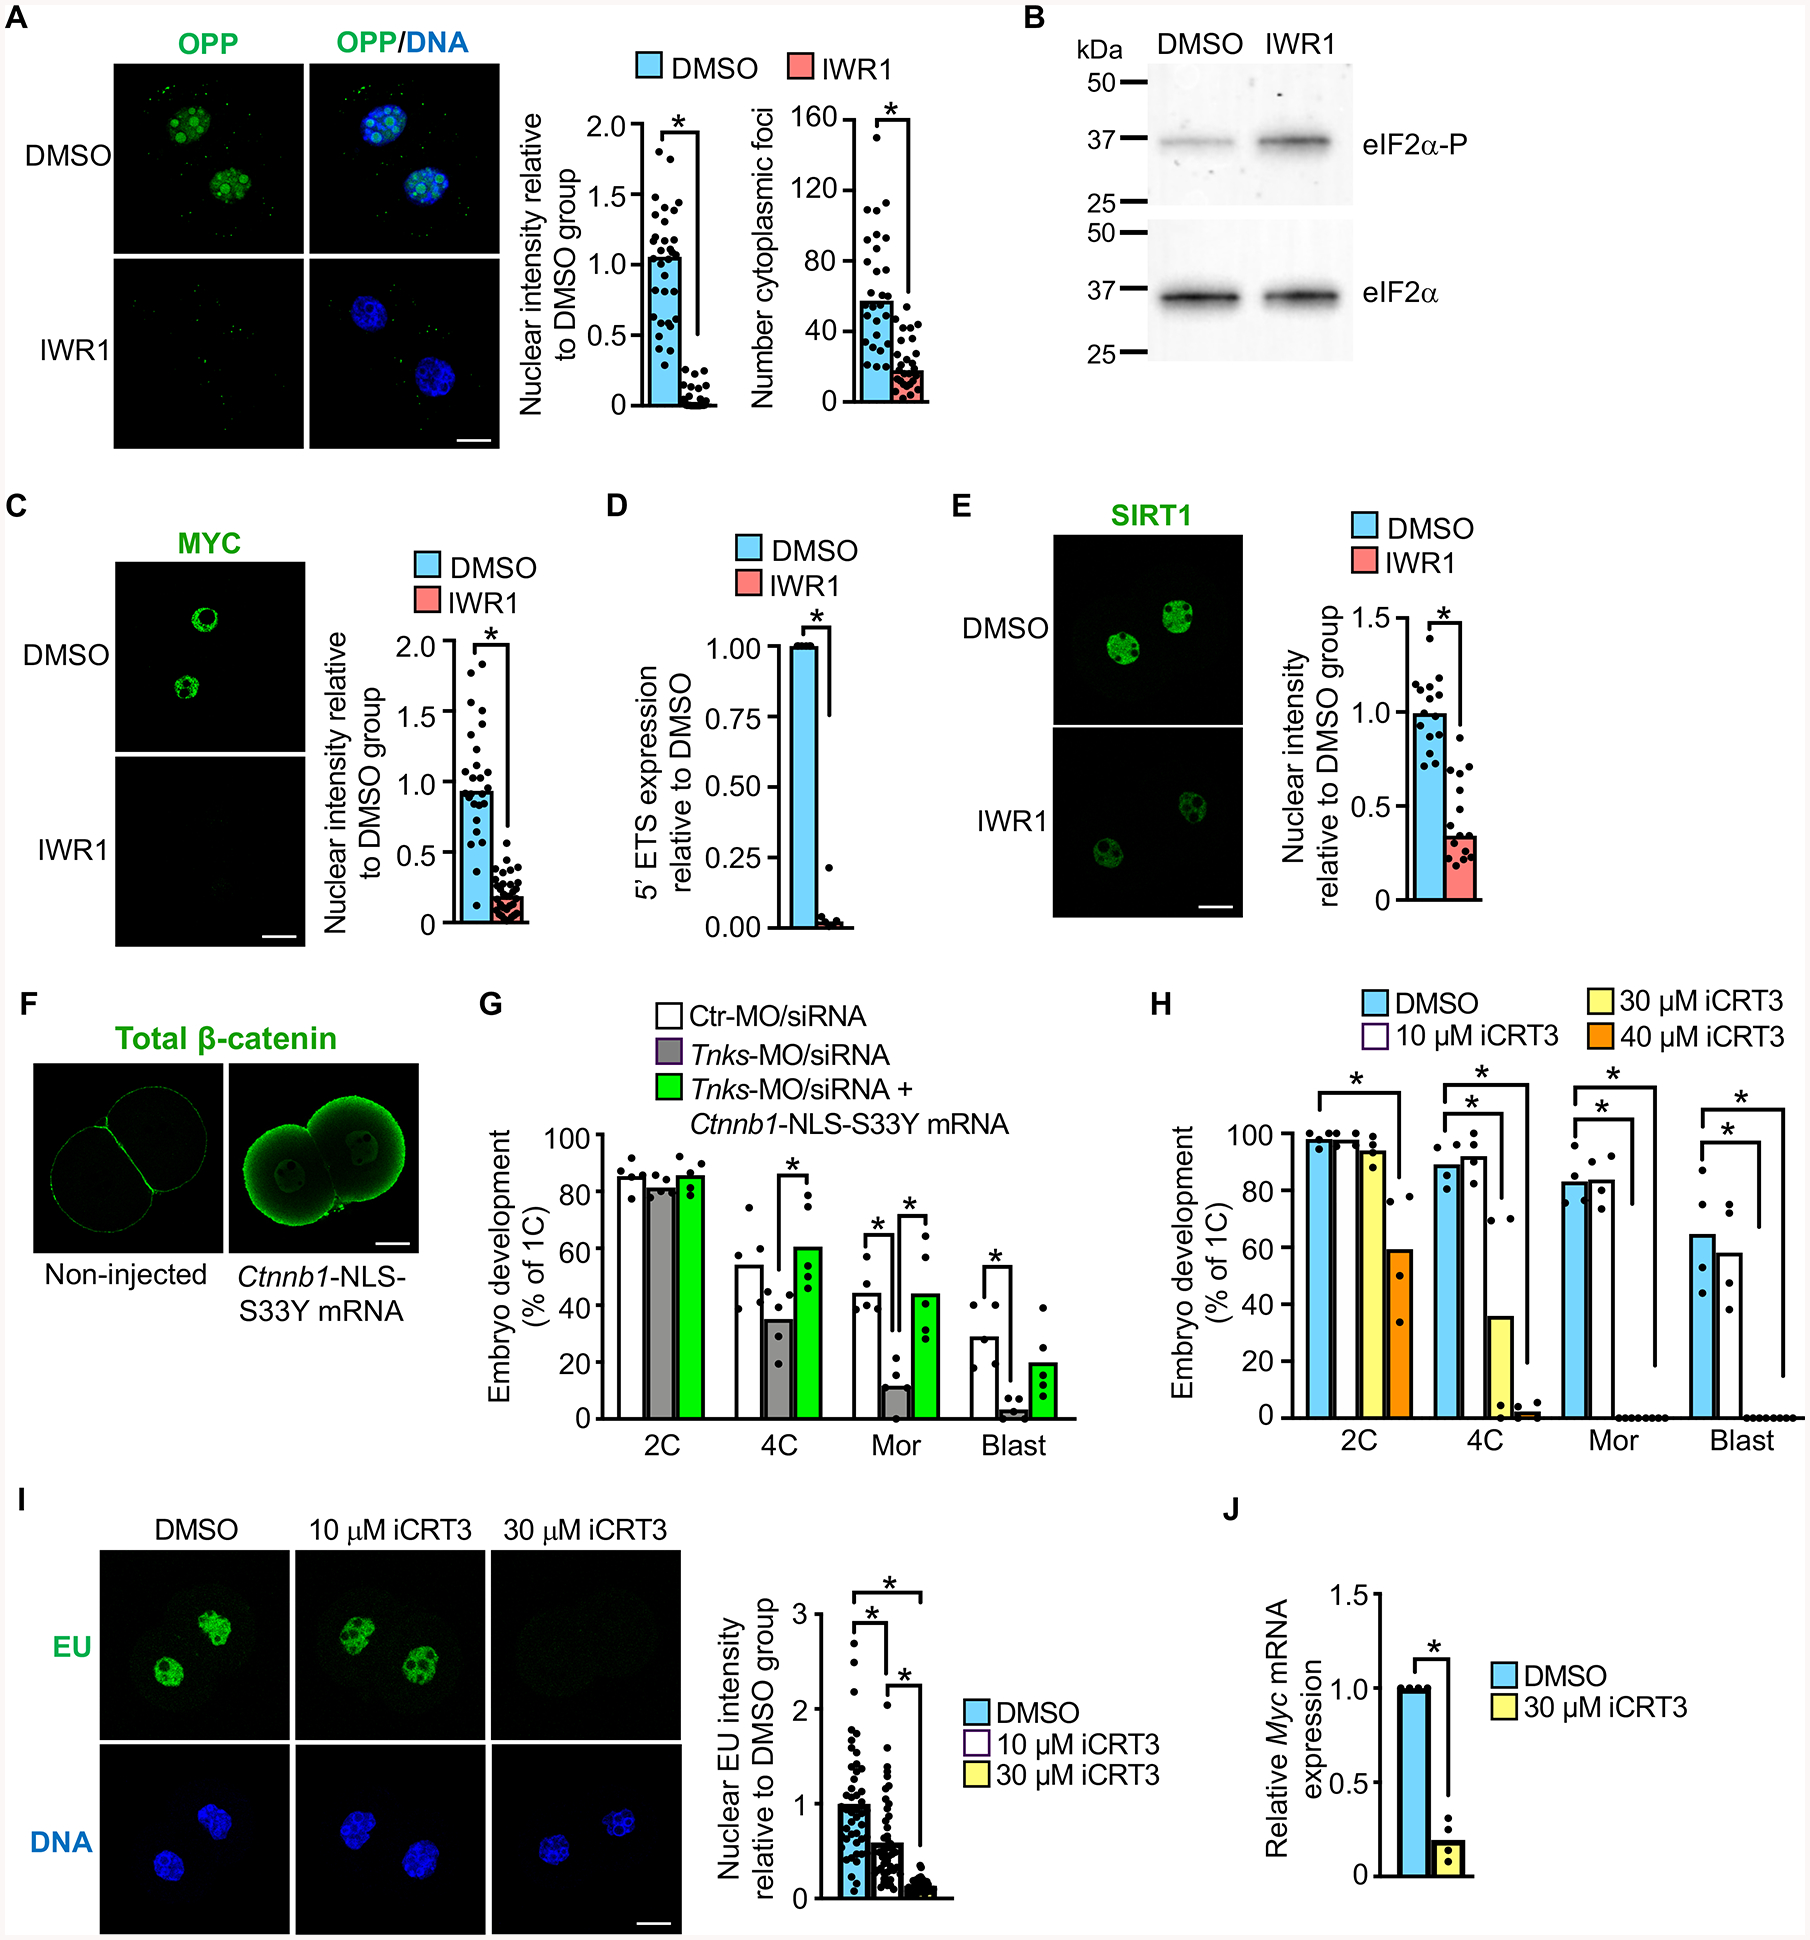
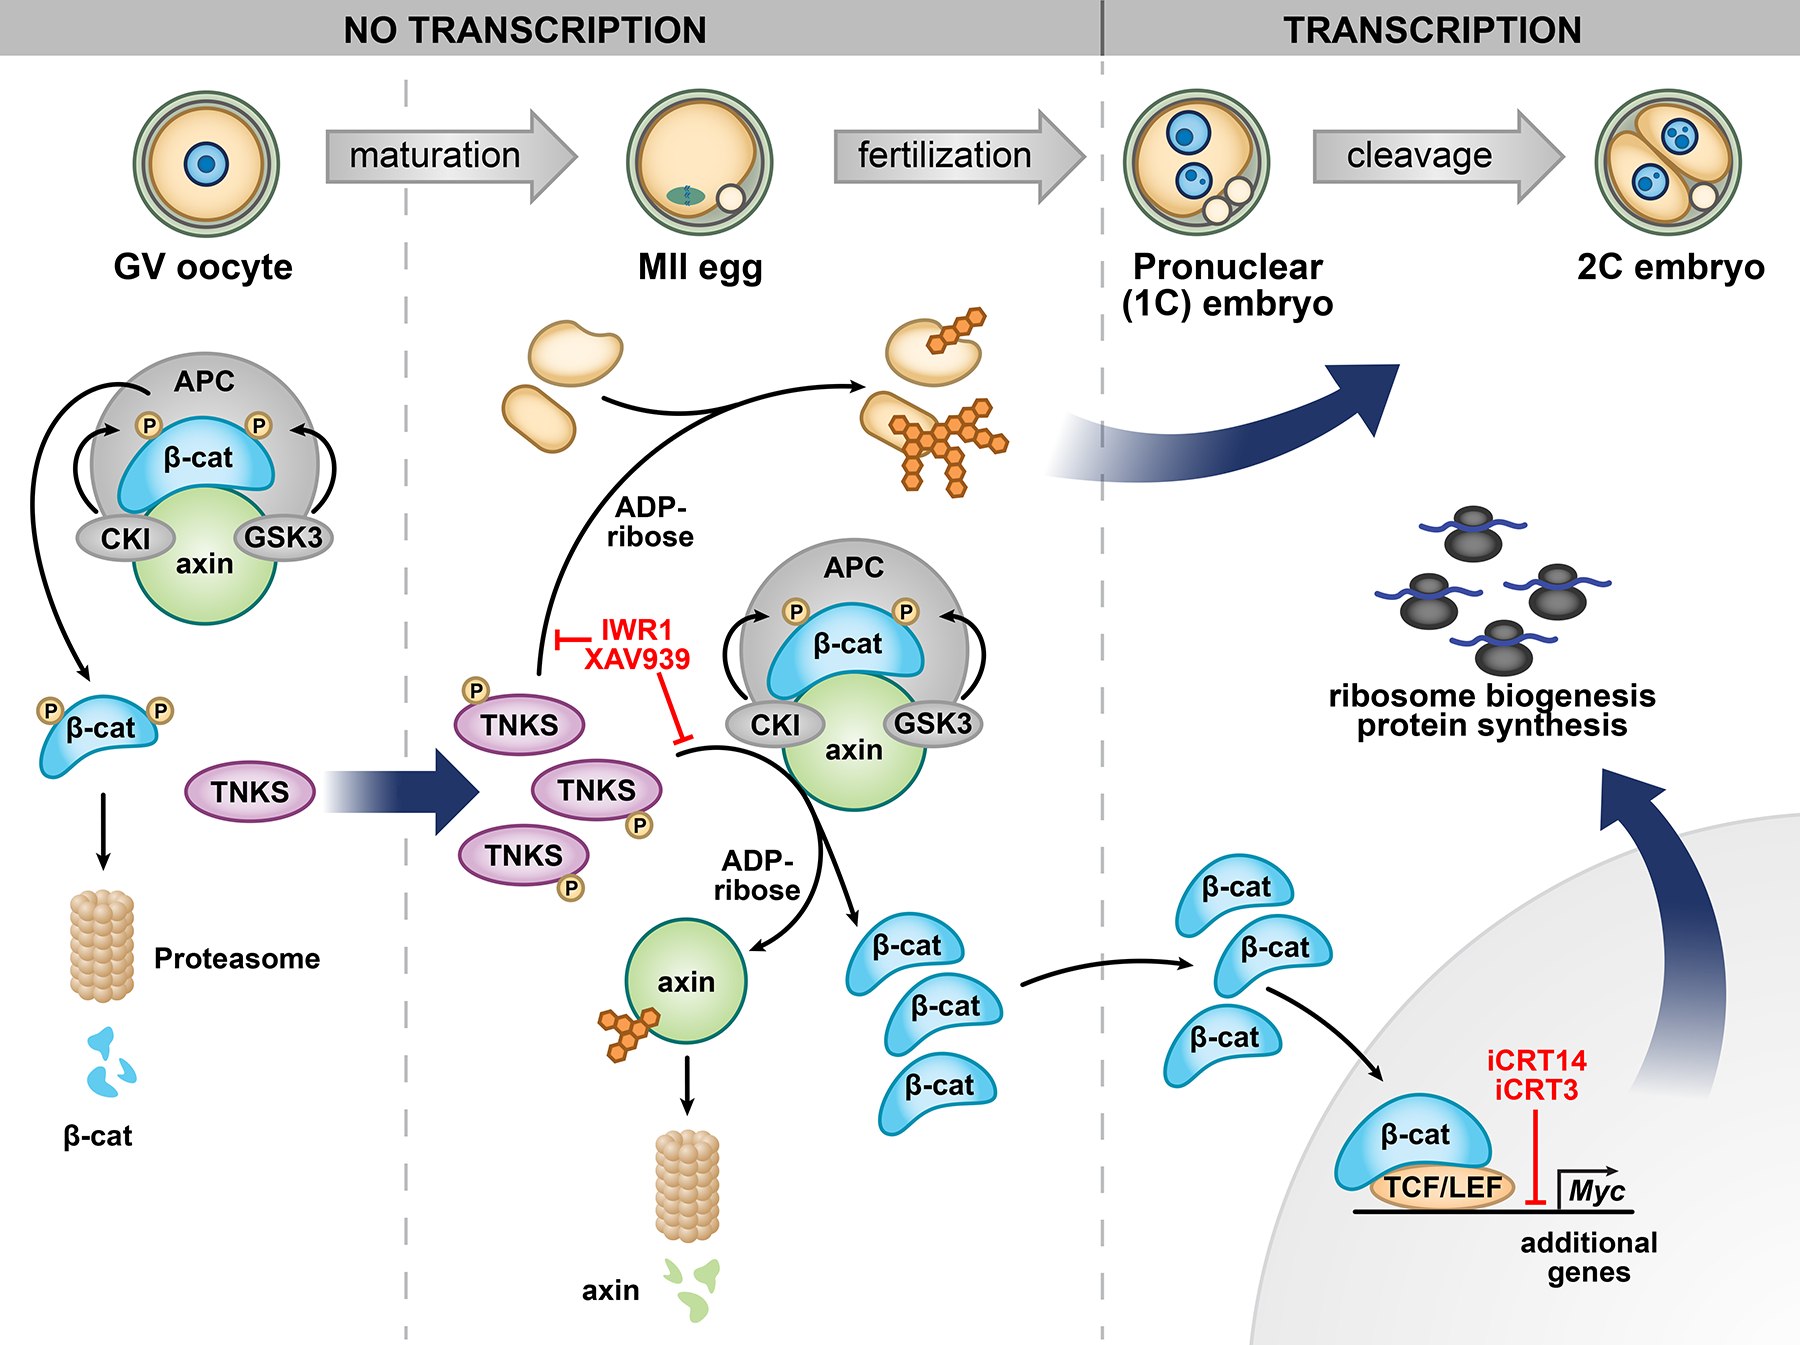
Embryonic genome activation (EGA) is orchestrated by an intrinsic developmental program initiated during oocyte maturation with translation of stored maternal mRNAs. Here, we show that tankyrase, a poly(ADP-ribosyl) polymerase that regulates β-catenin levels, undergoes programmed translation during oocyte maturation and serves an essential role in mouse EGA. Newly translated TNKS triggers proteasomal degradation of axin, reducing targeted destruction of β-catenin and promoting β-catenin-mediated transcription of target genes, including Myc. MYC mediates ribosomal RNA transcription in 2-cell embryos, supporting global protein synthesis. Suppression of tankyrase activity using knockdown or chemical inhibition causes loss of nuclear β-catenin and global reductions in transcription and histone H3 acetylation. Chromatin and transcriptional profiling indicate that development arrests prior to the mid-2-cell stage, mediated in part by reductions in β-catenin and MYC. These findings indicate that post-transcriptional regulation of tankyrase serves as a ligand-independent developmental mechanism for post-translational β-catenin activation and is required to complete EGA.

Keywords: ATAC-seq; WNT signaling pathway; axin; embryonic genome activation; mouse; post-transcriptional regulation; preimplantation embryo; tankyrase; β-catenin.


Conflict of interest statement

Declaration of Interests The authors declare no competing interests.

Figures

Figure 1.
Figure 1.. Tankyrase activity is essential for preimplantation embryo development.
(A) Immunoblot of TNKS and TNKS2. N=3; 50 oocytes/eggs/embryos per lane. Asterisk indicates non-specific band. (B) Immunoblot analysis of TNKS in eggs following microinjection at the GV stage using the indicated combination of morpholino (MO) and siRNA (upper panel). β-actin, loading control (lower panel). N=2; 58 eggs/lane in representative blot shown. (C) Percentage of fertilized embryos to reach specified stages following microinjection at the GV stage with the indicated morpholino/siRNA/mRNA combination. N=6, 21–67 1C embryos/group/replicate; *p<0.05, ANOVA with Dunnett’s. (D) Percentage of 1C embryos to reach specified stages following culture with XAV939. N=4; 16–38 1C embryos/group/replicate; *p<0.05, Kruskal-Wallis with Dunn’s. (E) Percentage of 1C embryos to reach specified stages following culture with IWR1. N=3; 16–33 1C embryos/group/replicate; *p<0.05, Kruskal-Wallis with Dunn’s. (F) Embryos at 2 days and 4 days following culture from 1C stage in DMSO or IWR1. Scale bar=40 μm. Median or mean, as appropriate, and all values shown in graphs. Abbreviations in this and all subsequent figures: GV, GV-intact oocyte; MII, MII-arrested egg; 1C, one-cell embryo; 2C, two-cell embryo; 4C, four-cell embryo; 8C, eight-cell embryo; Mor, morula; Blast, blastocyst. See also Figures S1 and S2.
Figure 2.
Figure 2.. WNT signaling components mediate tankyrase inhibition effects.
(A) Active β-catenin staining across pronuclear (PN) stages and quantification. F, female PN; M, male PN. N=3; 9–24 embryos/group/replicate; *p<0.05, Kruskal-Wallis test with Dunn’s. (B) AXIN1 in late 2C embryos and quantification. N=3; 32–33 embryos/group; *p<0.05, t-test. (C) AXIN2 in late 2C embryos and quantification. N=3; 36–38 embryos/group; *p<0.05, Mann Whitney test. (D) Active β-catenin in late 2C embryos and quantification. N=4; 52–59 embryos/group; *p<0.05, Mann Whitney test. (E) AXIN2 in late 2C embryos following Axin2 mRNA microinjection at 1C-stage and quantification. N=3; 12–14 embryos/group. p<0.05, t-test. (F) AXIN2 in late 2C embryos following Axin2-V26D mRNA microinjection at the 1C-stage and quantification. N=3; 24–27 embryos/group. p<0.05, t-test. (G) Percentage of embryos to reach the various preimplantation embryo stages following microinjection at the 1C-stage with the indicated mRNA. N=4; 30–54 1C embryos/group/replicate; *p<0.05, ANOVA with Dunnett’s. Scale bars=20 μm. Median or mean, as appropriate, and all values shown in graphs.
Figure 3.
Figure 3.. Tankyrase activity is necessary to generate the appropriate chromatin status for EGA.
(A) Heatmap of ATAC-seq of 2C stage embryos treated with IWR1 or DMSO beginning at the 1C stage (22–23 hrs post-hCG) and cultured until the late 2C stage (48 hrs post-hCG). High confidence peaks (n=65,535) filtered for differential ATAC-seq signal. (B) Heatmap of differential ATAC-seq peaks (expanded from A) showing IWR1-low and IWR1-high peaks at FDR<0.05 using DESeq2. (C) Heatmap of ChIP-seq data from (Dahl et al., 2016) using late 2C-stage mouse embryos. Left, H3K4me3 ChIP-seq; Right: H3K27ac ChIP-seq. (D) Percentage of differential ATAC-seq peaks that overlap with promoter regions. (E) Genome browser snapshots showing ATAC-seq peaks in IWR1 or DMSO treated 2C embryos for EGA genes Zscan4c and Pax3. Differential open promoters highlighted by blue boxes. (F) Scatterplot of ATAC-seq IWR1 vs. DMSO differential peaks compared to early vs. late 2C ATAC-seq from (Wu et al., 2016). Strong positive correlation = 0.65. (G,H) Motif analysis of IWR1-low (G) and IWR1-high (H) peak regions. Upper panels: Total number of significantly enriched motifs in the indicated transcription factor family. Lower panels: Most significantly enriched motifs. Bars color-coded to match motif families in upper panels. See also Figure S3.
Figure 4.
Figure 4.. Tankyrase activity is required for EGA to progress to the mid-2C stage.
(A) Differentially expressed (DE) genes sorted by log2fc between DMSO and IWR1, clustered by Euclidean distance. 5697 DE genes; p_adj<0.01 and |log2fc|>1. Z-scores plotted. (B) Violin plot showing correlation between ATAC-seq gene class and RNA-seq gene expression levels. Expression ratio (IWR1/DMSO) of genes within 100 kb of a differential ATAC-seq peak (DESeq2 FDR<0.05) compared to each other and to unlinked genes. *p≤2.2E-16, one-sided Wilcoxon-Mann-Whitney test. (C) Comparison of gene expression differences between earlyand late 2C embryos and IWR1 and DMSO treated embryos. Left set DE (p_adj<0.01, |log2fc|>1) only between early and late 2C embryos. Middle set DE in both early/late and IWR1/DMSO comparisons. Right set DE only between IWR1/DMSO. Early/late 2C data sets from (Wu et al., 2016). Clustered by Euclidean distance prior to conversion to z-scores. Plotted values are z-scores that were computed separately for the two experiments – IWR1/DMSO and early/late 2C. (D) Heatmap of gene expression differences between the early and late 2C embryos and IWR1 and DMSO treated embryos of transcripts degraded ≥8-fold between oocyte and 2C stages (Xue et al., 2013). Genes ordered by log2fc in comparison between early and late 2C data sets. Clustered by Euclidean distance prior to z-score conversion. Plotted values are z-scores, which were computed separately for the two experiments – IWR1/DMSO and early/late. (E) Number of chromosomal regions up- or downregulated for each repetitive element. (F) Principal component analysis of single cell RNA-seq data from mouse embryos in the early, mid, and late 2C stages (Deng et al., 2014) and DMSO/IWR1-treated 2C embryos. Black arrow, progression of time in development. (G) Gene expression profiles generated from RNA-seq datasets from early and mid 2C embryos (Deng et al., 2014), and IWR1-treated 2C embryos. Profiles derived from all genes common to all 3 datasets. Number of genes represents the number present in the set of genes differentially expressed between early and mid 2C embryos that displayed the indicated profile. Graph legend shown in (F).
Figure 5.
Figure 5.. Tankyrase activity is necessary for embryonic transcription, chromatin modifications and DNA repair.
(A) Nuclear staining in 2C embryos following culture in DMSO or IWR1. EdU, indicator of DNA replication levels; N=3, 23–24 embryos/group. EU, indicator of global transcription activity; N=3, 28–34 embryos/group; *p<0.05, t-test. H4ac, histone H4 acetylation; N=2, 18–20 embryos/group. H3ac, histone H3 acetylation; N=3, 24–27 embryos/group; *p<0.05, t-test. H3K27ac, histone H3 lysine 27 acetylation; N=4, 30–35 embryos/group; *p<0.05, t-test. γH2AX, histone H2AX phosphorylation as measure of DNA double-strand breaks. DNA counterstained with DAPI, merged image shown. N=3, 20–25 embryos/group; *p<0.05, t-test. Graphs show mean and all values. Scale bars=20 μm. (B,C) Ingenuity® Pathway Analysis. (B) Highly significant canonical pathways of differentially expressed genes in DMSO vs. IWR1 embryos. (C) Highly significant upstream regulators of differentially expressed genes in DMSO vs. IWR1 embryos. See also Figure S4.
Figure 6.
Figure 6.. Tankyrase and β-catenin support generation of MYC and global protein translation necessary for embryo development.
(A) OPP staining as indicator of newly translated protein in DMSO or IWR1-treated late 2C embryos. Graphs show nuclear intensity and total number of cytoplasmic foci/group. *p<0.05, t-test; N=3, 28–32 embryos/group. (B) Immunoblot of eIF2α and eIF2α-P in DMSO or IWR1-treated late 2C embryos; 100 embryos/lane. Blot representative of N=3 replicates. (C) MYC immunofluorescence and relative intensity in DMSO or IWR1-treated late 2C embryos. *p<0.05, t-test; N=3, 26–33 embryos/group. (D) Relative expression of 5′ external transcribed spacer (5′ ETS) in DMSO or IWR1-treated late 2C embryos. *p<0.05, Mann-Whitney test; N=6. (E) SIRT1 immunofluorescence and relative intensity in DMSO or IWR1-treated late 2C embryos. *p<0.05, t-test; N=3, 15 embryos/group. (F) Total β-catenin immunofluorescence in late 2C embryos that were either not injected or microinjected at the 1C-stage with Ctnnb1-NLS-S33Y mRNA. (G) Percentage of 1C embryos to reach specified stages following microinjection at the GV-stage with the indicated MO/siRNA ± mRNA. N=5, 19–47 1C embryos/group/replicate; *p<0.05, ANOVA with Dunnett’s. (H) Percentage of 1C embryos to reach specified stages following culture with DMSO or iCRT3. N=4; 21–44 1C embryos/group/; *p<0.05, Kruskal-Wallis with Dunn’s. (I) EU staining and quantification in 2C embryos cultured in DMSO or iCRT3. Upper panels, EU; lower panels, DNA. N=3, 46–47 embryos/group; *p<0.05, Kruskal-Wallis with Dunn’s. (J) Relative Myc expression in 2C embryos cultured in DMSO or iCRT3. N=4, *p<0.05, Kruskal Wallis with Dunn’s. Median or mean, as appropriate, and all values shown in graphs. See also Figures S5 and S6.
Figure 7.
Figure 7.. Working model of tankyrase-mediated ligand-independent β-catenin activation resulting in MYC production to support embryo development.
See Discussion for full model description. Sites of action of inhibitors are indicated. TNKS, tankyrase 1; APC, adenomatosis polyposis coli; β-cat, β-catenin; CKI, casein kinase I; GSK3, glycogen synthase kinase 3; TCF/LEF, T-cell factor/lymphoid enhancer-binding factor proteins.

References

    1. Abe K, Yamamoto R, Franke V, Cao M, Suzuki Y, Suzuki MG, Vlahovicek K, Svoboda P, Schultz RM, and Aoki F (2015). The first murine zygotic transcription is promiscuous and uncoupled from splicing and 3’ processing. EMBO J 34, 1523–1537. - PMC - PubMed
    1. Abe KI, Funaya S, Tsukioka D, Kawamura M, Suzuki Y, Suzuki MG, Schultz RM, and Aoki F (2018). Minor zygotic gene activation is essential for mouse preimplantation development. Proc Natl Acad Sci U S A 115, E6780–E6788. - PMC - PubMed
    1. Adenot PG, Mercier Y, Renard JP, and Thompson EM (1997). Differential H4 acetylation of paternal and maternal chromatin precedes DNA replication and differential transcriptional activity in pronuclei of 1-cell mouse embryos. Development 124, 4615–4625. - PubMed
    1. Angers S, and Moon RT (2009). Proximal events in Wnt signal transduction. Nat Rev Mol Cell Biol 10, 468–477. - PubMed
    1. Aoki F, Worrad DM, and Schultz RM (1997). Regulation of transcriptional activity during the first and second cell cycles in the preimplantation mouse embryo. Dev Biol 181, 296–307. - PubMed

Publication types

MeSH terms