. 2020 Jun 18;78(6):1237-1251.e7.
doi: 10.1016/j.molcel.2020.04.031. Epub 2020 May 21.

HLTF Promotes Fork Reversal, Limiting Replication Stress Resistance and Preventing Multiple Mechanisms of Unrestrained DNA Synthesis

Affiliations

HLTF Promotes Fork Reversal, Limiting Replication Stress Resistance and Preventing Multiple Mechanisms of Unrestrained DNA Synthesis

Gongshi Bai et al. Mol Cell. .

Abstract

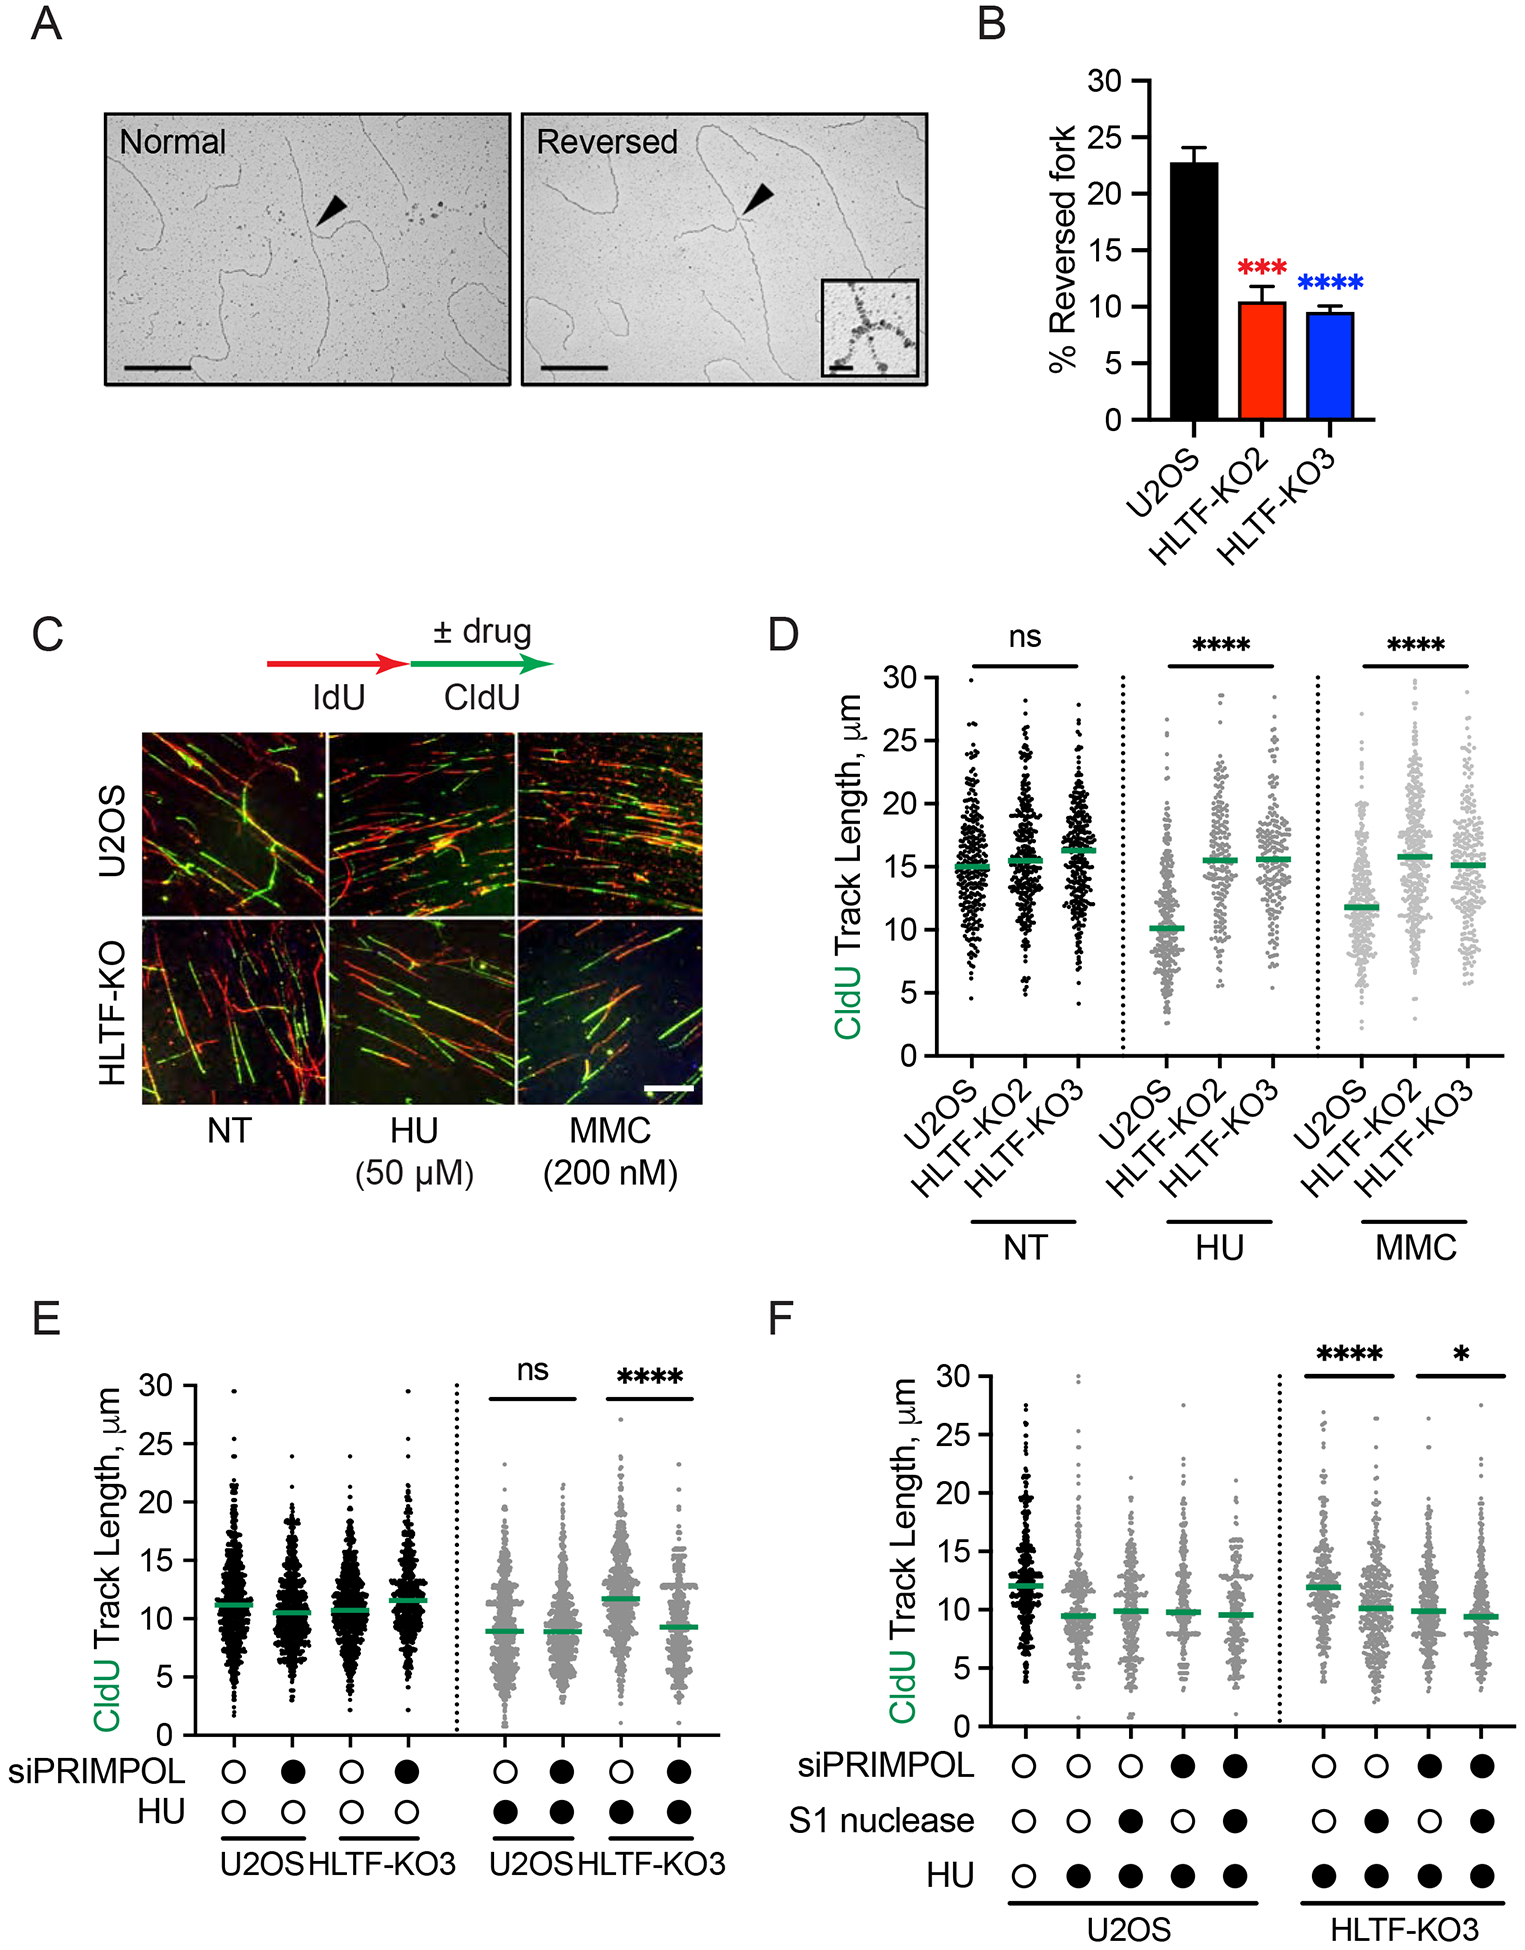
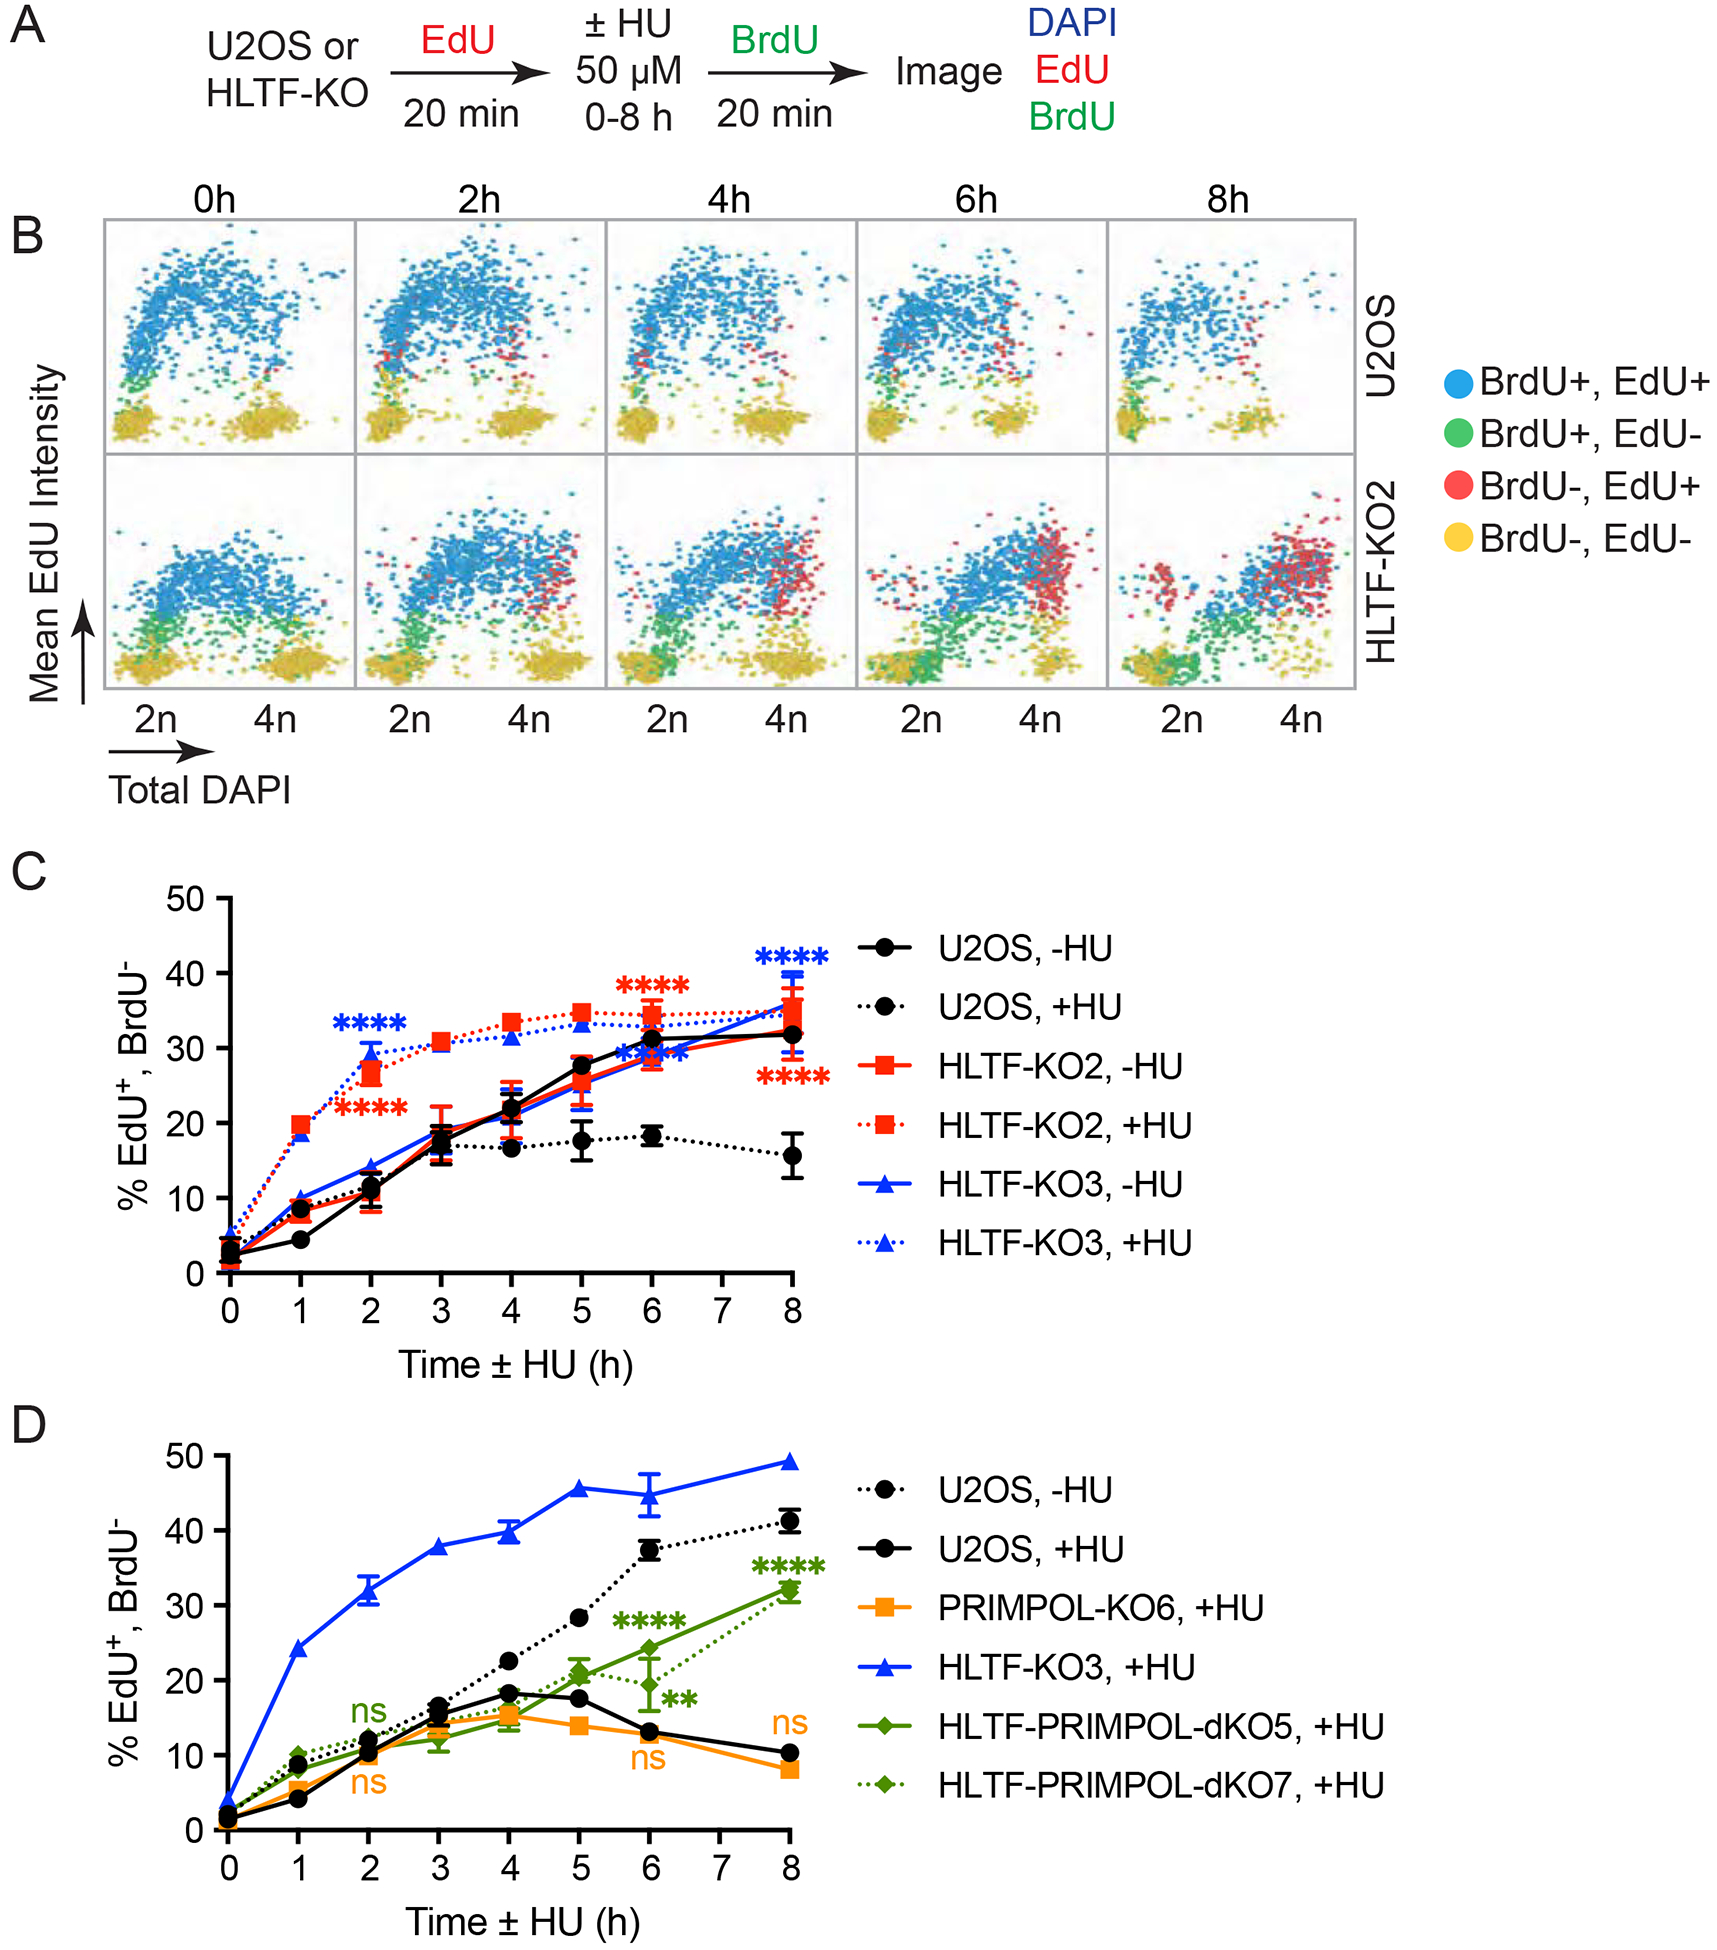
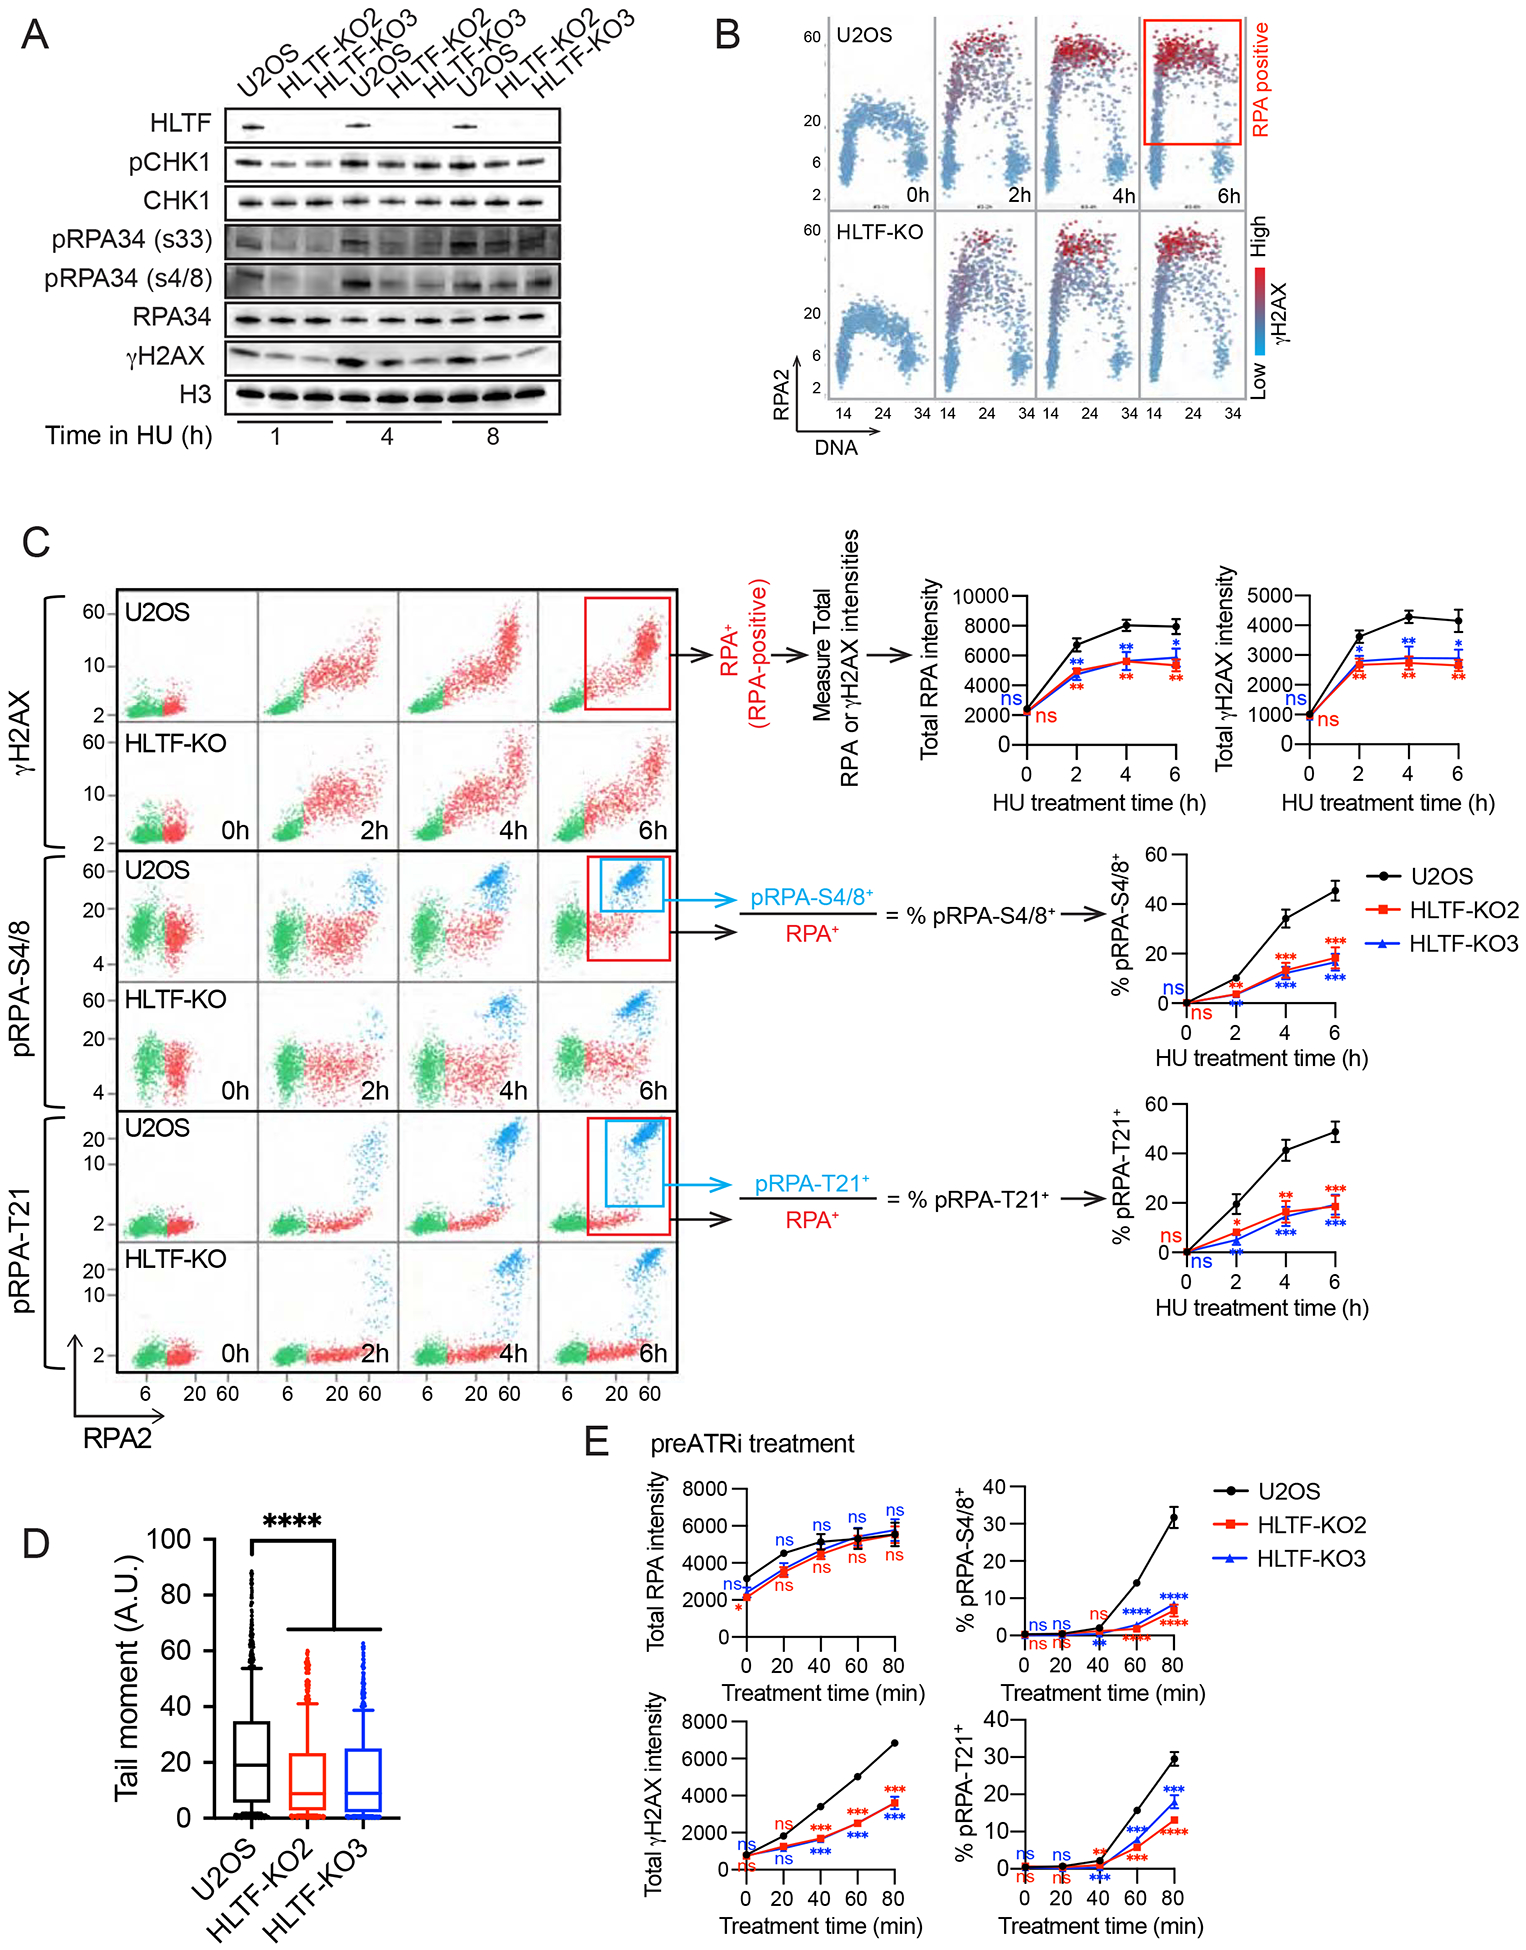
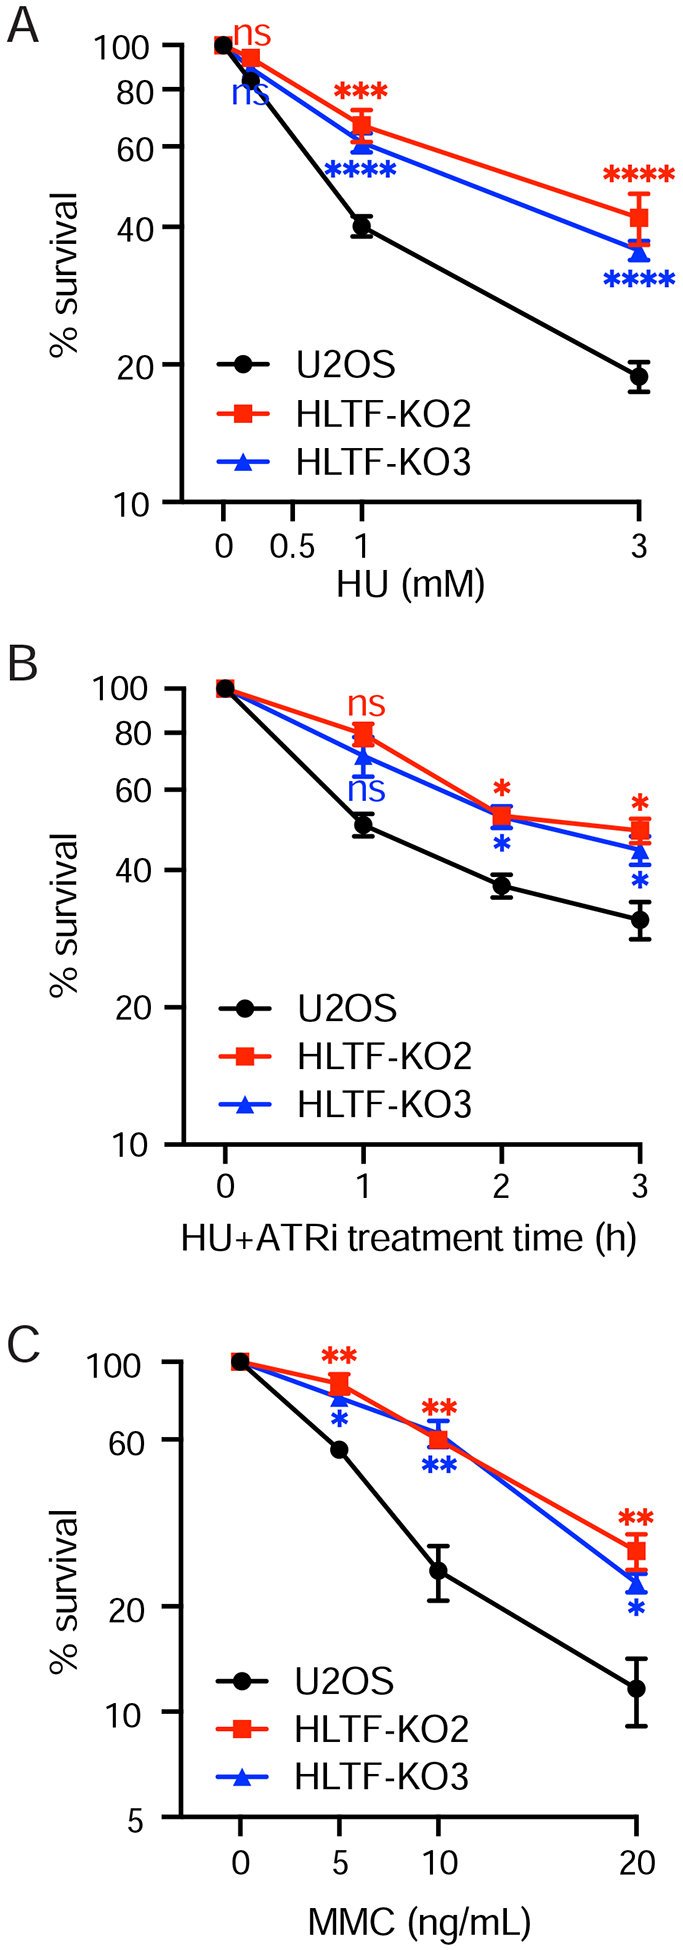
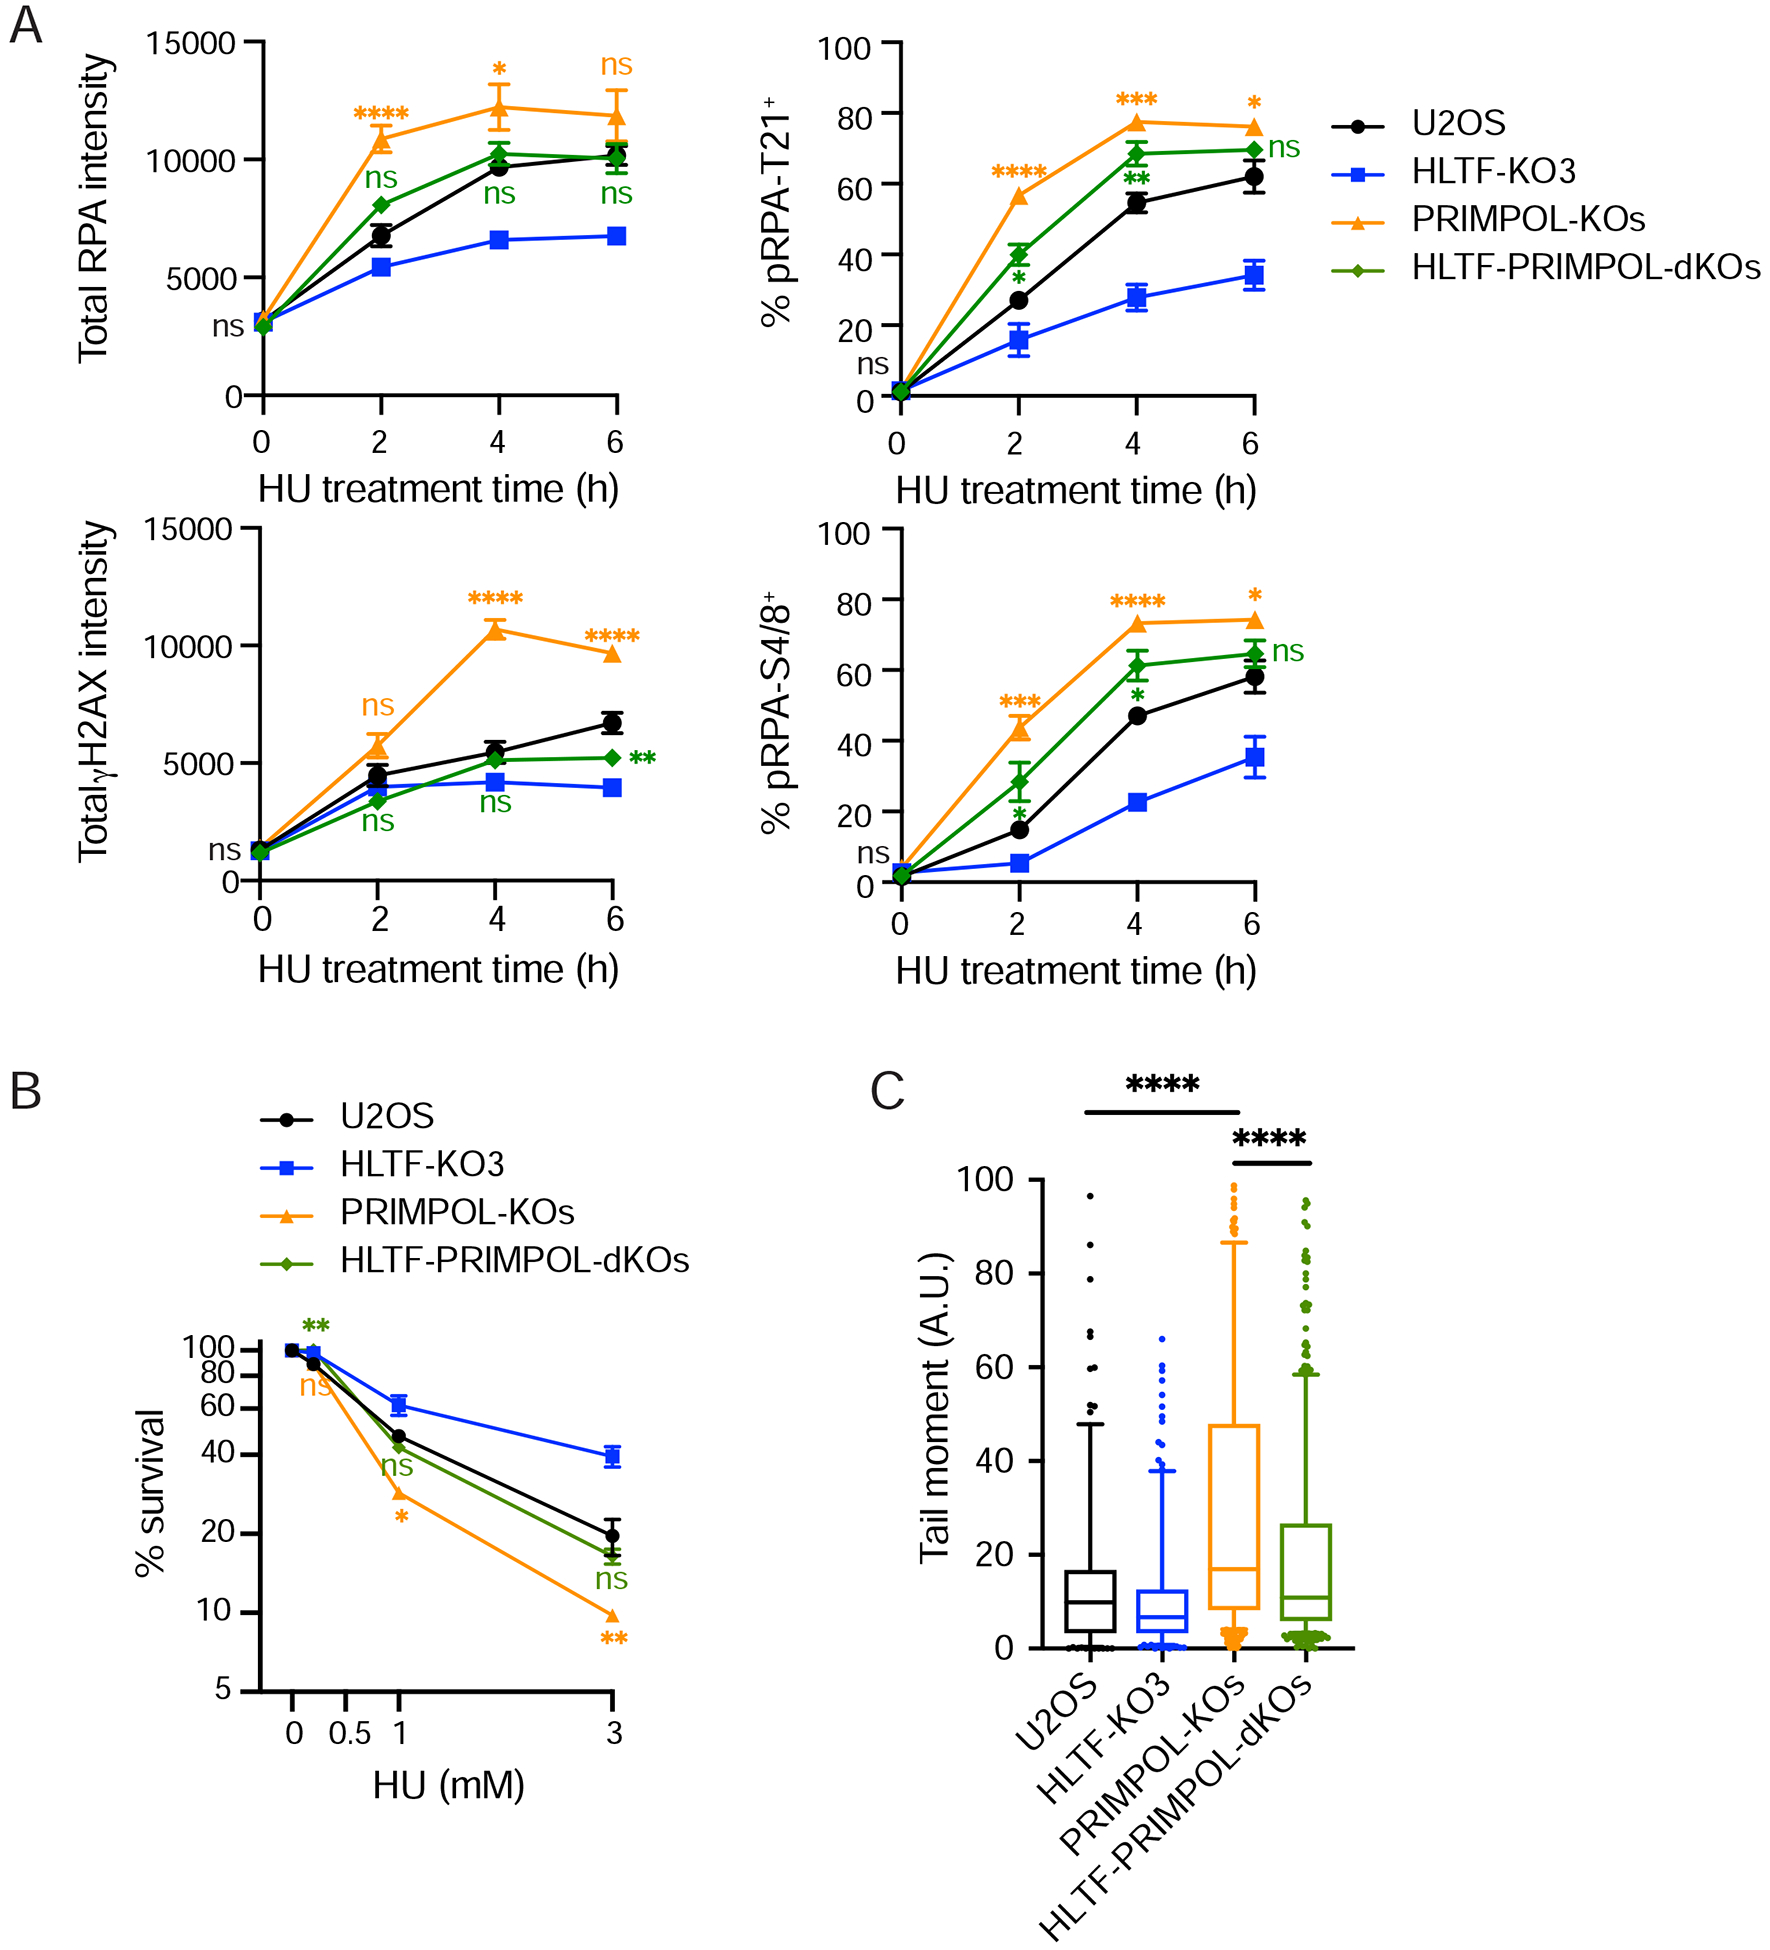
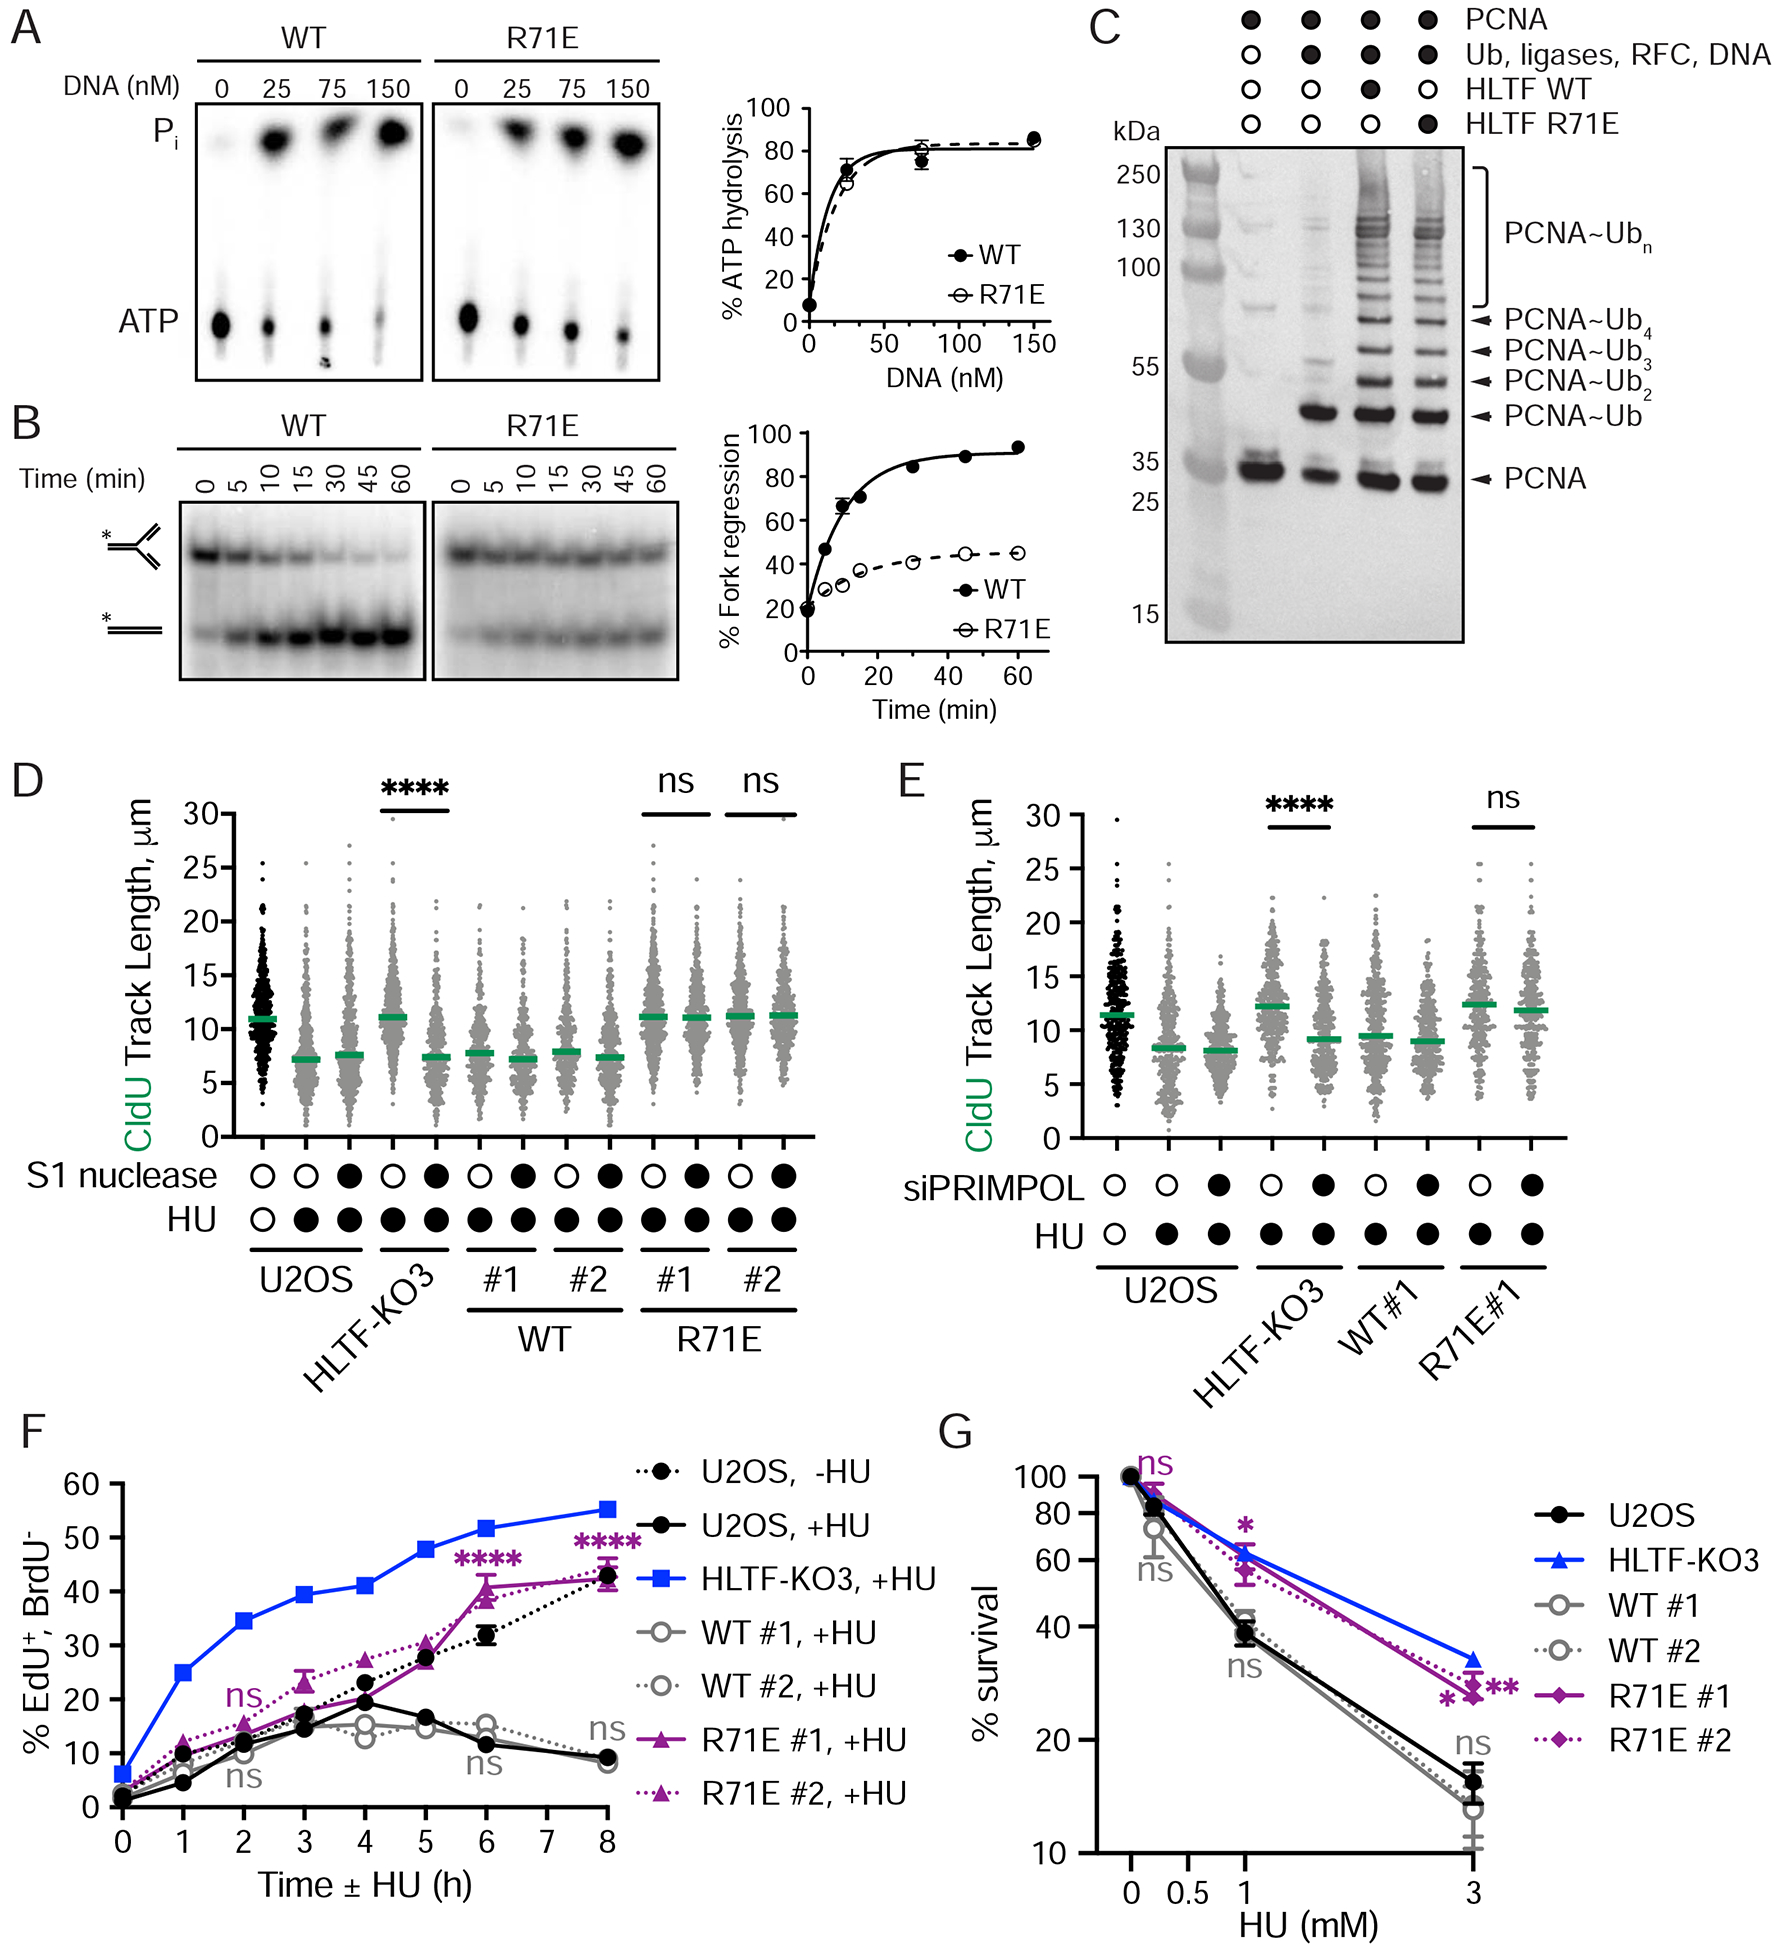
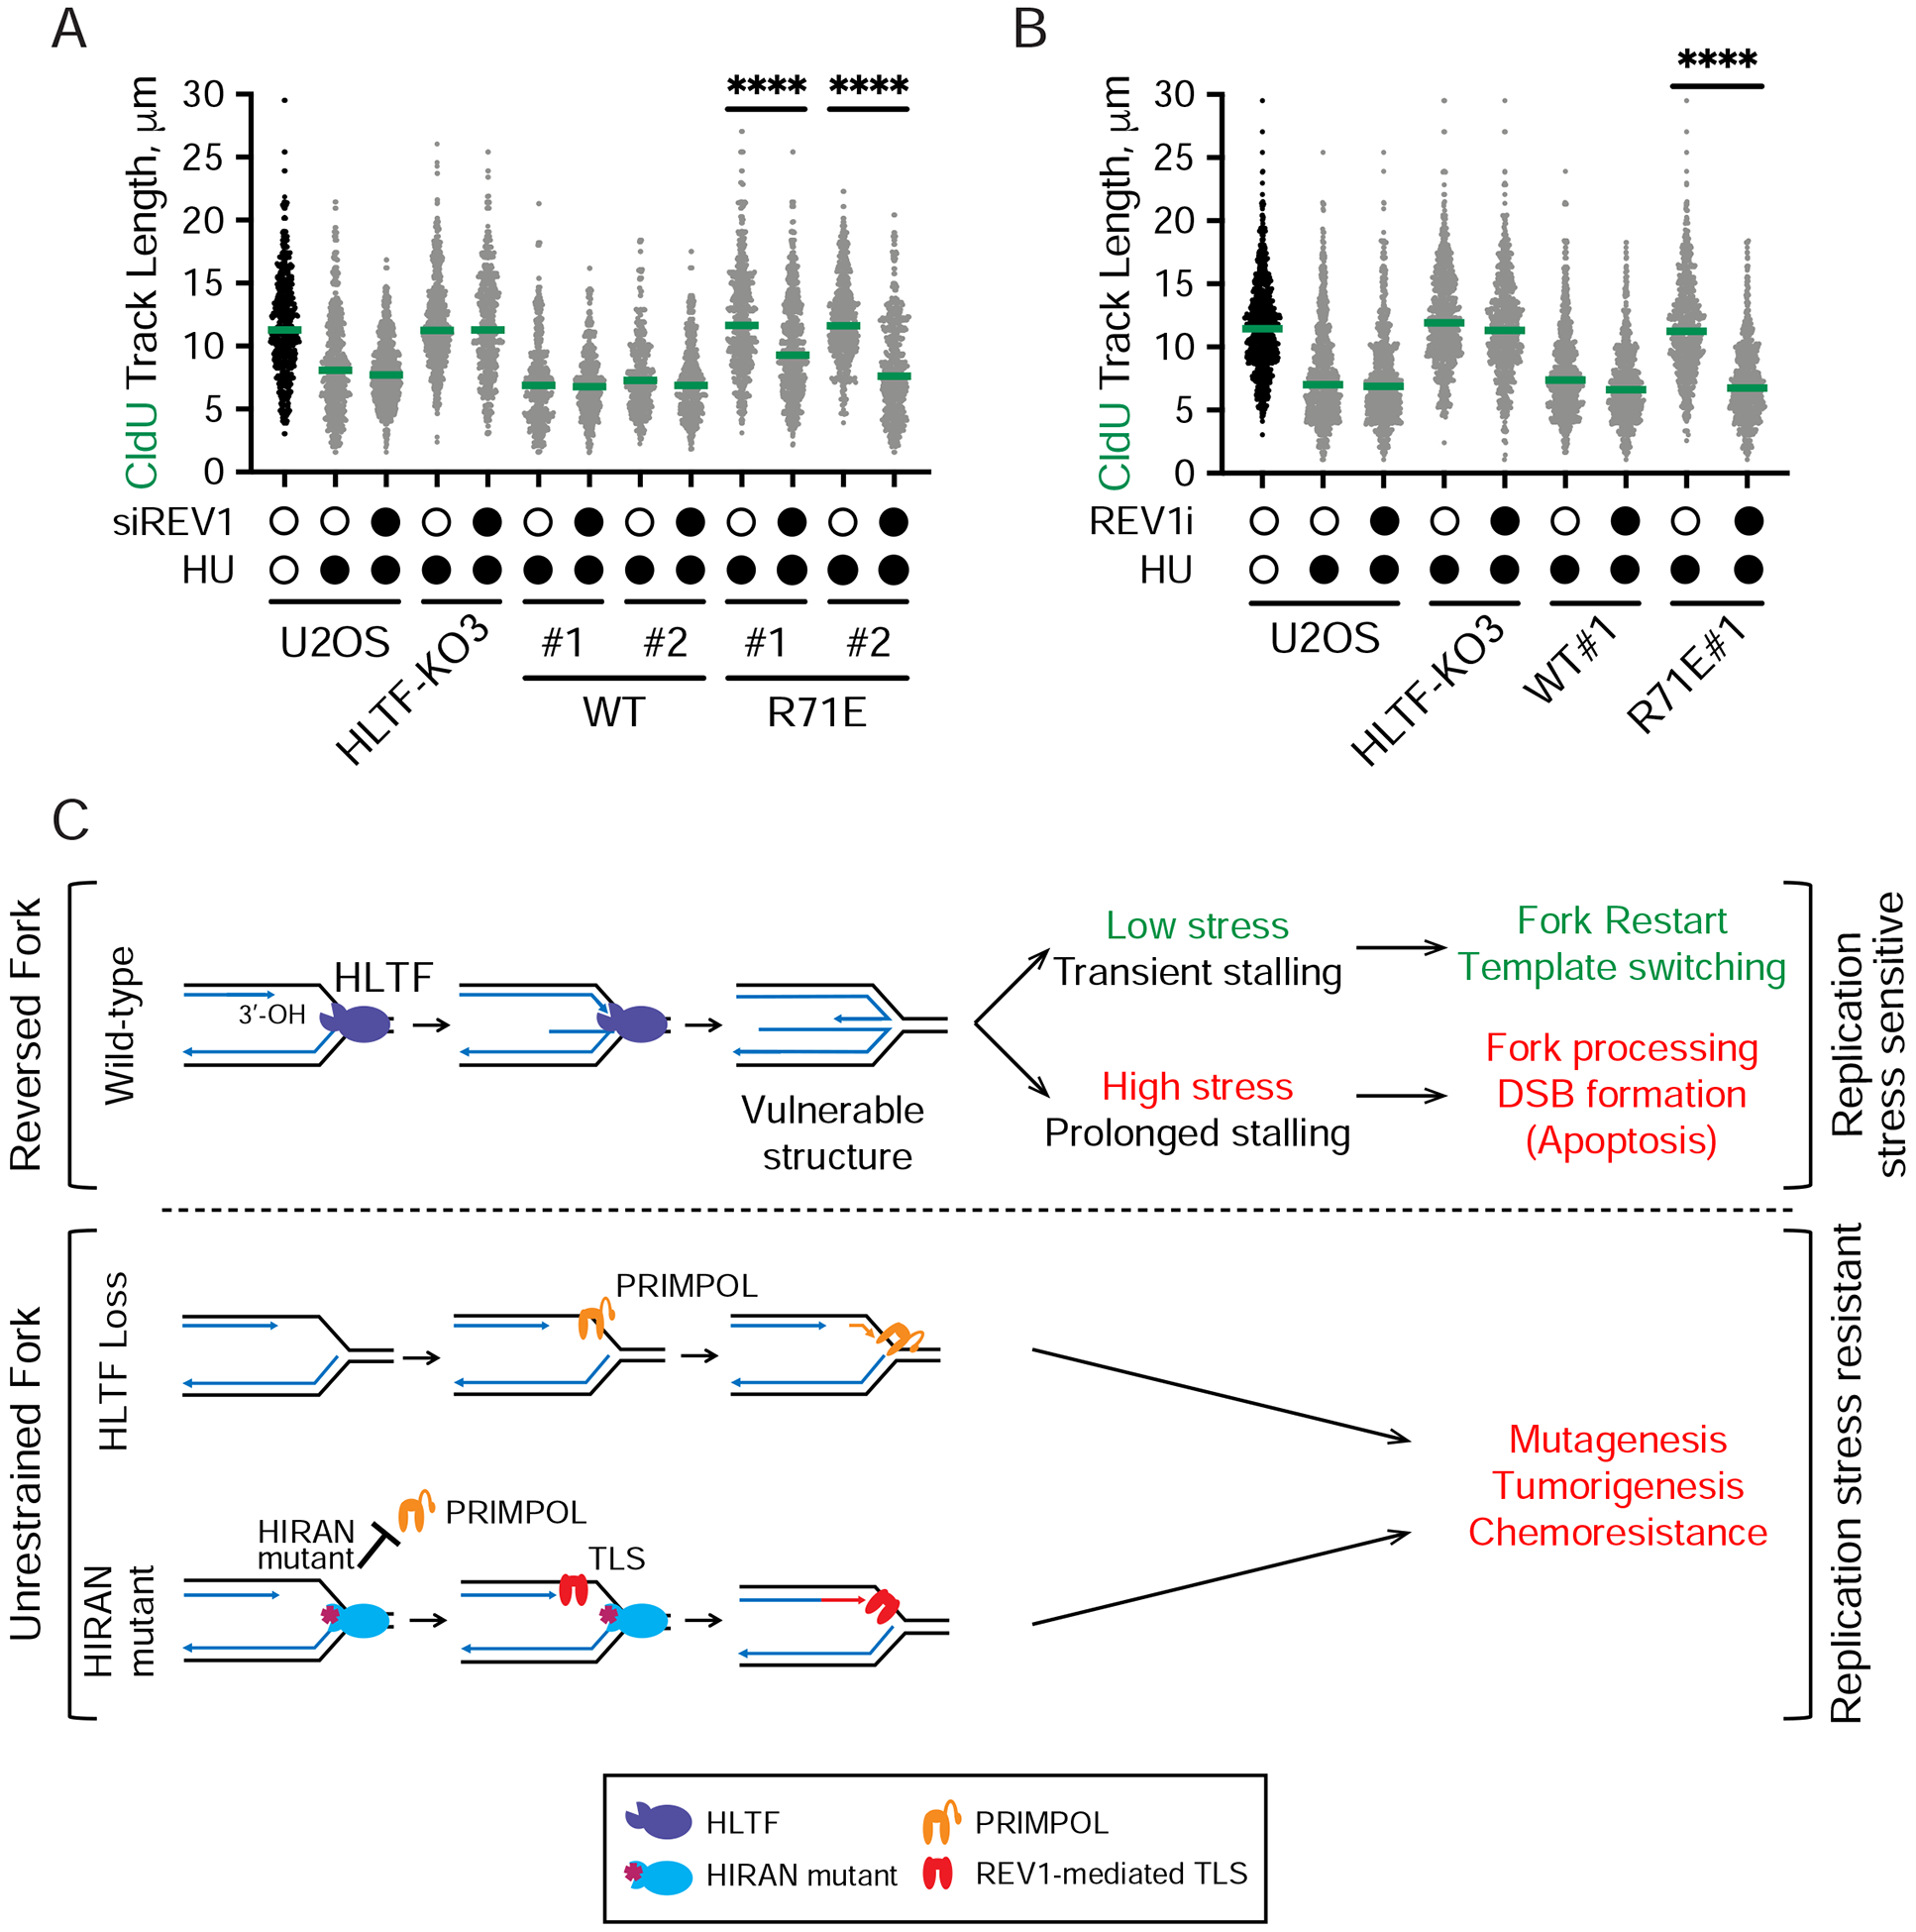
DNA replication stress can stall replication forks, leading to genome instability. DNA damage tolerance pathways assist fork progression, promoting replication fork reversal, translesion DNA synthesis (TLS), and repriming. In the absence of the fork remodeler HLTF, forks fail to slow following replication stress, but underlying mechanisms and cellular consequences remain elusive. Here, we demonstrate that HLTF-deficient cells fail to undergo fork reversal in vivo and rely on the primase-polymerase PRIMPOL for repriming, unrestrained replication, and S phase progression upon limiting nucleotide levels. By contrast, in an HLTF-HIRAN mutant, unrestrained replication relies on the TLS protein REV1. Importantly, HLTF-deficient cells also exhibit reduced double-strand break (DSB) formation and increased survival upon replication stress. Our findings suggest that HLTF promotes fork remodeling, preventing other mechanisms of replication stress tolerance in cancer cells. This remarkable plasticity of the replication fork may determine the outcome of replication stress in terms of genome integrity, tumorigenesis, and response to chemotherapy.

Keywords: DNA replication, replication stress response, fork reversal, HLTF, PRIMPOL, REV1, DNA damage tolerance, translesion synthesis, ATR inhibition, replication catastrophe.


Conflict of interest statement

Declaration of Interests The authors declare no competing interests.

Figures

Figure 1.
Figure 1.. HLTF promotes fork reversal in vivo and limits PRIMPOL-mediated unrestrained fork progression
(A) Electron micrographs of representative replication intermediates. Black arrows indicate fork junctions. Scale bars: (main images) 500nm; (insets) 20nm. (B) Frequency of reversed replication forks in WT or HLTF-KO U2OS cells treated with 50 μM HU for 1h. Means ± SEM (n≥3). ***, p<0.001; ****, p<0.0001, by one-way ANOVA then Dunnett’s test. (C) Experimental setup for replication fork progression assay. Representative fields of DNA fibers are shown. Scale bar: 15μm. (D) Dot plot and median of CldU tract lengths for 3 independent experiments (n=3). ns, not significant; ****, p < 0.0001, by Kruskal-Wallis test. (E and F) Dot plot and median of CldU tract lengths after control or siPRIMPOL-3 knockdown in mock or HU-treated (50 μM) cells (E) and treated with or without S1 nuclease (F). Open circle, no treatment; closed circle, HU treatment (n=3). ns, not significant; *, p < 0.05; ****, p < 0.0001, by Mann-Whitney test. See also Supplemental Figure 1.
Figure 2.
Figure 2.. HLTF loss promotes PRIMPOL-dependent S to G2 cell cycle progression.
(A) Experimental setup for S to G2 cell cycle progression assay. (B) QIBC generated scatter plots. 1500 cells/sample were randomly selected to generate the scatter plot. (C) Fraction of EdU-positive cells that progressed to G2 phase was determined as described in methods. Mean ± SEM (n=3). ****, p<0.0001, by two-way ANOVA then Dunnett’s test. Test results between HU-treated HLTF-KO vs. U2OS cells are shown. (D) S-G2 progression assay as described in A and C in indicated cells. Mean ± SEM (n=3). ns, not significant; **, p<0.01; ****, p<0.0001, by two-way ANOVA then Dunnett’s test. Test results between HU-treated PRIMPOL KO or HLTF-PRIMPOL dKO vs. U2OS cells are shown. See also Supplemental Figure 2.
Figure 3.
Figure 3.. HLTF loss limits DNA damage signaling, RPA chromatin binding and DSB formation
(A) Western blot of indicated proteins in WT and HLTF-KO U2OS cells treated with 3 mM HU for the time shown. (B) Cells were treated with 3 mM HU for the indicated time. Total DAPI as well as mean RPA and γH2AX intensities were measured at the single cell level by QIBC after pre-extraction. Scatter plot of single cells with RPA intensity (y-axis) vs DAPI intensity (x-axis) shown. Mean γH2AX intensity/cell is shown for each cell using a color scale. Box indicates the gated RPA positive population used for analyses shown in (C and E). ~1500 cells were randomly selected for each sample. (C) Cells are treated as in (B), and data are presented as a scatter plot with mean RPA intensity (x-axis) vs mean γH2AX/pRPA (S4/8 or T21) intensity (y-axis). Individual cells with different RPA, γH2AX and pRPA intensities are colored as follows: RPA negative cells are in green, and RPA positive cells are in red (RPA+, in red boxes), unless they also stain positive for pRPA (pRPA-S4/8+ or pRPA-T21+, colored in light blue and in light blue boxes). Total intensities (mean intensity × nuclear area) were calculated to account for differences in the nuclear size of isogenic WT and HLTF-KO cell lines. Population medians of total cellular RPA or γH2AX intensities and percentage (%) of pRPA-S4/8+ or pRPA-T21+ cells among RPA-positive cells from each experiment were averaged to generate the plot, ± SEM. (n≥3). Statistics: ns, not significant; *, p<0.05; **, p<0.01; ***, p<0.001 by one-way ANOVA then Dunnett’s test. Test results for each HLTF-KO clone vs. WT are shown. (D) Neutral comet assay results of WT and HLTF-KO U2OS cells after 24 h HU (3 mM) treatment (n=3). Statistics: ****, p<0.0001 by one-way ANOVA then Dunnett’s test. (E) Cells were treated with 5 μM ATRi for 80min and after washout with 3mM HU for the indicated times. Total RPA, γH2AX intensities and % of pRPA S4/8+ or T21 + cells among RPA-positive cells are plotted as described in (C). (n>3). Statistics: ns, not significant; **, p<0.01; ***, p<0.001; ****, p<0.0001 by one-way ANOVA then Dunnett’s test. Test results between each HLTF-KO clone vs. WT are shown. See also Supplemental Figure 3.
Figure 4.
Figure 4.. HLTF loss promotes resistance to replication stress
(A to C) Clonogenic survival assay of WT and HLTF-KO U2OS cells after HU (A), 3 mM HU and 5 μM ATRi (B) or MMC (C) treatment. Mean ± SEM (n=3). Statistics: ns, not significant; *, p<0.05; **, p<0.01; ***, p<0.001; ****, p<0.0001 by one-way ANOVA then Dunnett’s test. Test results between each HLTF-KO clone vs. WT are shown.
Figure 5.
Figure 5.. HLTF loss protects cells from replication stress in a PRIMPOL-independent manner.
(A) Total RPA and γH2AX intensities and percentage of pRPA-T21+ and pRPA S4/8+ cells were measured in RPA-positive cells as in Figure 3C. For PRIMPOL-KOs or PRIMPOL-HLTF dKOs, 3 clones of each genotype were analyzed individually and averaged for each independent experiment (A to C). Mean ± SEM (n=4). Statistics: ns, not significant; *, p<0.05; **, p<0.01; ***, p<0.001; ****, p<0.0001 by one-way ANOVA then Dunnett’s test. Test results between PRIMPOL-KO or HLTF-PRIMPOL dKO vs. WT are shown. (B) Clonogenic survival assay in indicated cells after 24 hr HU (3 mM) treatment. Mean ± SEM (n=2). PRIMPOL-KO or PRIMPOL-HLTF-dKO results are compared to WT cells in a statistical test. ns, not significant; *, p<0.05; **, p<0.01, by two tailed t-test. (C) Neutral comet assay in indicated cells after 24 hr HU (3 mM) treatment. Mean ± SEM (n=2). ****, p < 0.0001, by two-tailed Mann-Whitney test. See also Supplemental Figure 4.
Figure 6.
Figure 6.. The HLTF HIRAN mutant promotes an alternative mechanism of stress-resistant DNA replication
(A) Left, representative TLC plates. Right, quantification of DNA-dependent ATPase activity of indicated protein. Mean ± SEM (n=3). (B) Left, representative native PAGE results showing fork regression experiment. Model DNA forks were incubated with WT or HIRAN mutant HLTF proteins. The * represents the position of the 5’−32P-labeled oligonucleotide in the fork structure and product. Right, quantification of the results shown on the left. Mean ± SEM (n=3). (C) Western blot (α-PCNA) analysis of HLTF-dependent PCNA polyubiquitylation using either WT or R71E mutant HLTF. (D) Dot plot and median CldU tract length in indicated cells with or without S1 nuclease treatment after mock or HU (50 μM) treatment during CldU labeling. (n=3). ns, not significant; ****, p < 0.0001, by two-tailed Mann-Whitney test. (E) Dot plot and median CldU tract length in indicated cells after control or siPRIMPOL-3 knockdown. Cells were labeled and HU treated as described in (D). (n=3). ns, not significant; ****, p < 0.0001, by two-tailed Mann-Whitney test. (F) S-G2 progression as described in Figure 2. Mean ± SEM (n=3). ns, not significant; **, p<0.01; ****, p<0.0001, by two-way ANOVA then Dunnett’s test. Test results between WT or R71 E-rescue vs. U2OS are shown. (G) Colony formation following 24hr HU treatment. Mean ± SEM (n=3). ns, not significant; *, p<0.05; **, p<0.01, by one-way ANOVA then Dunnett’s test. Test results between WT or R71E- rescue vs. U2OS are shown. See also Supplemental Figure 5.
Figure 7.
Figure 7.. REV1 is required for unrestrained replication fork progression in the HIRAN mutant
(A) Dot plot and median CldU tract length in indicated cells after control or REV1 knockdown (siREVI). (n=3). ****, p < 0.0001, by two-tailed Mann-Whitney test. (B) Dot plot and median CldU tract length in indicated cells after control or REV1 inhibitor treatment (REV1i, 15 μM). REVi was added 30 min prior to labeling and remained throughout the experiment. (n=3). ****, p < 0.0001, by two-tailed Mann-Whitney test. (C) Proposed model for how HLTF prevents stress-resistant DNA replication. At forks stalled by replication stress, HLTF uses its HIRAN domain to engage the free 3’-OH group at the stalled fork to promote fork reversal and restrain fork progression (top). In response to transient stalling induced by low level replication stress, HLTF-mediated fork remodeling facilitates template switching and fork restart. At high levels of replication stress, fork stalling is prolonged and the HLTF remodeled replication fork is susceptible to nucleolytic processing and DSB formation. These events contribute to the sensitivity of WT cells to replication stress. When HLTF is lost (middle), fork progression is unrestrained and depends on PRIMPOL-mediated repriming, leading to discontinuous replication, and S1-sensitive gaps in the DNA. Mutation in HLTF’s HIRAN domain (bottom) disrupts its ability to engage the 3’-OH group at the stalled fork and prevents fork reversal, while the HIRAN mutant protein prevents PRIMPOL-mediated replication. Extension of the free 3’-OH group by REV1-mediated TLS sustains unrestrained fork progression. Both PRIMPOL-dependent and REV1-dependent fork progression contribute to replication stress resistance and potentially promote mutagenesis. Cancer cells might utilize these stress-resistant mechanisms of DNA replication to enhance tumorigenesis and chemoresistance. See also Supplemental Figure 6.

References

    1. Achar YJ, Balogh D, and Haracska L (2011). Coordinated protein and DNA remodeling by human HLTF on stalled replication fork. Proc Natl Acad Sci U S A 108, 14073–14078. - PMC - PubMed
    1. Achar YJ, Balogh D, Neculai D, Juhasz S, Morocz M, Gali H, Dhe-Paganon S, Venclovas C, and Haracska L (2015). Human HLTF mediates postreplication repair by its HIRAN domain-dependent replication fork remodelling. Nucleic Acids Res 43, 10277–10291. - PMC - PubMed
    1. Bansbach CE, Betous R, Lovejoy CA, Glick GG, and Cortez D (2009). The annealing helicase SMARCAL1 maintains genome integrity at stalled replication forks. Genes Dev 23, 2405–2414. - PMC - PubMed
    1. Betous R, Mason AC, Rambo RP, Bansbach CE, Badu-Nkansah A, Sirbu BM, Eichman BF, and Cortez D (2012). SMARCAL1 catalyzes fork regression and Holliday junction migration to maintain genome stability during DNA replication. Genes Dev 26, 151–162. - PMC - PubMed
    1. Bianchi J, Rudd SG, Jozwiakowski SK, Bailey LJ, Soura V, Taylor E, Stevanovic I, Green AJ, Stracker TH, Lindsay HD, et al. (2013). PrimPol bypasses UV photoproducts during eukaryotic chromosomal DNA replication. Mol Cell 52, 566–573. - PMC - PubMed

Publication types

MeSH terms