. 2020 Jul 22;107(2):368-382.e8.
doi: 10.1016/j.neuron.2020.04.024. Epub 2020 May 21.

VTA Glutamatergic Neurons Mediate Innate Defensive Behaviors

Affiliations

VTA Glutamatergic Neurons Mediate Innate Defensive Behaviors

M Flavia Barbano et al. Neuron. .

Abstract

The ventral tegmental area (VTA) has dopamine, GABA, and glutamate neurons, which have been implicated in reward and aversion. Here, we determined whether VTA-glutamate or -GABA neurons play a role in innate defensive behavior. By VTA cell-type-specific genetic ablation, we found that ablation of glutamate, but not GABA, neurons abolishes escape behavior in response to threatening stimuli. We found that escape behavior is also decreased by chemogenetic inhibition of VTA-glutamate neurons and detected increases in activity in VTA-glutamate neurons in response to the threatening stimuli. By ultrastructural and electrophysiological analysis, we established that VTA-glutamate neurons receive a major monosynaptic glutamatergic input from the lateral hypothalamic area (LHA) and found that photoinhibition of this input decreases escape responses to threatening stimuli. These findings indicate that VTA-glutamate neurons are activated by and required for innate defensive responses and that information on threatening stimuli to VTA-glutamate neurons is relayed by LHA-glutamate neurons.

Keywords: VTA; VTA calcium imaging; VTA-GABA neurons; VTA-VGluT2 neurons; innate escape behavior; lateral hypothalamic area; looming; predator odor; threatening stimuli.


Conflict of interest statement

Declaration of Interests The authors declare no competing interests.

Figures
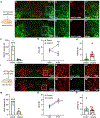
Figure 1.
Figure 1.. VTA-VGluT2 neurons, but not VGaT neurons, mediate innate escape responses.
(A) VTA viral injections. Low (B) and high (C-C”) magnification of VTA control-mouse (injected with AAV1-DIO-DsRed) showing neurons expressing VGluT2 mRNA (red) intermixed with TH-immunoreactive neurons (TH-IR, green). Low (D) and high (E-E”) magnification of VTA mouse injected with AAV1-Flex-taCasp3 showing TH-IR and lack of VGluT2 mRNA. (F) VTA-VGluT2 neurons are present in control-mice (408.67 ± 115.84; 3 mice), but infrequent in caspase-mice (32.67 ± 9.56; 3 mice; 3 sections per mouse; t(4)=−3.23, * P<0.05, t test; data represent means ± SEM). (G) Number of runs induced by looming stimulus is lower in caspase-mice than in control-mice (control, n=7; caspase, n=9; group x experimental phase: F(1,14)=56.07, P<0.001, ANOVA with Newman-Keuls post hoc test; data represent means ± SEM). ** P<0.01,*** P<0.001, against the first 3 min of the test, for each group; ++ P<0.01, against control. (H) Escape latency from TMT odor is higher in in caspase-mice than in control-mice (control, n=7; caspase, n=9; t(14)=−2.98, ** P<0.01, t test; data represent means ± SEM). (I) VTA viral injections. Low (J) and high (K-K”) magnification of VTA control-mouse (injected with AAV1-DIO-DsRed) showing neurons expressing VGaT mRNA (green) intermixed with TH-IR cells (red). Low (L) and high (M-M”) magnification of VTA from a mouse injected with AAV1-Flex-taCasp3 showing TH-IR and lacking VGaT mRNA. (N) VTA-VGaT neurons are present in control-mice (136 ± 18.5; 3 mice), but infrequent in caspase-mice (33 ± 14.53; 3 mice; 3 sections per mouse; t(4)=4.38, * P<0.05, t test; data represent means ± SEM). (O) The number of runs induced by looming stimulus is similar in control and caspase mice (control, n=7; caspase, n=9; group x experimental phase: F(1,14)=0.002, P=0.97, ANOVA. *** P<0.001, against the first 3 min of the experiment; data represent means ± SEM). (P) The latency to escape from TMT odor is similar in control and caspase mice (control, n=7; caspase, n=9; t(14)=0.73, P=0.48, t test; data represent means ± SEM). See also Figure S1.
Figure 2.
Figure 2.. VTA-VGluT2 neurons encode innate escape responses.
(A) VTA viral injection of AAV-Flex-GCaMP6s and VTA photometry fiber (top); schematic representation of the looming stimulus (bottom). (B) Whole session recording from VTA-VGluT2 neurons showing time of looming stimulus onset (top); heatmap of Ca2+ activity over successive looming trials (middle); cell population responses to looming stimulus onset showing increases in Ca2+ activity in VTA-VGluT2 neurons (bottom). (C) Population Ca2+activity (± SEM) in VTA-VGluT2 neurons during looming stimulus onset. Inset: Area under the curve (AUC) for Ca2+ activity in VTA-VGluT2 neurons before (−5s – 0s, baseline) and after (0s – 5s, onset) onset of looming stimulus (n=12; t test; t(186)=6.52, *** P<0.001; data represent means ± SEM). (D) Schematic representation of odor exposure. (E) Population of Ca2+ activity (± SEM) in VTA-VGluT2 neurons in response to lemon (left) or TMT (right) odor. (F) AUC for Ca2+ activity in VTA-VGluT2 neurons in response to lemon or TMT odors (n=12; odor x epoch: F(1,426)=9.50, P<0.001, ANOVA with Bonferroni post hoc test. *** P<0.001; data represent means ± SEM). (G) Viral injections of AAV-hM4D-mCherry or AVV-mCherry in VTA of VGluT2::Cre mice. (H) Chemogenetic inhibition of VTA-VGluT2 neurons by intraperitoneal (IP) CNO injection (3 mg/kg) increased escape latency from TMT odor (t(25)=−27.61, P=0.005, t test; data represent means ± SEM). ++ P<0.01 against vehicle. (I) Chemogenetic inhibition of VTA-VGluT2 neurons by IP J60 injection (0.1 mg/kg) increased escape latency from TMT odor (mCherry: n=6, hM4D-mCherry: n=6, group x treatment: F(1,10)=5.61, P<0.05, ANOVA with Newman-Keuls post hoc test; data represent means ± SEM). * P<0.05, against vehicle; ++ P<0.01 against mCherry. (J) Chemogenetic inhibition of VTA-VGluT2 neurons by intra-VTA J60 injection (0.1 μg/μl) increased escape latency from cat urine odor (hM4D-mCherry: n=6, odor x treatment: F(1,5)=51.31, P<0.001, ANOVA with Newman-Keuls post hoc test; data represent means ± SEM). * P<0.05; *** P<0.001, against water odor; +++ P<0.001 against aCSF. See also Figure S2.
Figure 3.
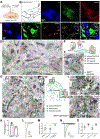
Figure 3.. Within the VTA, LHA-VGluT2 neurons preferentially establish excitatory synapses on VGluT2 neurons.
(A) Viral injection of AAV1-DIO-ChR2-mCherry into LHA and AAV1-DIO-eYFP into VTA of VGluT2::Cre mice. (B) Confocal microscopy of VTA at low magnification; TH (blue), VGluT2-eYFP neurons (green) and VGluT2-mCherry fibers from LHA (red). (C) Box in B at higher magnification showing TH neurons, VGluT2 neurons and terminals (arrows and arrowheads) from LHA-VGluT2 neurons co-expressing mCherry and VGluT2 protein (white). Note terminals contacting soma (magenta arrow in neuron #1) and dendrites (magenta arrowheads) from VTA-VGluT2 neurons or contacting soma from a VTA-VGluT2-TH neuron (yellow arrow in neuron #2). (D) Single VTA-VGluT2 dendrite (green outline with GFP detected by gold particles, arrowhead) making asymmetric synapses (green arrows) with three axon terminals (AT1–3, red outlines) from LHA-VGluT2 neurons co-expressing mCherry (scattered dark material) and VGluT2 (arrowhead, gold particles). A VGluT2-negative dendrite (blue outline) makes an asymmetric synapse (green arrow) with a terminal (AT4) from a LHA-VGluT2 neuron. (E) Corresponding diagram. (F) AT3 at higher magnification. (G) A VTA-VGluT2 soma (green outline with GFP detected by gold particles, arrowhead) making asymmetric synapses (green arrows) with two AT (AT1–2, red outlines) from LHA-VGluT2 neurons co-expressing mCherry (scattered dark material) and VGluT2 (gold particles). (H) Corresponding diagram. (I-J). AT1 and AT2 at higher magnification. (K) Within the VTA, LHA-VGluT2 axon terminals more frequently synapse on VGluT2+ dendrites (699/1420 LHA-VGluT2 terminals) than on TH+ dendrites (538/1690 LHA-VGluT2 terminals; t(4)=2.81, * P<0.05, t test; data represent means ± SEM). (L) Evoked excitatory postsynaptic currents (EPSCs) at −60 mV (baseline, green trace) abolished by 10 μM CNQX (gray trace), but not by 10 μM bicuculline (pink trace). (M) EPSCs amplitude in VTA-VGluT2 neurons (baseline: −39.08 ± 5.77 pA, bicuculline: −43.09 ± 6.71 pA, bicuculline + CNQX: −2.3 ± 0.32 pA; n=11 neurons from 7 mice; F(2,32)=35.97, P<0.001; *** P<0.001 versus baseline, ANOVA with Dunnett’s post hoc test; data represent means ± SEM). (N) EPSCs at −60 mV (baseline, green trace) abolished by 1 μM TTX (black trace), and restored by 200 μM 4AP (blue trace). (O) EPSCs amplitude in VTA-VGluT2 neurons (baseline: −56.96 ± 9.13 pA, TTX: −10.04 ± 2.83 pA, TTX + 4AP: −74.85 ± 16.48 pA, CNQX: −9.72 ± 3.58 pA; n=5 neurons from 3 mice; F(3,19)=17.55, P<0.001; ** P<0.01 versus baseline, ANOVA with Dunnett’s post hoc test; data represent means ± SEM). See also Figures S3, S4, S5, and Table S1.
Figure 4.
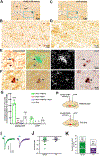
Figure 4.. VTA photostimulation of LHA-VGluT2 fibers induces c-Fos expression mostly in VGluT2 neurons.
(A, C) c-Fos expression (brown nuclei) induced by VTA photostimulation of LHA-VGluT2 fibers in ChR2-eYFP (A) or eYFP mice (C). (B, D) Higher magnification. (E) Neuron co-expressing c-Fos and VGluT2, lacking VGaT mRNA (arrow). (F) Neuron co-expressing c-Fos and VGaT mRNA, lacking VGluT2 mRNA (arrowhead). (G) VTA number of c-Fos neurons was higher in ChR2-eYFP mice (252.67 ± 17.33; n=3, 9 sections/mouse) than in eYFP mice (89.00 ± 2.31; n=3, 9 section/mouse; t(4)= 9.36, p<0.001, t test). Within VTA of ChR2-eYFP mice, most of c-Fos neurons co-expressed VGluT2 mRNA (169.33 ± 13.38, 508 neurons), fewer co-expressed VGaT (16.67 ± 6.89, 50 neurons) or VGluT2 and VGaT (5.00 ± 2.31, 7 neurons), and two thirds lacked both VGluT2 and VGaT mRNA (61.67 ± 11.46, 106 neurons; cell type: F(3,6)=58.36, P<0.001, ANOVA with Newman-Keuls post hoc test; data represent means ± SEM). Asterisks indicate significant differences against c-Fos / VGluT2 neuronal subtype. *** P<0.001. (H) Viral injection of AAV1-CamKII-ChR2-mCherry into LHA and AAV1-DIO-eYFP into VTA of VGluT2::Cre or TH::Cre mice. (I-K) Recordings of VTA-VGluT2 (green) and VTA-TH (purple) neurons in response to VTA photostimulation. (I) Voltage clamp trace of a VTA-VGluT2 neuron and a VTA-TH neuron after VTA photostimulation (blue rectangle). (J) EPSCs amplitude in VGluT2 or TH neurons is not significantly different (t test, t(20)=0.9915, P= 0.33; data represent means ± SEM). (K) Number of photostimulation responding VTA-VGluT2 (15 out of 23, 4 mice) and VTA-TH (7 out of 19, 3 mice) neurons. See also Figures S6, S7 and Table S2.
Figure 5.
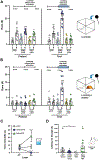
Figure 5.. VTA photostimulation or photoinhibition of LHA-VGluT2 fibers modulates innate escape responses.
(A) Runs induced by a looming stimulus during VTA photostimulation or photoinhibition of LHA-VGluT2 fibers, in absence of shelter. Looming increases runs in all tested mouse groups, but laser activation further increased runs in ChR2-eYFP mice, while laser inactivation decreased runs in Halo-eYFP mice (eYFP, n=10; ChR2-eYFP, n=10; Halo-eYFP, n=8; group x experimental phase x time: F(2,25)=18.40, P<0.001, ANOVA with Newman-Keuls post hoc test; data represent means ± SEM). * P<0.05, ** P<0.01, *** P<0.001, against the first 3 min of the experiment, for each group; + P<0.05, +++ P<0.001, against the same period in the pretest phase. (B) Runs induced by a looming stimulus during VTA photostimulation or photoinhibition of LHA-VGluT2 fibers in the presence of shelter. In the absence of laser activation, mice from all groups hided in the shelter and looming did not induce runs. Laser activation induced runs in ChR2-eYFP mice (eYFP, n=10; ChR2-eYFP, n=10; Halo-eYFP, n=8; group x experimental phase x time: F(2,25)=14.55, P<0.001, ANOVA with Newman-Keuls post hoc test; data represent means ± SEM). *** P<0.001, against the first 3 min of the experiment, for each group; +++ P<0.001, against the same period in the pretest phase. (C) Total time immobile during forced swim test before and during VTA photostimulation or photoinhibition of LHA-VGluT2 fibers (eYFP, n=9; ChR2-eYFP, n=9; Halo-eYFP, n=11; group x experimental phase: F(2,26)=4.25, P<0.05, ANOVA with Newman-Keuls post hoc test; data represent means ± SEM). * P<0.05, against eYFP; + P<0.05, against laser off. (D) Escape latency from lemon or TMT odor (eYFP lemon, n=13; ChR2-eYFP lemon, n=14; eYFP TMT, n=6; Halo-eYFP TMT, n=9; group: F(3,38)=3.17, P=0.05, ANOVA with Newman-Keuls post hoc test; data represent means ± SEM). * P<0.05, against corresponding eYFP group; + P<0.05, between eYFP groups. See also Figures S6, S8, S9 and Table S3.
Figure 6.
Figure 6.. LHA-VGluT2 neurons projecting to VTA are activated by innate threats.
(A) VTA injection of retrograde virus HSV-LS1L-GCaMP6s and LHA photometry fiber. (B) VTA retrograde LHA-VGluT2 neurons expressing GCamP6s-GFP below photometry fiber. (C) LHA photometry fiber placements. (D) Schematic representation of the looming stimulus. (E) Whole session recording of LHA-VGluT2 neurons projecting to VTA showing time of looming stimulus onset (top), heatmap of Ca2+ activity over successive looming trials (middle), and cell population responses to looming stimulus onset showing increases in Ca2+ activity in LHA-VGluT2 neurons projecting to VTA (bottom). (F) Population Ca2+ activity (+ SEM) in LHA-VGluT2 neurons, projecting to VTA, during looming stimulus onset. Inset: Area under the curve (AUC) for Ca2+ activity in LHA-VGluT2 neurons, projecting to VTA, before (−5s – 0s, baseline) and after (0s – 5s, onset) onset of the looming stimulus (n=7; t test; t(112)=10.94, *** P<0.001; data represent means ± SEM). (G) Schematic representation of odor test. (H) Population Ca2+ activity (+ SEM) in LHA-VGluT2 neurons, projecting to VTA, in response to lemon (left) or TMT (right) odor. (I) AUC for Ca2+ activity in LHA-VGluT2 neurons, projecting to VTA, in response to lemon or TMT odor (n=9; odor x epoch: F(1,342)=17.25, P<0.001, ANOVA with Bonferroni post hoc test. *** P<0.001; data represent means ± SEM). See also Figure S10.

References

    1. Barbano MF, Wang H-L, Morales M, and Wise RA (2016). Feeding and reward are differentially induced by activating GABAergic lateral hypothalamic projections to VTA. J. Neurosci 36, 2975–2985. - PMC - PubMed
    1. Beier KT, Gao XJ, Xie S, DeLoach KE, Malenka RC, and Luo L (2019). Topological organization of Ventral Tegmental Area connectivity revealed by viral-genetic dissection of input-output relations. Cell Rep. 26, 159–167. - PMC - PubMed
    1. Berridge KC, and Robinson TE (1998) What is the role of dopamine in reward: Hedonic impacto, reward learning, or incentive salience? Brain Res. Brain Res. Rev 28, 309–369. - PubMed
    1. Berrios J, Stamatakis AM, Kantak PA, McElligott ZA, Judson MC, Aita M, Rougie M, Stuber GD, and Philpot BD (2016). Loss of UBE3A from TH-expressing neurons suppresses GABA co-release and enhances VTA-Nac optical self-stimulation. Nat. Commun 7, 10702. - PMC - PubMed
    1. Brischoux F, Chakraborty S, Brierley DI, and Ungless MA (2009). Phasic excitation of dopamine neurons in ventral VTA by noxious stimuli. Proc. Natl. Acad. Sci 106, 4894–4899. - PMC - PubMed

Publication types

MeSH terms

LinkOut - more resources