

Localizing Components of Shared Transethnic Genetic Architecture of Complex Traits from GWAS Summary Data
- PMID: 32442408
- PMCID: PMC7273527
- DOI: 10.1016/j.ajhg.2020.04.012
Localizing Components of Shared Transethnic Genetic Architecture of Complex Traits from GWAS Summary Data
Abstract
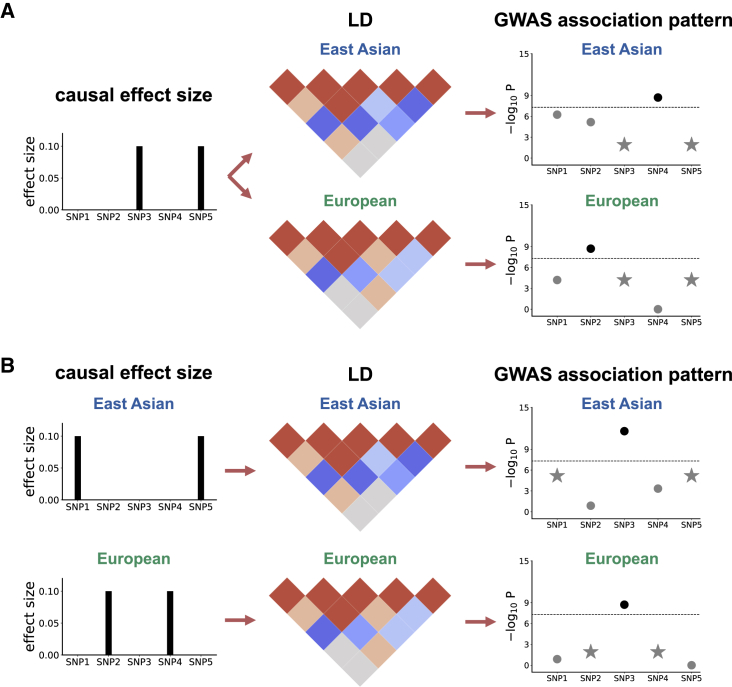
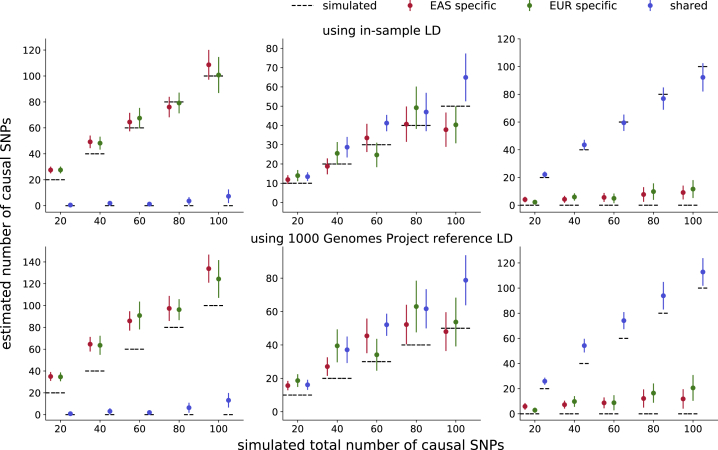
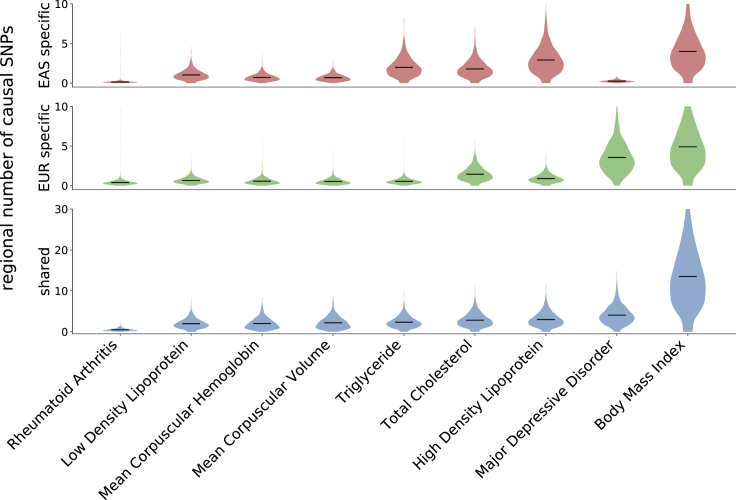
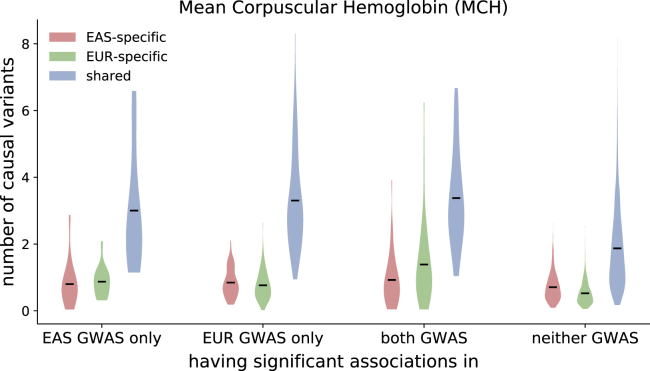
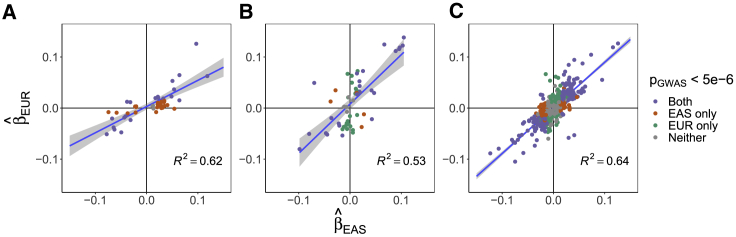
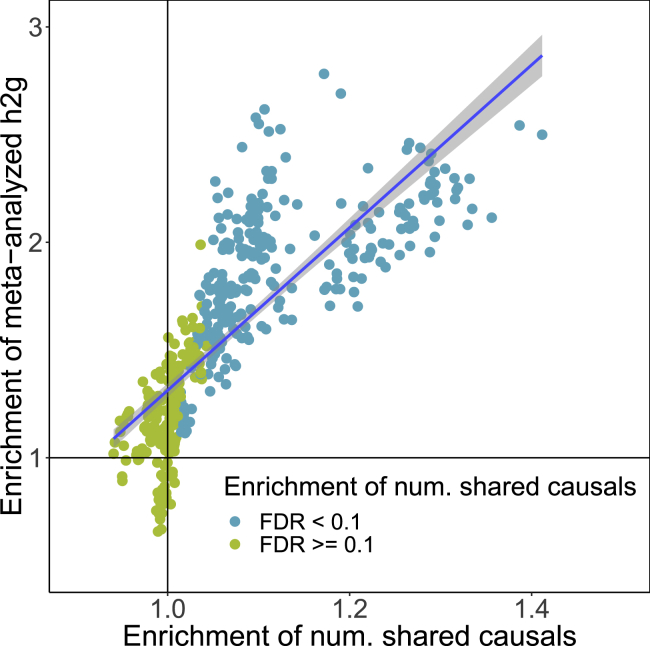
Despite strong transethnic genetic correlations reported in the literature for many complex traits, the non-transferability of polygenic risk scores across populations suggests the presence of population-specific components of genetic architecture. We propose an approach that models GWAS summary data for one trait in two populations to estimate genome-wide proportions of population-specific/shared causal SNPs. In simulations across various genetic architectures, we show that our approach yields approximately unbiased estimates with in-sample LD and slight upward-bias with out-of-sample LD. We analyze nine complex traits in individuals of East Asian and European ancestry, restricting to common SNPs (MAF > 5%), and find that most common causal SNPs are shared by both populations. Using the genome-wide estimates as priors in an empirical Bayes framework, we perform fine-mapping and observe that high-posterior SNPs (for both the population-specific and shared causal configurations) have highly correlated effects in East Asians and Europeans. In population-specific GWAS risk regions, we observe a 2.8× enrichment of shared high-posterior SNPs, suggesting that population-specific GWAS risk regions harbor shared causal SNPs that are undetected in the other GWASs due to differences in LD, allele frequencies, and/or sample size. Finally, we report enrichments of shared high-posterior SNPs in 53 tissue-specific functional categories and find evidence that SNP-heritability enrichments are driven largely by many low-effect common SNPs.
Keywords: GWAS; PRS; ancestry; complex traits; fine-mapping; linkage disequilibrium; polygenicity; transethnic.
Copyright © 2020 American Society of Human Genetics. Published by Elsevier Inc. All rights reserved.
Conflict of interest statement
The authors declare no competing interests.
Figures
Similar articles
-
Estimation of regional polygenicity from GWAS provides insights into the genetic architecture of complex traits.PLoS Comput Biol. 2021 Oct 21;17(10):e1009483. doi: 10.1371/journal.pcbi.1009483. eCollection 2021 Oct. PLoS Comput Biol. 2021. PMID: 34673766 Free PMC article.
-
Transethnic differences in GWAS signals: A simulation study.Ann Hum Genet. 2018 Sep;82(5):280-286. doi: 10.1111/ahg.12251. Epub 2018 May 7. Ann Hum Genet. 2018. PMID: 29733446
-
Theoretical and empirical quantification of the accuracy of polygenic scores in ancestry divergent populations.Nat Commun. 2020 Jul 31;11(1):3865. doi: 10.1038/s41467-020-17719-y. Nat Commun. 2020. PMID: 32737319 Free PMC article.
-
What genome-wide association studies reveal about the association between intelligence and mental health.Curr Opin Psychol. 2019 Jun;27:25-30. doi: 10.1016/j.copsyc.2018.07.007. Epub 2018 Jul 24. Curr Opin Psychol. 2019. PMID: 30110665 Review.
-
15 years of GWAS discovery: Realizing the promise.Am J Hum Genet. 2023 Feb 2;110(2):179-194. doi: 10.1016/j.ajhg.2022.12.011. Epub 2023 Jan 11. Am J Hum Genet. 2023. PMID: 36634672 Free PMC article. Review.
Cited by
-
Inferring disease architecture and predictive ability with LDpred2-auto.Am J Hum Genet. 2023 Dec 7;110(12):2042-2055. doi: 10.1016/j.ajhg.2023.10.010. Epub 2023 Nov 8. Am J Hum Genet. 2023. PMID: 37944514 Free PMC article.
-
MESuSiE enables scalable and powerful multi-ancestry fine-mapping of causal variants in genome-wide association studies.Nat Genet. 2024 Jan;56(1):170-179. doi: 10.1038/s41588-023-01604-7. Epub 2024 Jan 2. Nat Genet. 2024. PMID: 38168930 Free PMC article.
-
Enrichment analyses identify shared associations for 25 quantitative traits in over 600,000 individuals from seven diverse ancestries.Am J Hum Genet. 2022 May 5;109(5):871-884. doi: 10.1016/j.ajhg.2022.03.005. Epub 2022 Mar 28. Am J Hum Genet. 2022. PMID: 35349783 Free PMC article.
-
Multiethnic polygenic risk prediction in diverse populations through transfer learning.Front Genet. 2022 Aug 19;13:906965. doi: 10.3389/fgene.2022.906965. eCollection 2022. Front Genet. 2022. PMID: 36061179 Free PMC article.
-
A Prism Vote method for individualized risk prediction of traits in genotype data of Multi-population.PLoS Genet. 2022 Oct 27;18(10):e1010443. doi: 10.1371/journal.pgen.1010443. eCollection 2022 Oct. PLoS Genet. 2022. PMID: 36302058 Free PMC article.
References
Publication types
MeSH terms
Grants and funding
LinkOut - more resources
Full Text Sources
Other Literature Sources
Research Materials
