. 2020 Jun 22;30(12):2275-2288.e5.
doi: 10.1016/j.cub.2020.04.038. Epub 2020 May 21.

A Circuit Encoding Absolute Cold Temperature in Drosophila

Affiliations

A Circuit Encoding Absolute Cold Temperature in Drosophila

Michael H Alpert et al. Curr Biol. .

Abstract

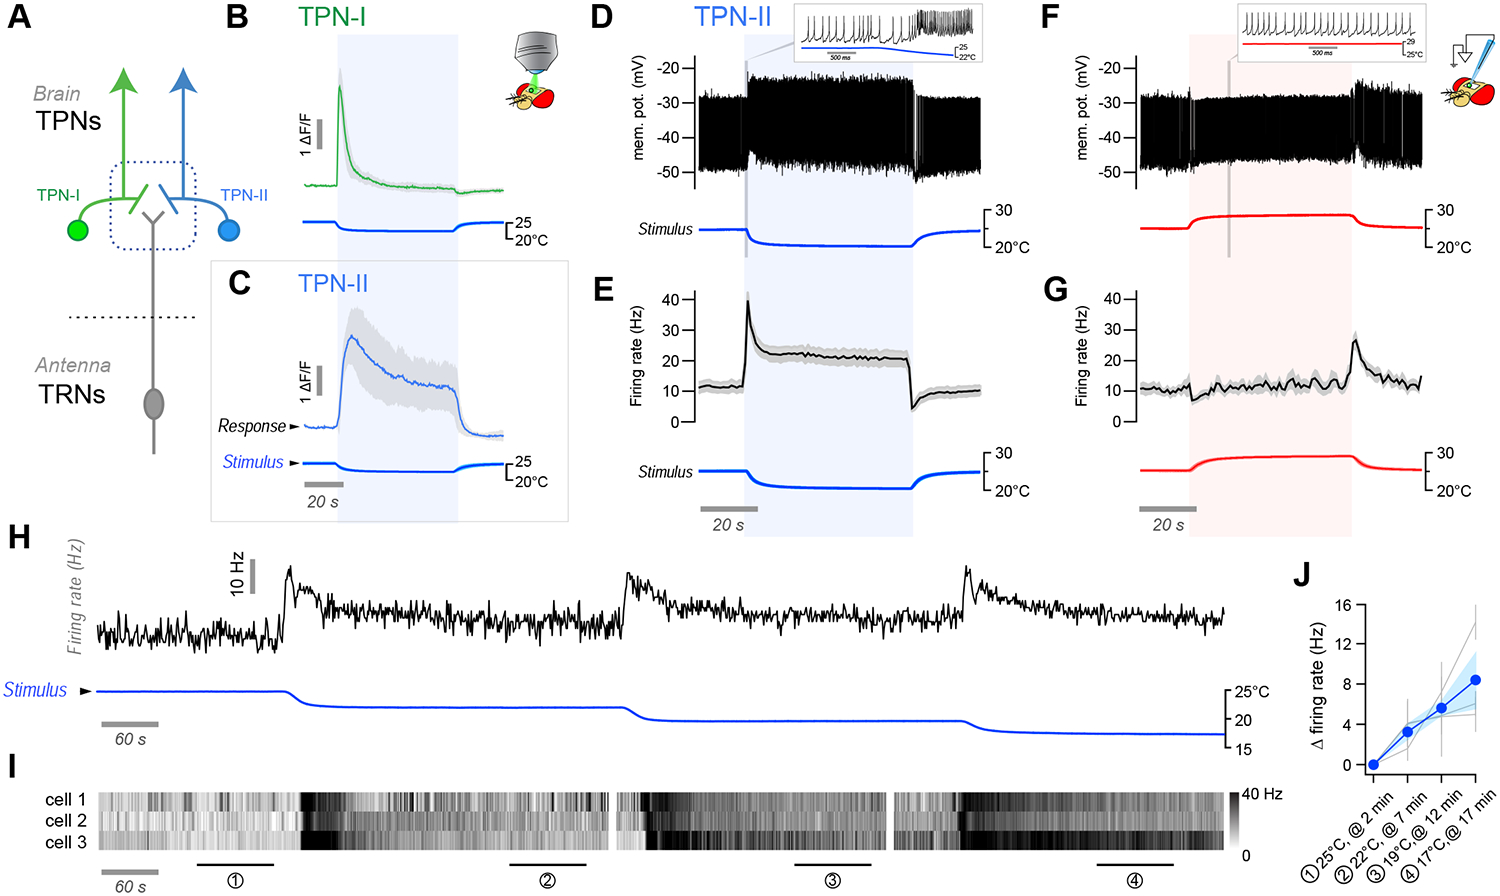
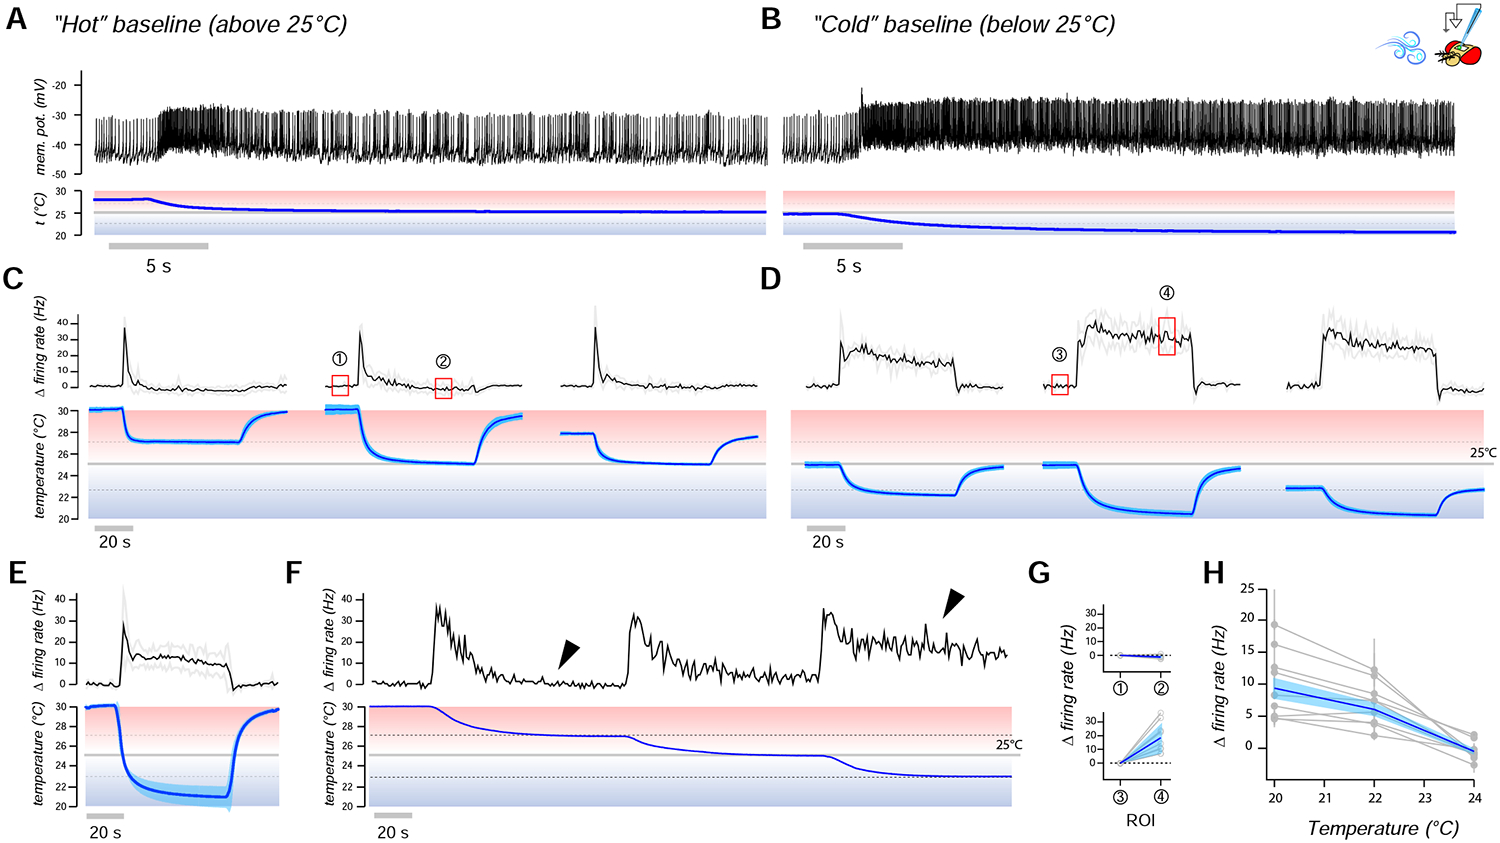
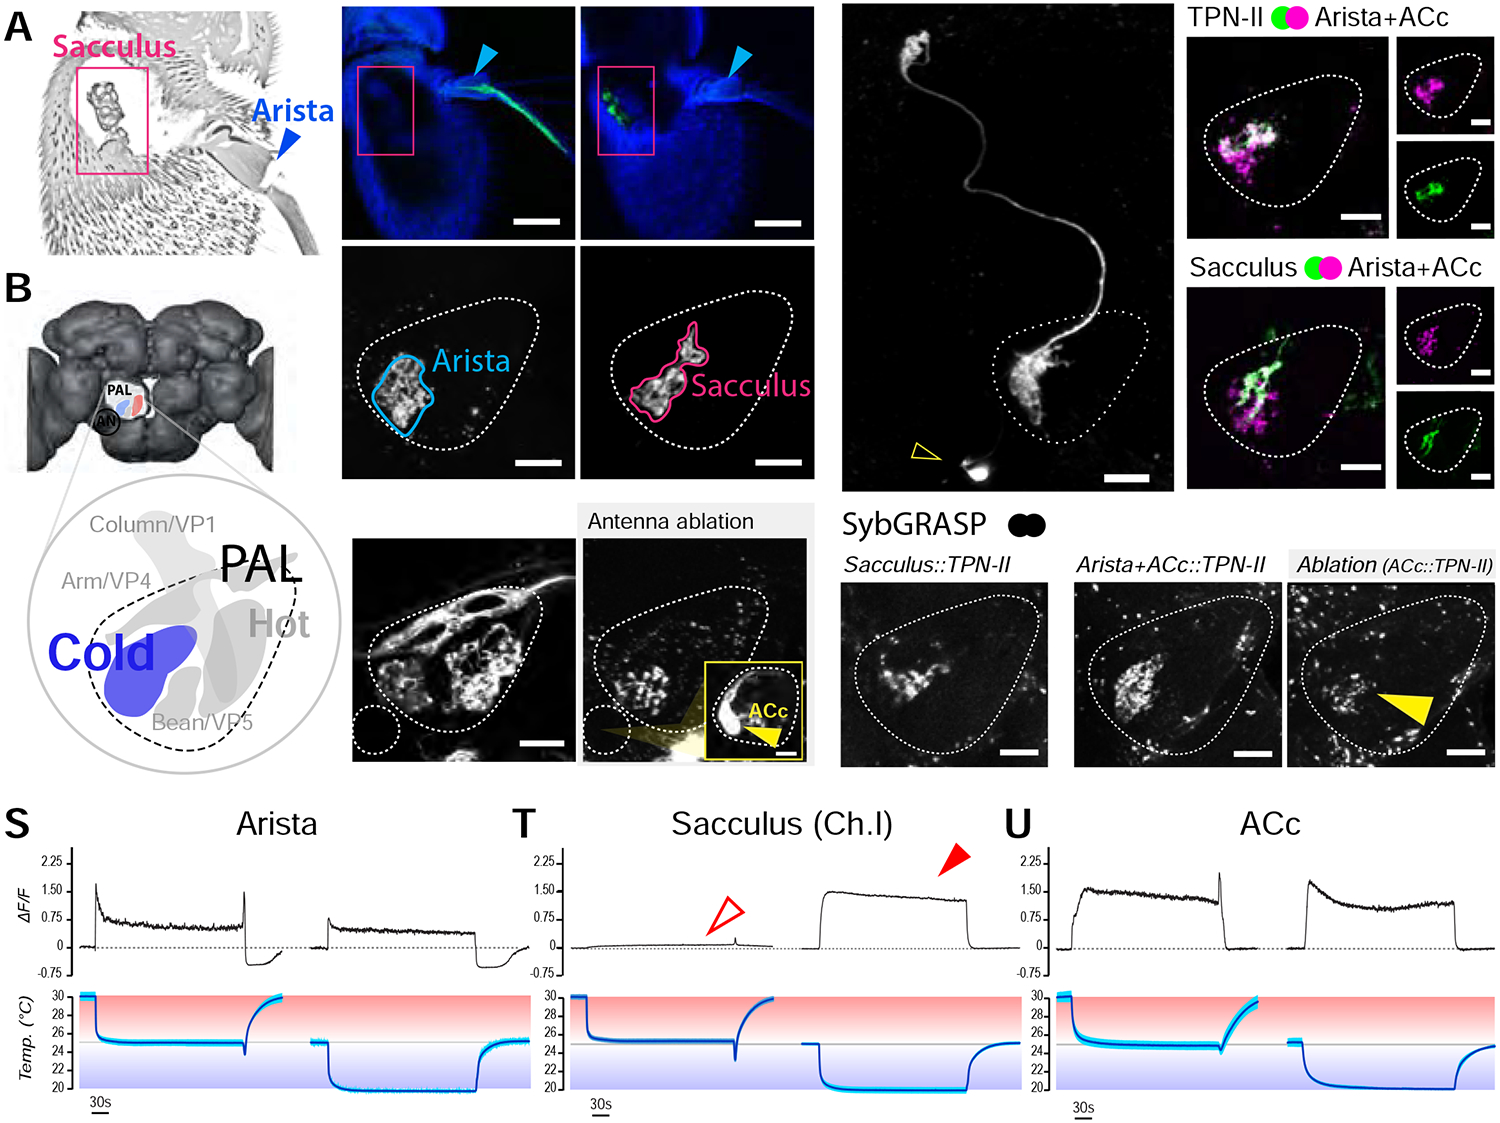
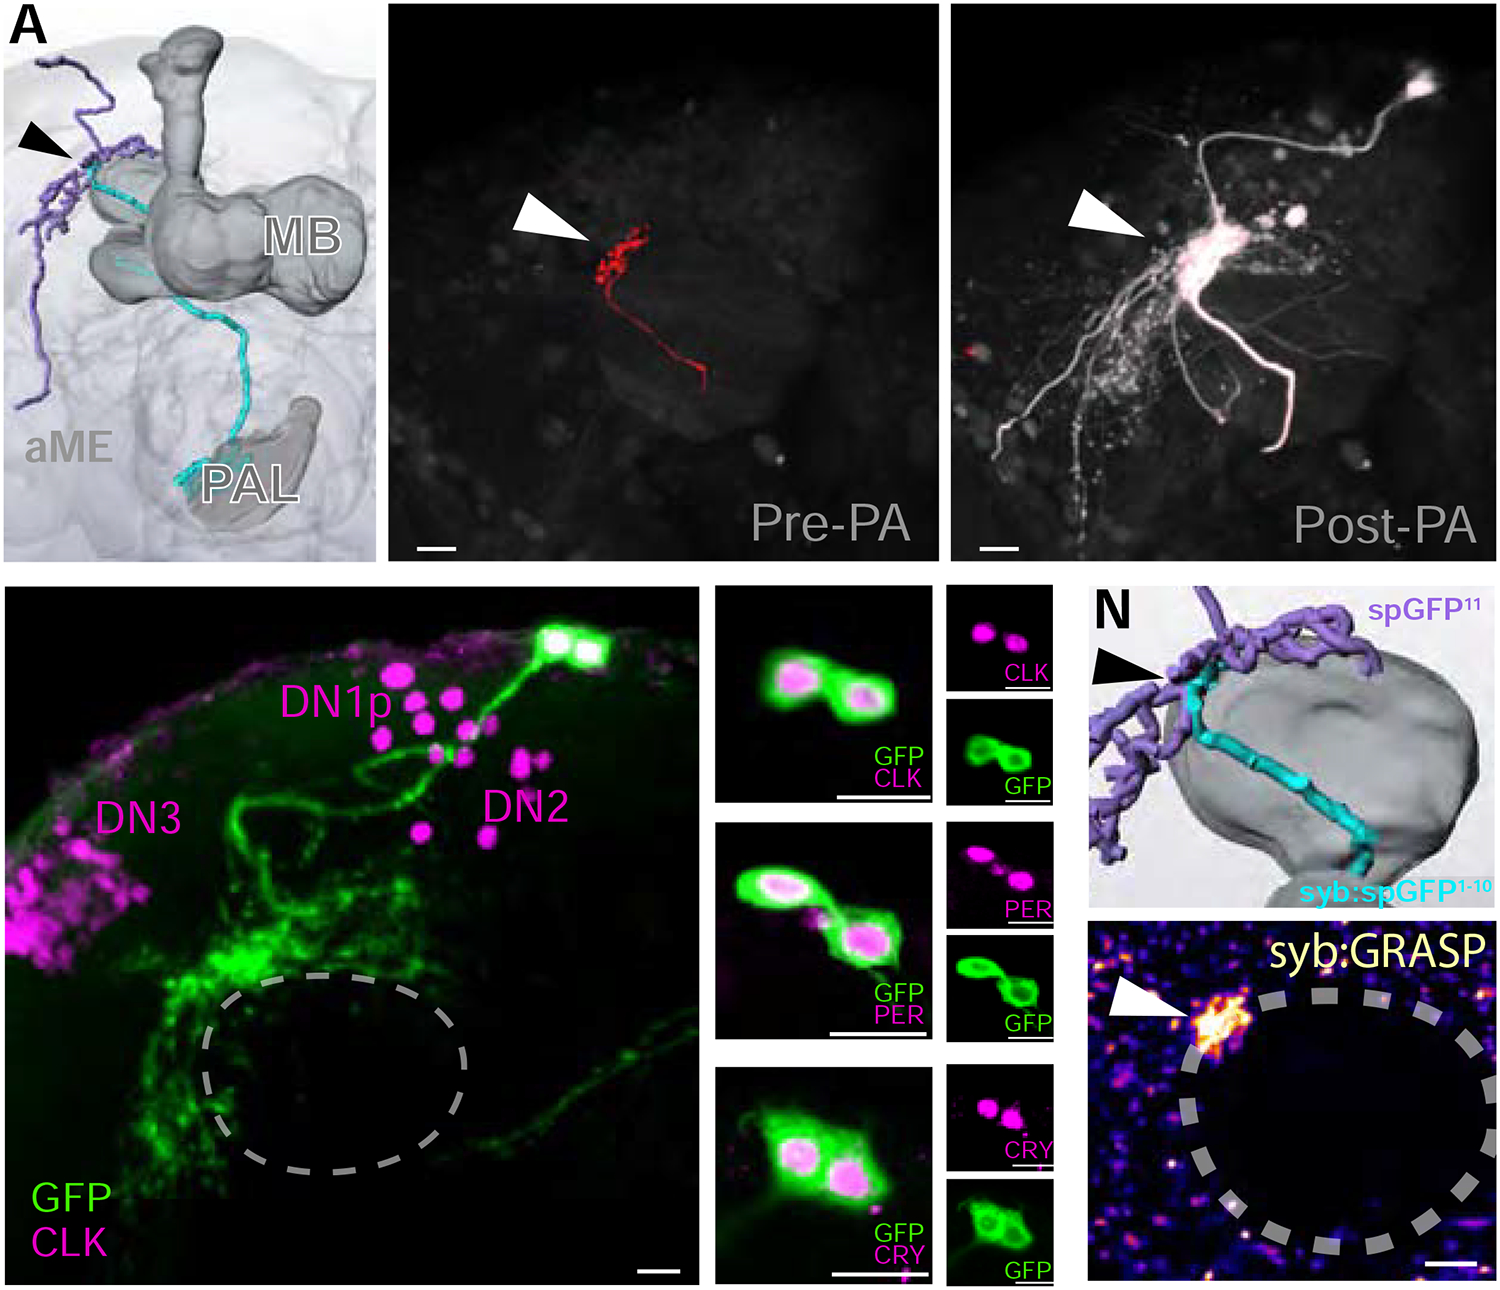
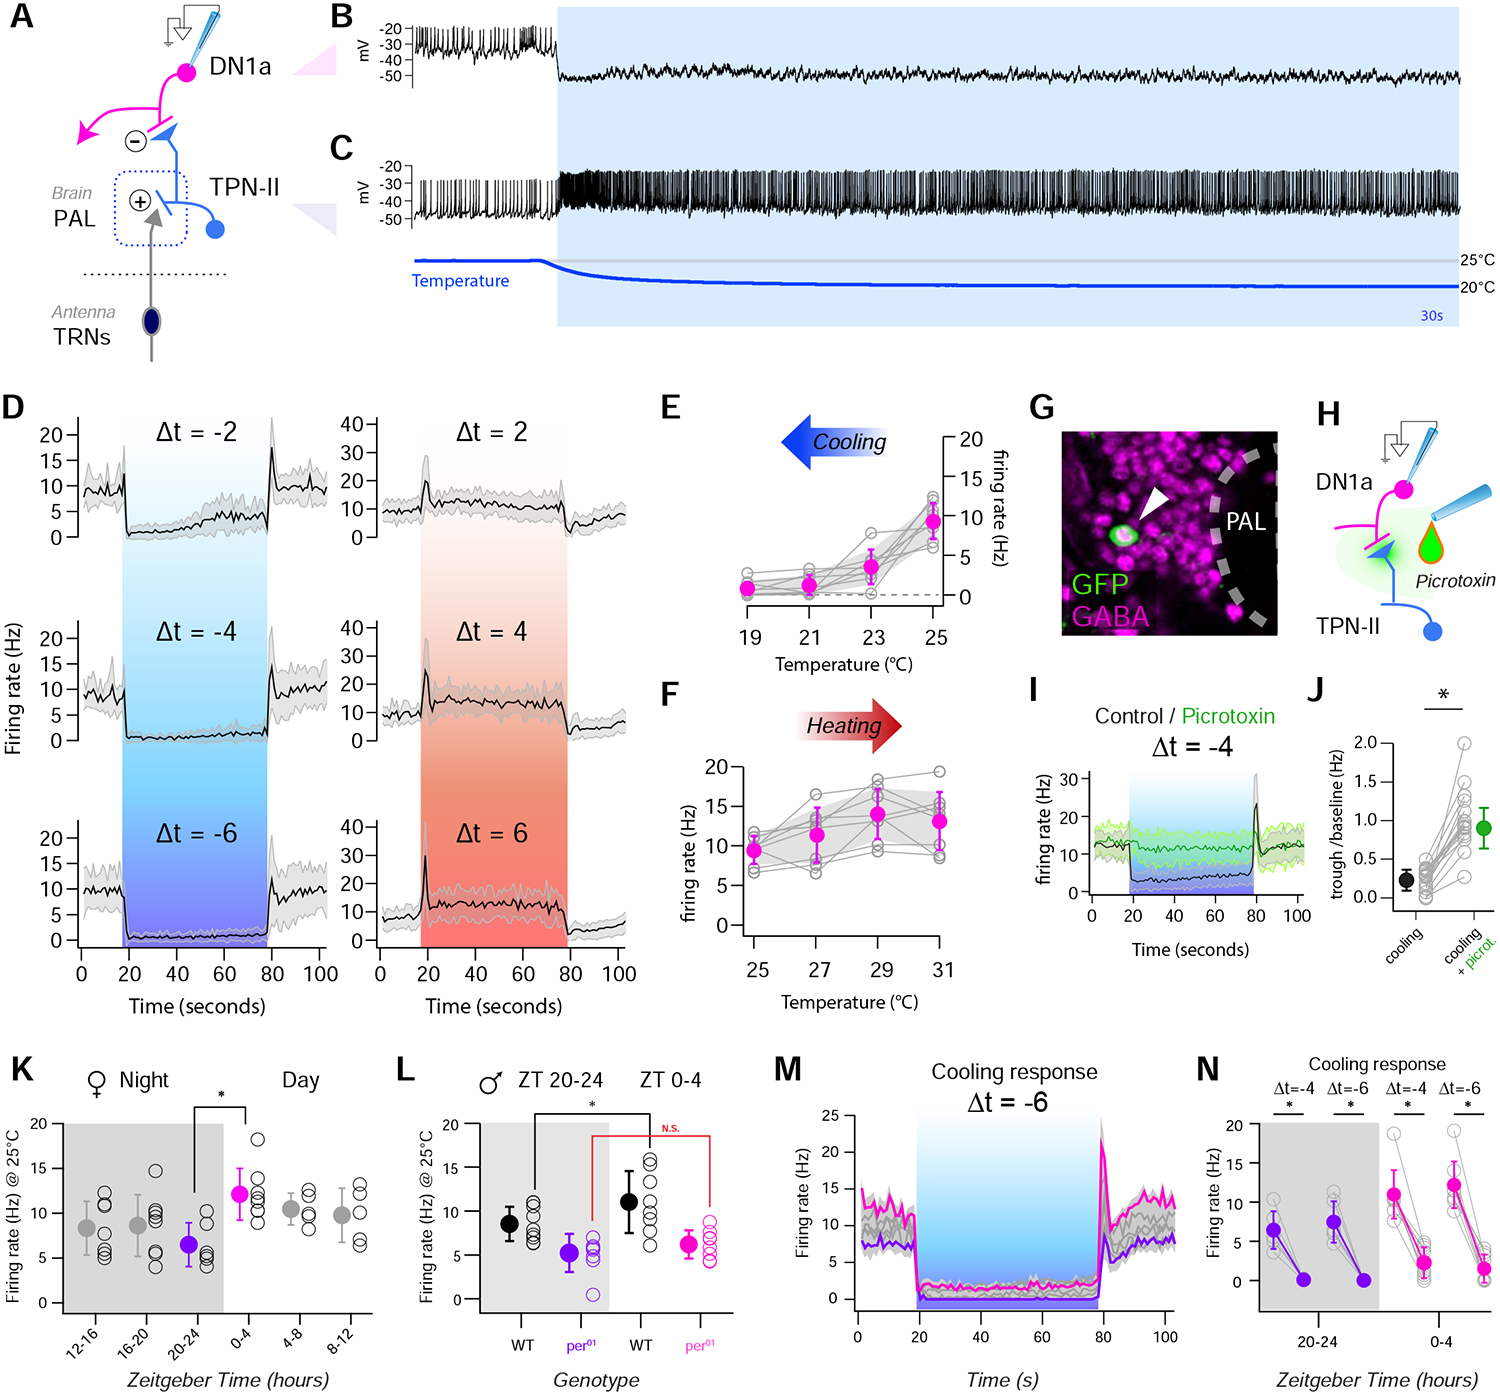
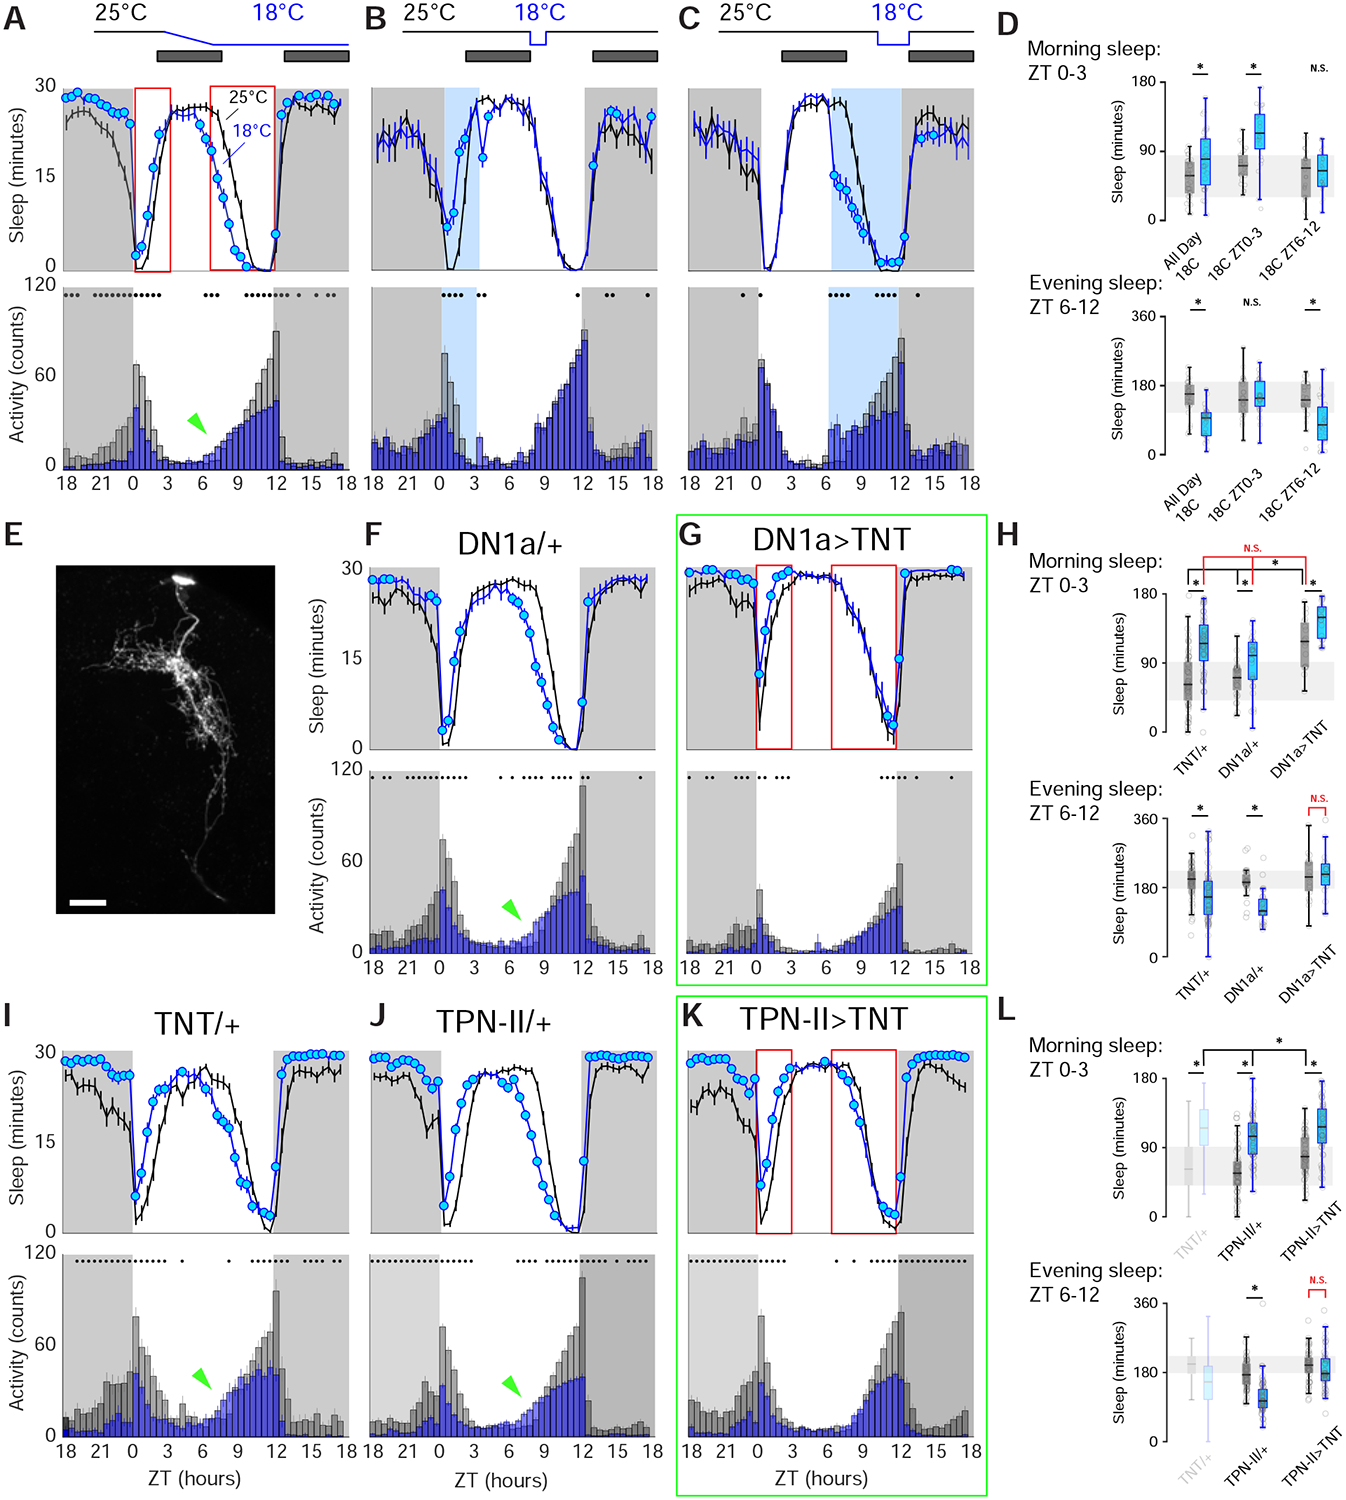
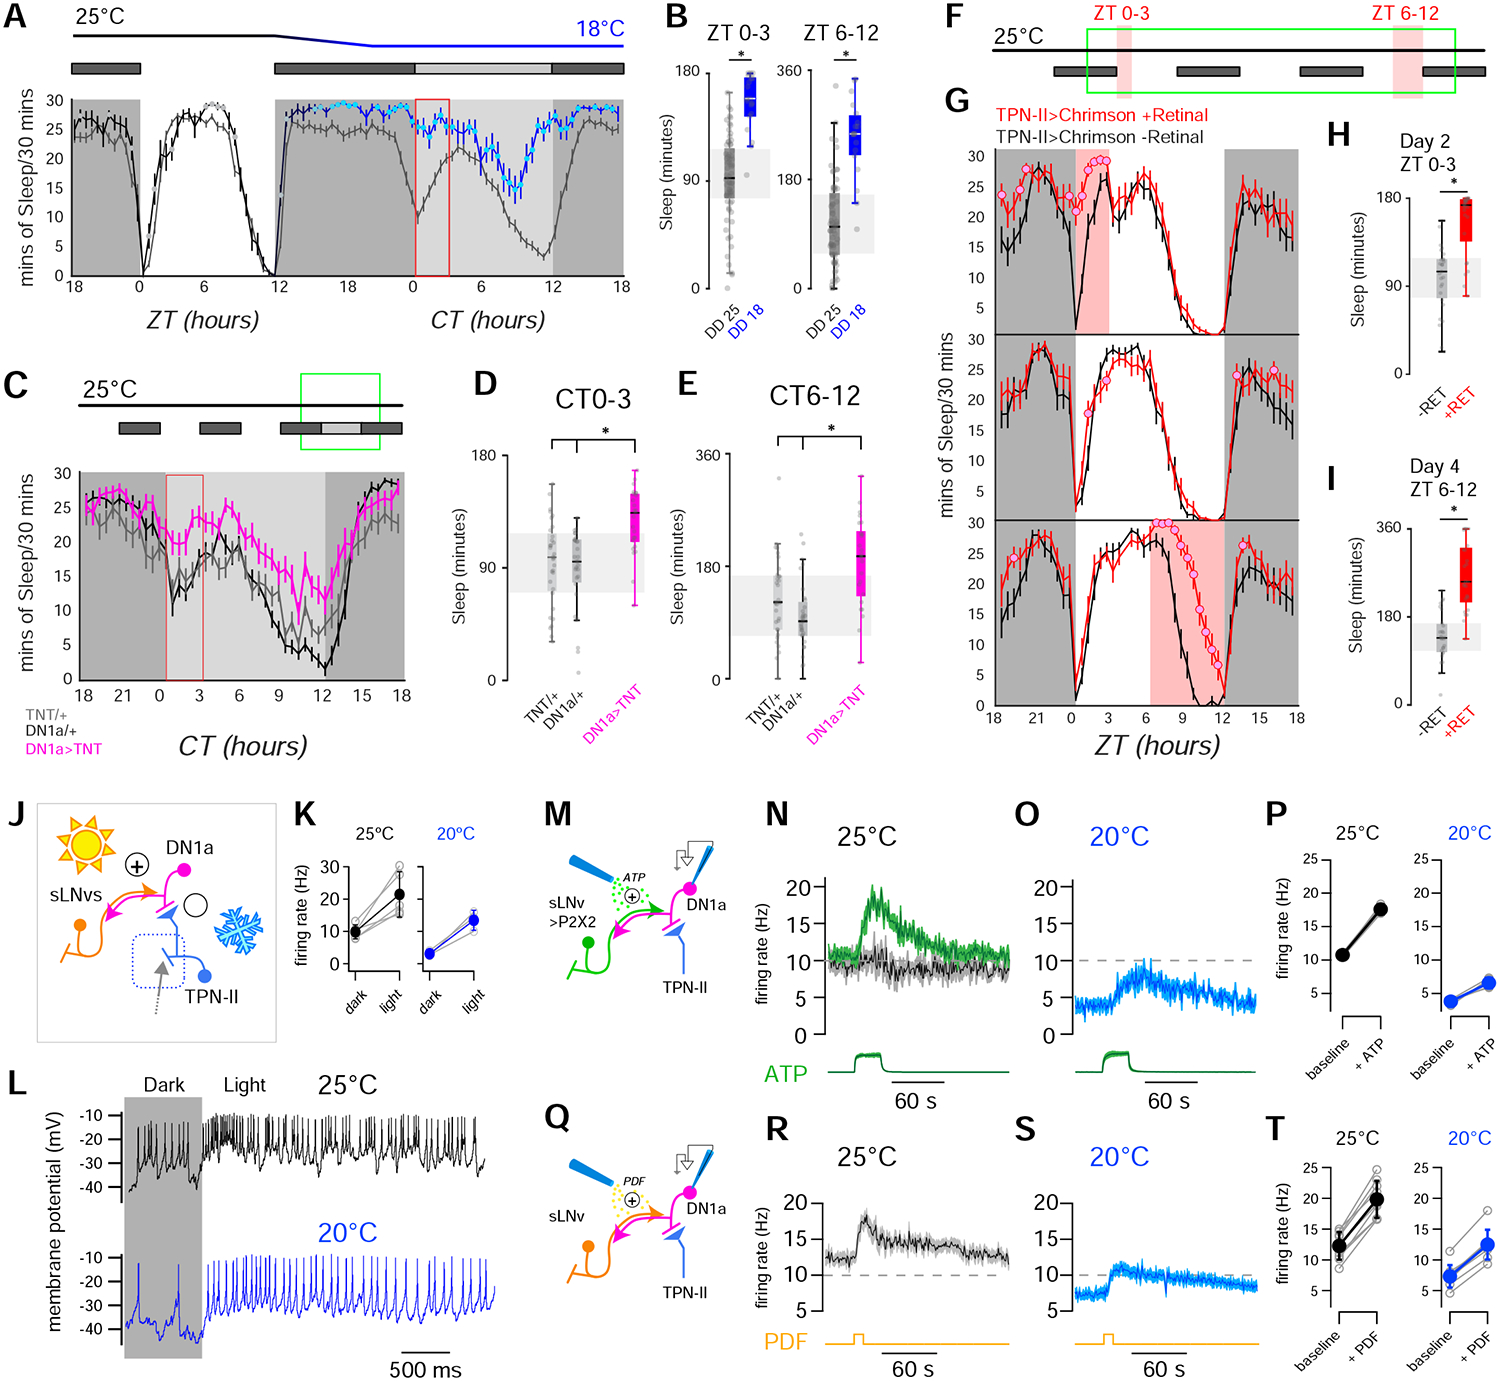
Animals react to environmental changes over timescales ranging from seconds to days and weeks. An important question is how sensory stimuli are parsed into neural signals operating over such diverse temporal scales. Here, we uncover a specialized circuit, from sensory neurons to higher brain centers, that processes information about long-lasting, absolute cold temperature in Drosophila. We identify second-order thermosensory projection neurons (TPN-IIs) exhibiting sustained firing that scales with absolute temperature. Strikingly, this activity only appears below the species-specific, preferred temperature for D. melanogaster (∼25°C). We trace the inputs and outputs of TPN-IIs and find that they are embedded in a cold "thermometer" circuit that provides powerful and persistent inhibition to brain centers involved in regulating sleep and activity. Our results demonstrate that the fly nervous system selectively encodes and relays absolute temperature information and illustrate a sensory mechanism that allows animals to adapt behavior specifically to cold conditions on the timescale of hours to days.

Keywords: Drosophila; antenna; brain; circuit; cold; seasonal; sleep; temperature; thermosensory.


Conflict of interest statement

Declaration of Interests The authors declare no competing interests.

Figures

FIGURE 1 |
FIGURE 1 |. Identification of thermosensory projection neurons characterized by non-adapting responses
(A) Thermosensory projection neurons (TPNs) receive synaptic input from antennal thermoreceptors (TRNs). (B,C) 2-photon calcium imaging with GCaMP demonstrates significant differences in the adaptation of (B) type-I fast-adapting and, (C) type-II slow/non-adapting TPNs to a cold temperature step (~1 minute; ΔF/F traces are averages of B: 14 cells/3 animals, C: 5 cells/3 animals, ±SD; stimulus trace is an average of the experiments ± SD). (D-G) 2-photon guided patch clamp electrophysiology reveals that TPN-IIs’ firing is indeed non-adapting. (D) Representative whole-cell current clamp recording from a TPN-II in response to a cold step (~5°C, 1 min.). Inset shows x-axis expansion during cooling. (E) Firing rate histogram for TPN-II’s responses to cold (9 animals/ 9 cells, 3 trials per cell were averaged in each experiment; N=9 cells ±SEM; temp. trace: av. of 9, ±SEM). (F,G) TPN-IIs’ are not significantly modulated by heat. (F) Representative whole-cell current clamp recording from a TPN-II in response to a hot step (~5°C, 1 min.). Inset shows x-axis expansion. (G) Firing rate histogram for TPN-II’s responses to hot (5 cells/4 animals, ±SEM; temp. trace av. of 5, ±SEM). (H-J) TPN-IIs firing does not return to baseline even for extended cooling steps. (H, top) representative recording from a TPN-II subjected to extended cooling steps. (I) Pseudo-colored spike rate histogram of 3 cells in response to a cooling stimulus similar to that in H (~20 minutes recordings, 3 Δt steps as in H, responses aligned to stimuli). (J) Quantification (gray lines = mean ± SD for individual cells calculated in regions corresponding numbered bars in I; blue line/shading = mean ± SEM firing rate across cells, same 3 cells as in I).
FIGURE 2 |
FIGURE 2 |. TPN-II neurons encode absolute temperature in the cold range
(A-F) Sustained firing of TPN-IIs depends on absolute temperature, rather than stimulus history. (A,B) Representative whole-cell current clamp recording from a TPN-II in response to a cold step starting from a baseline temperature (A) above or (B) below 25°C (see also Figure S1). (C,D) Firing rate histograms from TPN-II in response to cooling steps of different sizes (Δt) and settling on distinct absolute temperatures (C) above or (D) below 25°C (gray line), showing that persistent activity only appears in the cold range (below 25°C; 4 cells/4 animals, ±SD; temp. trace av. of 4, ±SD). (E) Sustained firing in response to a large stimulus starting at 30°C and settling to ~20°C (3 cells/3 animals, av. ±SD; temp. trace av. of 3, ±SD). (F) Representative response to a complex stimulus showing persistent firing below 25°C (gray line). (G) Quantification of firing rates corresponding to numbered ROIs in C and D (top: 10 cells/8 animals; bottom: 9 cells/9 animals). (H) Quantification of TPN-II firing rate changes at stable temperatures below 25°C (readings were taken after ~1 minute at each temp.; 9 cells/9 animals). In G and H responses from the same cell are connected, colored lines and shading are population averages ±SD (G) or ±SEM (H); gray dots in H are averages of 3 repeats/cell/condition ±SD; note that an f-test demonstrates a significant relationship between firing rates and temperature; p<0.05.
FIGURE 3 |
FIGURE 3 |. Three distinct populations of peripheral cold sensing neurons drive the activity of TPN-IIs
(A) Confocal micrograph of the fly antenna showing the location of the sacculus (pink box) and arista (blue arrow). (B) 3D model of the fly brain showing the location of the posterior antennal lobe (PAL) and PAL glomeruli (inset; the glomerulus innervated by cold cells is shown in blue, additional glomeruli are annotated with standard nomenclature). (C-H) Selective drivers identify distinct sensory neuron populations targeting the cold glomerulus. (C,D) A selective driver for arista cold cells labels (C) cell bodies in the arista and (D) their PAL termini. (E,F) A selective driver for cold cells of the sacculus labels (E) cell bodies innervating chamber I of the sacculus and (F) their termini in the PAL. (C,E are confocal micrographs of the whole antenna; blue: cuticle autofluorescence, green: GFP, scalebars 50μm; D,F are single 2-photon slices; scalebars 10μm). (G,H) Antenna ablation demonstrates the existence of an unusual “internal” cold receptor also innervating the PAL. (G) IR25a-Gal4>UAS-GFP labels many of the antennal sensory neurons innervating PAL glomeruli. (H) A week following antennal resection, all antennal afferents have degenerated, revealing Anterior Cold cell (ACc) termini in the PAL. The fluorescent signal can be traced to one/two cell bodies located on the edge of the antennal nerve (AN, inset –scalebar 10μm; see also Figure S2). (I-O) Extensive overlap between TPN-II dendrites with both arista/ACc and sacculus termini in the PAL. (I) A selective split-Gal4 driver reveals TPN-II’s anatomy (2-photon z-stack). (J-O) 2-color 2-photon micrograph illustrating spatial overlap between (J-L) TPN-II dendrites (green) and Arista/ACc termini (magenta, single z slice), and between (M-O) sacculus (green) and arista/ACc termini (magenta). (P-R) Synaptobrevin GRASP confirms synaptic connectivity between TPN-IIs and (P) sacculus, (Q) arista/ACc; the fact that the syb:GRASP signal in Q persists a week post-antenna ablation (R) shows ACc also connect to TPN-IIs. (S-U) 2-photon Ca2+ imaging shows sacculus neurons exclusively respond in the cold range. Response profiles of (S) arista, (T) chamber I sacculus, and (U) ACc neuron termini in response to cooling steps in the hot (bottom, above 25°C, red) or cold (bottom, below 25°C, blue) range. (S) Arista neurons show both a transient peak in response to cooling and a persistent Ca2+ elevation in both conditions. (T) Sacculus cold cells only respond when the temperature drops below 25°C (arrows). (U) ACc neurons show persistent signals both above and below 25°C. S-U show averages of 4 animals ±SD. In all PAL panels, scale bars are 10μm.
FIGURE 4 |
FIGURE 4 |. TPN-IIs target the DN1a group of dorsal neurons, part of the circadian clock network
(A) 3D reconstruction of the TPN-II (blue)-DN1a (purple) connection, at the edge of the mushroom body (MB) Calyx. (B-C) Photolabeling with PA-GFP reveals DN1as are candidate targets for TPN-IIs. For this experiment, (B, pre-photoactivation) TPN-II termini are targeted by independent labeling with TdTomato, while PA-GFP is expressed broadly. Following targeted photoactivation at 720 nm, (C, white) PA-GFP diffuses to label TPN-II targets. (D-M) DN1as are identifiable by anatomy, and because they express a combination of molecular clock components. Here, (D) DN1as were labeled by GFP expression (green, under the control of a selective driver) and immunostained using an anti-Clock antibody (CLK, purple; confocal z-stack of a whole-mount fly brain, note that CLK also labels DN1p, DN2, and DN3). (E-G) Enlargement of DN1as shown in D. (H-J) DN1as also express Period (anti-PER, purple) and (K-M) Cryptochrome (anti-CRY, purple; in all panels scalebar =10μm). (N-O) Syb:GRASP demonstrates monosynaptic connectivity between TPN-IIs and DN1as. (N) Enlargement of a 3D reconstruction showing predicted point of synaptic contact. (O) Synaptic GFP reconstitution is observed between TPN-II and DN1a neurons at the edge of the mushroom body calyx (pseudocolored 2-photon stack).
FIGURE 5 |
FIGURE 5 |. TPN-IIs robustly inhibit DN1a activity in cold conditions through GABA release
(A) Schematic representation of the circuit, including cold thermosensory neurons (TRNs, dark blue), TPN-IIs (light blue) and DN1as (pink). (B,C) DN1a firing is persistently silenced by cold, correlating with TPN-II activation. (B) Representative whole-cell current clamp recording from a DN1a neuron and (C) from a TPN-II in response to a cold step (recorded independently). (D) Average firing rate histograms for DN1as challenged with cooling steps of different amplitude show robust silencing even for small stimuli (blue boxes, Δt=−2, Δt=−4, Δt=−6; 8 cells/ 7 animals, av ±SD). Note that corresponding heating stimuli produce an initial burst in activity, but modest persistent modulation (red box, right, Δt=2, Δt=4, Δt=6; 9 cells/ 8 animals, av ±SD). (E,F) Quantification of firing rates at plateau for (E) cold and (F) hot steps as in D (gray lines connect responses from the same cell, colored dots = averages ±SD). (G) Whole-mount immunostaining showing that TPN-II (labeled by expression of GFP, white arrow) express the inhibitory neurotransmitter GABA (anti-GABA, pink). (H-J) GABA release mediates cold inhibition of DN1as. (H) Schematic of the experiment. (I) Average firing rate histograms of DN1a in response to a Δt~ −4°C cooling before (black) and after (green) application of the GABA receptor antagonist, picrotoxin (100 μM; 13 cells/13 animals, av ±SD), showing that GABA receptor blockade abolishes cold inhibition of DN1as. (J) Quantification of I as trough-to-baseline ratio of firing rate (in first 10s after cooling), before (black) and after application of picrotoxin (green). Gray circles connected by lines represent individual neurons; filled circles: population av. ± SD; * = p < 0.05 in a paired, 1-tailed t-test. (K) Baseline firing rates of DN1as at 25°C measured during different times of day (white) and night (gray). Firing rates from different cells (black circles) were grouped in 4hr bins (filled circles, mean ± SD). Morning rates (pink) were significantly higher than evening ones (purple; N=39 cells/32 animals; * p <0.05; unpaired 1-tailed t-test). (L) Circadian rhythms of DN1a firing are absent in per01 mutants. Nighttime and daytime firing rates of DN1as at 25°C recorded from WT (* p < 0.05, unpaired 1-tailed t-test) and period mutant flies (per01, NS= not significant difference, unpaired 1-tailed t-test; black circles are individual cells, filled circles indicate av ± SD; N=35 cells/21 animals, recordings are from +/Y and per01/Y male flies). (M,N) DN1as are inhibited by cooling at all ZTs. (M) Mean firing rate of DN1as in response to a cooling step (blue box, from 25°C; individual gray traces represent averages, ZTs as in L, ZT20–24 and ZT0–4 are colorized as in K; envelope: ± SEM, N=40 cells/32 animals). (N) Quantification of change in firing frequency in response to different cooling steps (from 25°C) during the night (ZT20–24, purple) and day (ZT0–4, pink; gray circles connected by lines indicated individual cells; filled circles indicate mean ± SD; *=p<0.05; paired 1-tailed t-test; 14 cells/10 animals; see also Figure S3).
FIGURE 6 |
FIGURE 6 |. Genetic silencing of either DN1a or TPN-II perturbs normal daytime sleep restructuring by cold
In wild type flies, cold temperature has both acute and persistent effects on daytime activity and sleep. In (A,F,G,I-K) activity and sleep were quantified in 30min bins in 2 consecutive days per condition (B,C: 1 day/condition). Schematics on top illustrate the experimental design. Data plots represent sleep (above) and activity bar graphs (below) and are averages ±SEM across days and across individual flies; filled circles in sleep plots and black dots above activity bars indicate time points that are significantly different between cold (18°C, blue) and 25°C (gray) conditions (p<0.05, paired 2-sided t-test); dark shades indicate lights-off (night), ZT: zeitgeber time. (A) In wild-type animals, cold conditions increase morning sleep and suppresses morning activity (ZT0–3); in contrast, cold reduces both sleep and activity in the evening (ZT6–12); moreover, the onset of evening sleep is advanced (green arrowhead in A). As a result, the net effect of cold is an advancement of daytime sleep. (B) Morning cold (ZT0–3) rapidly suppresses activity and increases sleep; following the return to 25°C sleep and activity quickly return to normal levels. (C) Evening cold (ZT6–12) decreases sleep, so that, together, morning and evening effects recapitulate all day cold conditions (N=31 animals in A, 26 in B,C, and see D for quantifications). (E) A split-Gal4 driver allows selective targeting of DN1as (shown driving GFP; 2-photon z-stack, scale bar =20μm). (F-L) Silencing DN1as or TPN-IIs using selective split-Gal4s perturbs sleep restructuring by cold temperature. (F,I,J) Control genotypes. (N=30 in F, N=61 in I, N=62 in J). (G) Silencing DN1as by expression of tetanus toxin light chain (TNT) partially mimics cold conditions, producing flies that sleep more in the morning even at 25°C, and that fail to restructure their afternoon sleep in response to cold; (N=19 animals). (K) Silencing TPN-II output with TNT also produces flies that fail to restructure afternoon sleep in response to cold (N=52 animals; see H, L for quantifications; In all boxplots, box edges: 25th and 75th percentiles; thick lines: median; whiskers: data range; gray dots: individual data points/flies; *=p<0.05 in paired 2-sided t-test comparing 25°C vs 18°C within genotype or 2-way ANOVAs with a Bonferroni correction for multiple comparisons across genotypes/temperatures; NS= no significant difference).
FIGURE 7 |
FIGURE 7 |. Sleep and DN1a activity are modulated by the opposing pushes of light and cold temperature
(A,B) Cold and dark synergize to increase sleep across the day. (A, top) Behavioral protocol used to evaluate sleep on flies entrained in 12hrs Light-Dark (LD) cycles (white box: day (lights on), black box: night (lights off); gray box: subjective day (lights off)). (A, bottom) Sleep plot for two independent groups of control (wild type) flies during a single LD day at 25°C and in the following dark day at either 18°C (blue line N=19 animals, ± SEM) or 25°C (gray line; N=19 animals, ± SEM; filled circles indicate time points that are significantly different between conditions; p<0.05, unpaired 2-sided t-test). (B) Quantification of total sleep in the indicated intervals (box edges: 25th and 75th percentiles; thick lines: median; whiskers: data range; gray dots: individual datapoints/flies; *=p<0.05 in unpaired 2-sided t-test). (C-E) In the dark, suppressing DN1a output by TNT expression mimics cold conditions, increasing sleep across the day. (C, top) Behavioral protocol. (C, bottom) Sleep in DN1a>TNT flies (orange trace; N=25 animals), UAS-TNT/+ (gray; N=32 animals) and DN1a-Gal4/+ flies (black; N=31 animals, all traces are: AV± SEM, circles= significantly different from both controls in 2-way ANOVA, p<0.05). (D,E) Quantification of total sleep in the indicated intervals for genotypes in C (box edges: 25th and 75th percentiles; thick lines: median; whiskers: data range; gray dots: individual data points/flies; *= p<0.05, 2-way ANOVA with a Bonferroni correction for multiple comparisons across genotypes). (F-I) Optogenetic activation of TPN-II produces an acute increase in sleep. (F) Protocol used (3 consecutive days represented top to bottom), red shading indicates optogenetic activation. (G) Sleep pattern of TPN-II>Chrimson flies fed all-trans retinal (red trace; 25 animals) or control food (black; 27 animals -note that retinal is essential for Chrimson function; traces: AV± SEM, circles= significantly different from controls in 2-sided t-tests, p<0.05). (H, I) Quantification of total sleep in the indicated intervals (H) ZT0–3 on day 2, and (I) ZT6–12 on day 4 (box edges: 25th and 75th percentiles; thick lines: median; whiskers: data range; gray dots: individual data points (flies); *=p<0.05, unpaired, 2-sided t-test). (J) Circuit schematic including TPN-IIs (light blue), DN1as (pink) and sLNvs (orange). (K,L) DN1as are excited by light. (K) Light produces robust increases in firing rate at 25°C (black) and at 20°C (blue; gray circles connected by lines represent individual cells; filled circles are av ± SD, * p < 0.05, paired 1-tailed t-test). (L) Representative whole-cell recordings from a single DN1a neuron before and during light stimulation (yellow box), at 25°C (black) or 20°C (blue). (M-P) Artificial activation of sLNvs drives fire rate increases in DN1a and can overcome cold inhibition. (M) Experiment schematic. sLNvs express the exogenous ATP receptor P2X2 and can be activated by pressure ejection of ATP (20mM, green), while patch-clamp records activity in DN1a (pink). (N) ATP (20 mM, green) can drive an increase in DN1a firing at 25°C in animals in which sLNvs express P2X2 (green trace, 4 cells/animals), but not in control animals (driver without the receptor, gray/black trace; 6 cells/ 4 animals). (O) ATP can also overcome cold inhibition of DN1as (4 cells/4 animals av ± SEM; the green trace at the bottom of N and O is Alexa594 fluorescence, a dye included as a marker in the ATP solution, arbitrary fluorescence units ± SEM). (P) Quantification of N and O (gray circles connected by lines represent individual cells; filled circles are av ± SD, * p < 0.05, paired 1-tailed t-test). (Q-T) The neuropeptide PDF can increase DN1a firing to overcome inhibition in the cold. (Q) Experiment schematic. PDF is pressure ejected (50μM, yellow), while patch-clamp records activity in DN1a (pink). (R-T) PDF can drive an increase in DN1a firing both at (R) 25°C or (S) 20°C (9 cells/6 animals av ± SD; the yellow line at the bottom of R and S represent the approximate time of the PDF puff). (T) Quantification of R and S (gray circles connected by lines represent individual cells; filled circles are av ± SD, * p < 0.05, paired 1-tailed t-test; all experiments were done at ZT 0–8).

Comment in

References

    1. (1842). Handworterbuch der Physiologie: 1, (Friedrich Vieweg und Sohn; ).
    1. Hensel H, and Zotterman Y (1951). The persisting cold sensation. Acta Physiol Scand 22, 106–113. - PubMed
    1. Hensel H (1974). Thermoreceptors. Annual Review of Physiology 36, 233–249. - PubMed
    1. Yarmolinsky DA, Peng Y, Pogorzala LA, Rutlin M, Hoon MA, and Zuker CS (2016). Coding and Plasticity in the Mammalian Thermosensory System. Neuron 92, 1079–1092. - PMC - PubMed
    1. Ran C, Hoon MA, and Chen X (2016). The coding of cutaneous temperature in the spinal cord. Nat Neurosci 19, 1201–1209. - PMC - PubMed

Publication types

LinkOut - more resources