Identification of crucial genes correlated with esophageal cancer by integrated high-throughput data analysis
- PMID: 32443386
- PMCID: PMC7254712
- DOI: 10.1097/MD.0000000000020340
Identification of crucial genes correlated with esophageal cancer by integrated high-throughput data analysis
Abstract
Background: Esophageal cancer (ESCA) is one of the most deadly malignancies in the world. Although the management and treatment of patients with ESCA have improved, the overall 5-year survival rate is still very poor.
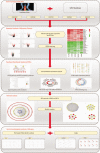
Methods: The study aimed to identify potential key genes associated with the pathogenesis and prognosis of ESCA. In the study, integrated bioinformatics methods were used to screen differentially expressed genes (DEGs) between ESCA and normal tissue in the data set of gene expression profiles. The hub gene in DEGs was further analyzed by protein-protein interaction (PPI) network and survival analysis to explore its relationship with the pathogenesis and poor prognosis of ESCA.
Results: 134 up-regulated genes and 183 down-regulated genes were obtained in ESCA compared with normal tissues. Moreover, the PPI network was established with 176 nodes and 800 interactions. Ten hub genes (AURKA, CDC20, BUB1, TOP2A, ASPM, DLGAP5, TPX2, CENPF, UBE2C, and NEK2) were filtered out based on the degree value. Functional enrichment analysis indicated that a variety of extracellular related items and ECM-receptor interaction pathway were all correlated with the ESCA.
Conclusions: The results of this study would provide some guidance for further study of diagnostic and prognostic biomarkers to promote ESCA treatment.
Conflict of interest statement
The authors have no conflicts of interest to disclose.
Figures


Similar articles
-
[Auxiliary diagnosis and prognosis evaluation of KIF4A, RAD51AP1 and CDKN3 in esophageal cancer].Zhonghua Yu Fang Yi Xue Za Zhi. 2024 May 6;58(5):665-672. doi: 10.3760/cma.j.cn112150-20230717-00008. Zhonghua Yu Fang Yi Xue Za Zhi. 2024. PMID: 38715507 Chinese.
-
Integrative bioinformatics analysis of high-throughput sequencing and in vitro functional analysis leads to uncovering key hub genes in esophageal squamous cell carcinoma.Hereditas. 2025 Mar 14;162(1):38. doi: 10.1186/s41065-025-00398-4. Hereditas. 2025. PMID: 40087784 Free PMC article.
-
Identification and Integrated Analysis of Key Biomarkers for Diagnosis and Prognosis of Non-Small Cell Lung Cancer.Med Sci Monit. 2019 Dec 5;25:9280-9289. doi: 10.12659/MSM.918620. Med Sci Monit. 2019. PMID: 31805030 Free PMC article.
-
Identification of Prognostic Related Genes of Tumor Microenvironment Derived From Esophageal Cancer Patients.Pathol Oncol Res. 2021 Apr 1;27:589662. doi: 10.3389/pore.2021.589662. eCollection 2021. Pathol Oncol Res. 2021. PMID: 34257539 Free PMC article.
-
Familial Esophageal Cancer in Taihang Mountain, China: An Era of Personalized Medicine Based on Family and Population Perspective.Cell Transplant. 2022 Jan-Dec;31:9636897221129174. doi: 10.1177/09636897221129174. Cell Transplant. 2022. PMID: 36300368 Free PMC article. Review.
Cited by
-
Single-cell transcriptome profiling reveals intratumoural heterogeneity and malignant progression in retinoblastoma.Cell Death Dis. 2021 Nov 23;12(12):1100. doi: 10.1038/s41419-021-04390-4. Cell Death Dis. 2021. PMID: 34815392 Free PMC article.
-
Immune cell related signature predicts prognosis in esophageal squamous cell carcinoma based on single-cell and bulk-RNA sequencing.Front Oncol. 2024 Jun 6;14:1370801. doi: 10.3389/fonc.2024.1370801. eCollection 2024. Front Oncol. 2024. PMID: 38903709 Free PMC article.
-
Inhibitory Effects of Rabdosia rubescens in Esophageal Squamous Cell Carcinoma: Network Pharmacology and Experimental Validation.Evid Based Complement Alternat Med. 2022 Nov 10;2022:2696347. doi: 10.1155/2022/2696347. eCollection 2022. Evid Based Complement Alternat Med. 2022. PMID: 36408344 Free PMC article.
-
Identification of Key Genes Associated With the Process of Hepatitis B Inflammation and Cancer Transformation by Integrated Bioinformatics Analysis.Front Genet. 2021 Sep 1;12:654517. doi: 10.3389/fgene.2021.654517. eCollection 2021. Front Genet. 2021. PMID: 34539726 Free PMC article.
-
Identification of miRNAs and genes for predicting Barrett's esophagus progressing to esophageal adenocarcinoma using miRNA-mRNA integrated analysis.PLoS One. 2021 Nov 24;16(11):e0260353. doi: 10.1371/journal.pone.0260353. eCollection 2021. PLoS One. 2021. PMID: 34818353 Free PMC article.
References
-
- Bray F, Ferlay J, Soerjomataram I, et al. Global cancer statistics 2018: GLOBOCAN estimates of incidence and mortality worldwide for 36 cancers in 185 countries. CA Cancer J Clin 2018;68:394–424. - PubMed
-
- Torre LA, Bray F, Siegel RL, et al. Global cancer statistics, 2012. CA Cancer J Clin 2015;65:87–108. - PubMed
-
- Arnold M, Laversanne M, Brown LM, et al. Predicting the future burden of esophageal cancer by histological subtype: international trends in incidence up to 2030. Am J Gastroenterol 2017;112:1247–55. - PubMed
-
- Toh Y, Oki E, Ohgaki K, et al. Alcohol drinking, cigarette smoking, and the development of squamous cell carcinoma of the esophagus: molecular mechanisms of carcinogenesis. Int J Clin Oncol 2010;15:135–44. - PubMed
MeSH terms
Substances
LinkOut - more resources
Full Text Sources
Medical
Research Materials
Miscellaneous

