. 2020 May 18;10(5):317.
doi: 10.3390/diagnostics10050317.

Clustering and Kernel Density Estimation for Assessment of Measurable Residual Disease by Flow Cytometry

Affiliations

Clustering and Kernel Density Estimation for Assessment of Measurable Residual Disease by Flow Cytometry

Hugues Jacqmin et al. Diagnostics (Basel). .

Abstract

Standardization, data mining techniques, and comparison to normality are changing the landscape of multiparameter flow cytometry in clinical hematology. On the basis of these principles, a strategy was developed for measurable residual disease (MRD) assessment. Herein, suspicious cell clusters are first identified at diagnosis using a clustering algorithm. Subsequently, automated multidimensional spaces, named "Clouds", are created around these clusters on the basis of density calculations. This step identifies the immunophenotypic pattern of the suspicious cell clusters. Thereafter, using reference samples, the "Abnormality Ratio" (AR) of each Cloud is calculated, and major malignant Clouds are retained, known as "Leukemic Clouds" (L-Clouds). In follow-up samples, MRD is identified when more cells fall into a patient's L-Cloud compared to reference samples (AR concept). This workflow was applied on simulated data and real-life leukemia flow cytometry data. On simulated data, strong patient-dependent positive correlation (R2 = 1) was observed between the AR and spiked-in leukemia cells. On real patient data, AR kinetics was in line with the clinical evolution for five out of six patients. In conclusion, we present a convenient flow cytometry data analysis approach for the follow-up of hematological malignancies. Further evaluation and validation on more patient samples and different flow cytometry panels is required before implementation in clinical practice.

Keywords: acute myeloid leukemia (AML); clustering; flow cytometry; kernel density estimation; multiparametric data analysis; personalized medicine.


Conflict of interest statement

The authors declare no conflict of interest.

Figures
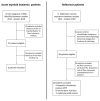
Figure 1
Figure 1
Flow diagram of acute myeloid leukemia patients and reference patients.
Figure 2
Figure 2
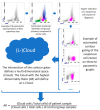
The principle of the “Cloud”, “L-Cloud”, and “Abnormality Ratio” concepts; AR: Abnormality Ratio. Infinicyt software (Cytognos, Salamanca, Spain) was used for flow cytometry data representation, automated clustering (k-nearest neighbor-based clustering), and automated contour gating (two-dimensional kernel density estimation).
Figure 3
Figure 3
Influence of the parameters on the sensitivity and specificity of each patient-specific L-Cloud. The abscissa (1-specificty %) indicates the false positive rate of the L-Cloud (%); the ordinate indicates the L-Cloud sensitivity (%). Using Infinicyt software and patient-specific L-Clouds, established on the basis of 104 cells from the major malignant cell cluster of six AML patients at diagnosis (patients 1–6), a forward selection based on the L-Cloud specificity (using a mixture 1 × 10⁶ of normal cells from reference samples) was performed for each patient (1–6). In a first step, the FSC-A and SSC-A parameters were selected. In the following steps, the other parameters were introduced one at a time. At each step, the improvement in specificity was determined for each remaining parameter and the one with the highest improvement was added. The process was repeated until all parameters were introduced. The L-Cloud represents a model describing a multidimensional space where malignant cells are found. This region is patient-specific and is established following a well-defined algorithm at diagnosis (see Section 2.2). The L-Cloud sensitivity is defined by the number of cells from the “L-Cloud cell cluster” falling into the L-Cloud divided by the number of cells contained into this same cluster (= 104 cells) as a percentage. The L-Cloud specificity is defined by the number of cells of the control group falling outside the L-Cloud divided by the number of cells of the control group analyzed (= 106 cells) as a percentage.
Figure 4
Figure 4
Comparison of the Abnormality Ratio (AR) with morphology and molecular biology results over time for six acute myeloid leukemia patients. Graphics: abscissa = time (DD/MM/YY); ordinate = AR; ASCT: allogeneic stem cell transplantation; induction: induction therapy; consolidation: consolidation therapy; Blasts%: percentage of blast cells among nucleated cells established on morphological basis on bone marrow aspirate; Morphology: bone marrow aspiration conclusion based on morphological results; Mol. Biol.: bone marrow aspirate molecular biology results (follow-up columns) based on mutations at diagnosis (diagnosis column). The presence of MLL at follow-up was evaluated by RT-PCR, with a limit of detection (LOD) of 5%. The presence of CEBPA mutation at follow-up results was evaluated by PCR, followed by Sanger sequencing, with a LOD of 10%. The presence of NPM1 at follow-up was evaluated by RT-PCR with a limit of detection of 1:10,000 cells. NPM1 results are expressed in terms of percentage ratio (NPM1/ABL1); the presence of WT1 expression at follow-up was evaluated by RT-PCR (+ = WT1 overexpression; − = no WT1 overexpression). RT-PCR: reverse transcriptase–polymerase chain reaction; NPM1: nucleophosmin 1; MLL: partial tandem duplication of KMT2A gene; CEBPA: CCAAT enhancer binding protein alpha gene; WT1: Wilm’s tumor 1 gene; AR: Abnormality Ratio. AR1 and AR2 for patient 2 were defined because two cell clusters of at least 5 × 10³ cells had an AR > 1000 at diagnosis (two different L-Clouds).

Similar articles

Cited by

References

    1. Adan A., Alizada G., Kiraz Y., Baran Y., Nalbant A. Flow cytometry: Basic principles and applications. Crit. Rev. Biotechnol. 2016;37:1–14. doi: 10.3109/07388551.2015.1128876. - DOI - PubMed
    1. Da Costa E.S., Pedreira C.E., Barrena S., Lécrevisse Q., Flores-Montero J., Quijano S., Almeida J., Macias M.D.C.G., Böttcher S., Van Dongen J.J., et al. Automated pattern-guided principal component analysis vs expert-based immunophenotypic classification of B-cell chronic lymphoproliferative disorders: A step forward in the standardization of clinical immunophenotyping. Leukemia. 2010;24:1927–1933. doi: 10.1038/leu.2010.160. - DOI - PMC - PubMed
    1. Kalina T., Flores-Montero J., Van Der Velden V.H.J., Martín-Ayuso M., Böttcher S., Ritgen M., Almeida J., Lhermitte L., Asnafi V., Mendonça A., et al. EuroFlow standardization of flow cytometer instrument settings and immunophenotyping protocols. Leukemia. 2012;26:1986–2010. doi: 10.1038/leu.2012.122. - DOI - PMC - PubMed
    1. Johansson U., Bloxham D., Couzens S., Jesson J., Morilla R., Erber W., Macey M. British Committee for Standards in Haematology Guidelines on the use of multicolour flow cytometry in the diagnosis of haematological neoplasms. Br. J. Haematol. 2014;165:455–488. doi: 10.1111/bjh.12789. - DOI - PubMed
    1. Lacombe F., Dupont B., Lechevalier N., Vial J.-P., Pigneux A., Bene M.C. New Concepts of Flow Cytometry Analysis in Oncohematology: Application to Diagnosis and Follow up (Minimal Residual Disease) in AML, ALL and MDS. Blood. 2017;130(Suppl. 1)