. 2020 May 18;21(10):3575.
doi: 10.3390/ijms21103575.

Antioxidant and Neuroprotective Effects Induced by Cannabidiol and Cannabigerol in Rat CTX-TNA2 Astrocytes and Isolated Cortexes

Affiliations

Antioxidant and Neuroprotective Effects Induced by Cannabidiol and Cannabigerol in Rat CTX-TNA2 Astrocytes and Isolated Cortexes

Viviana di Giacomo et al. Int J Mol Sci. .

Abstract

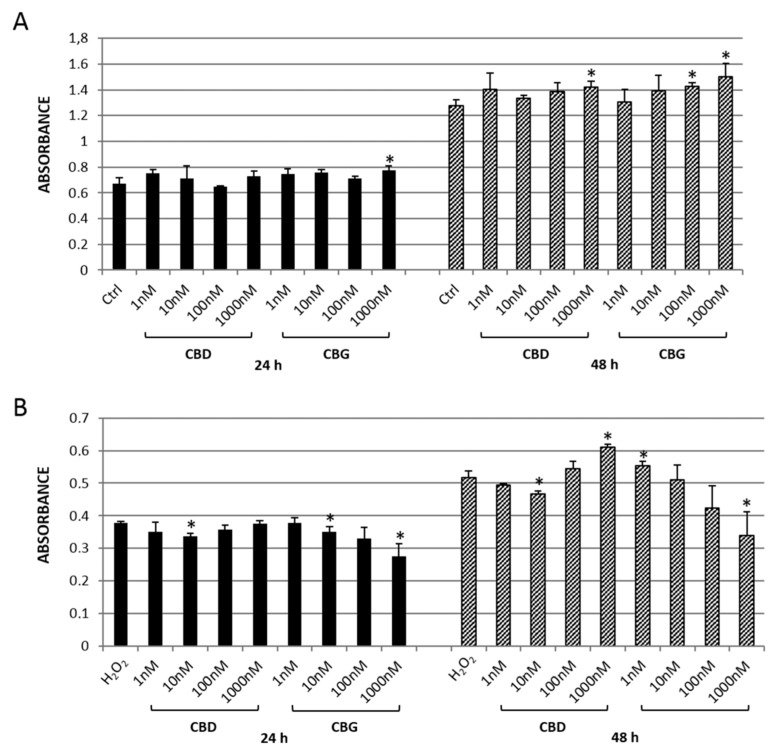
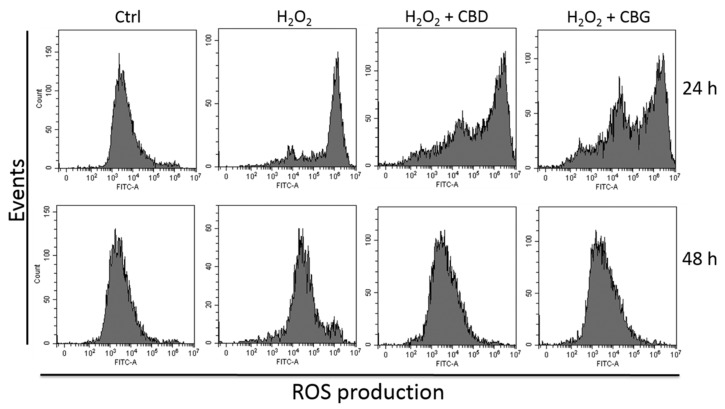
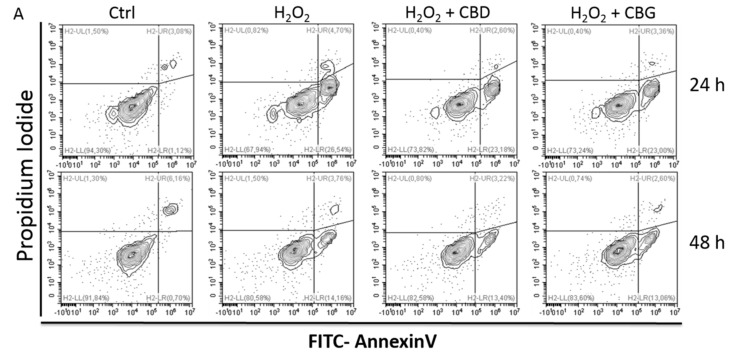
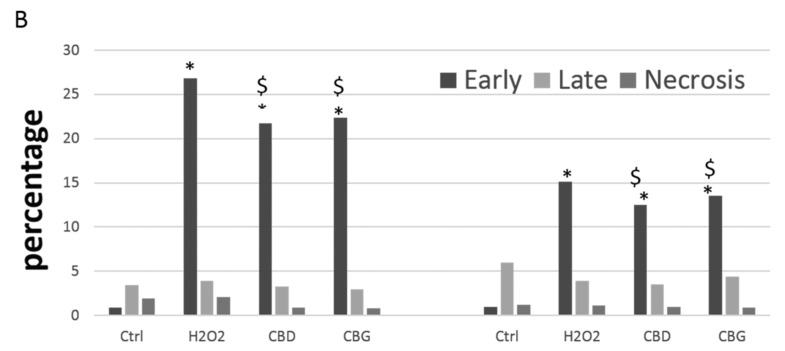
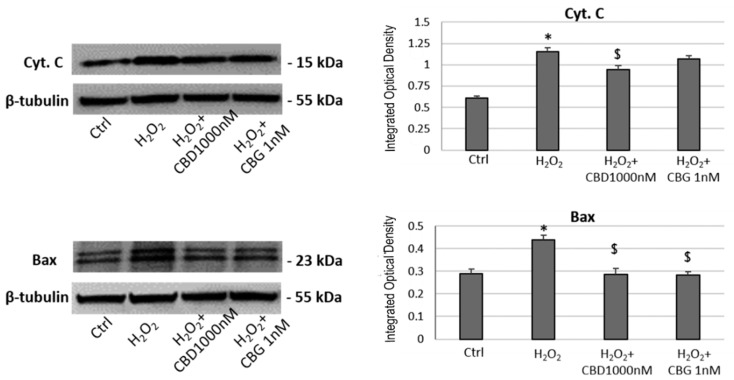
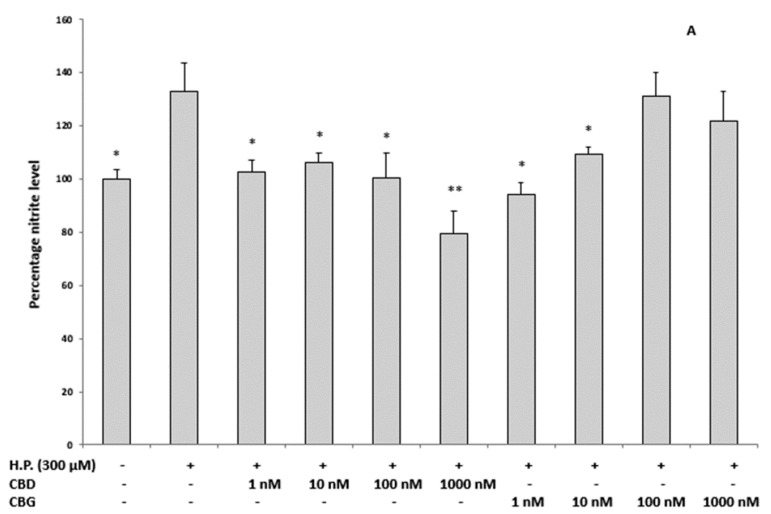
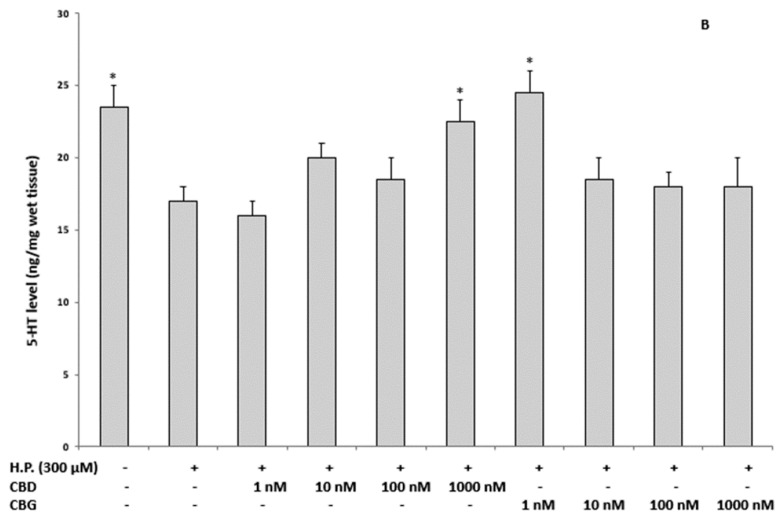
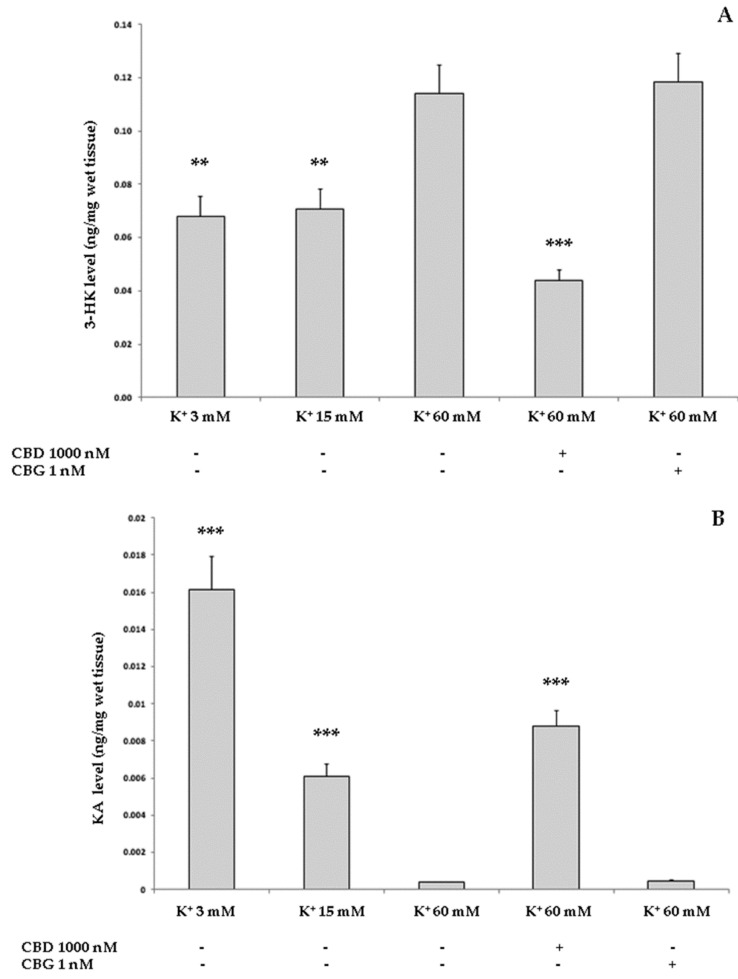
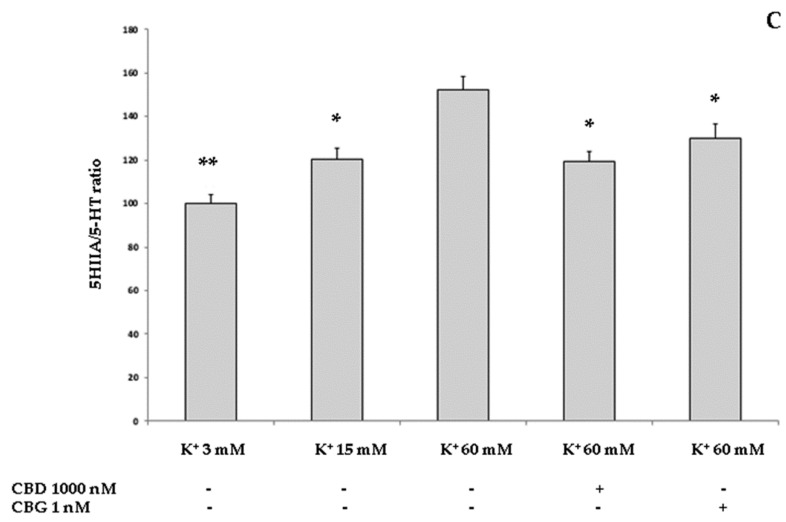
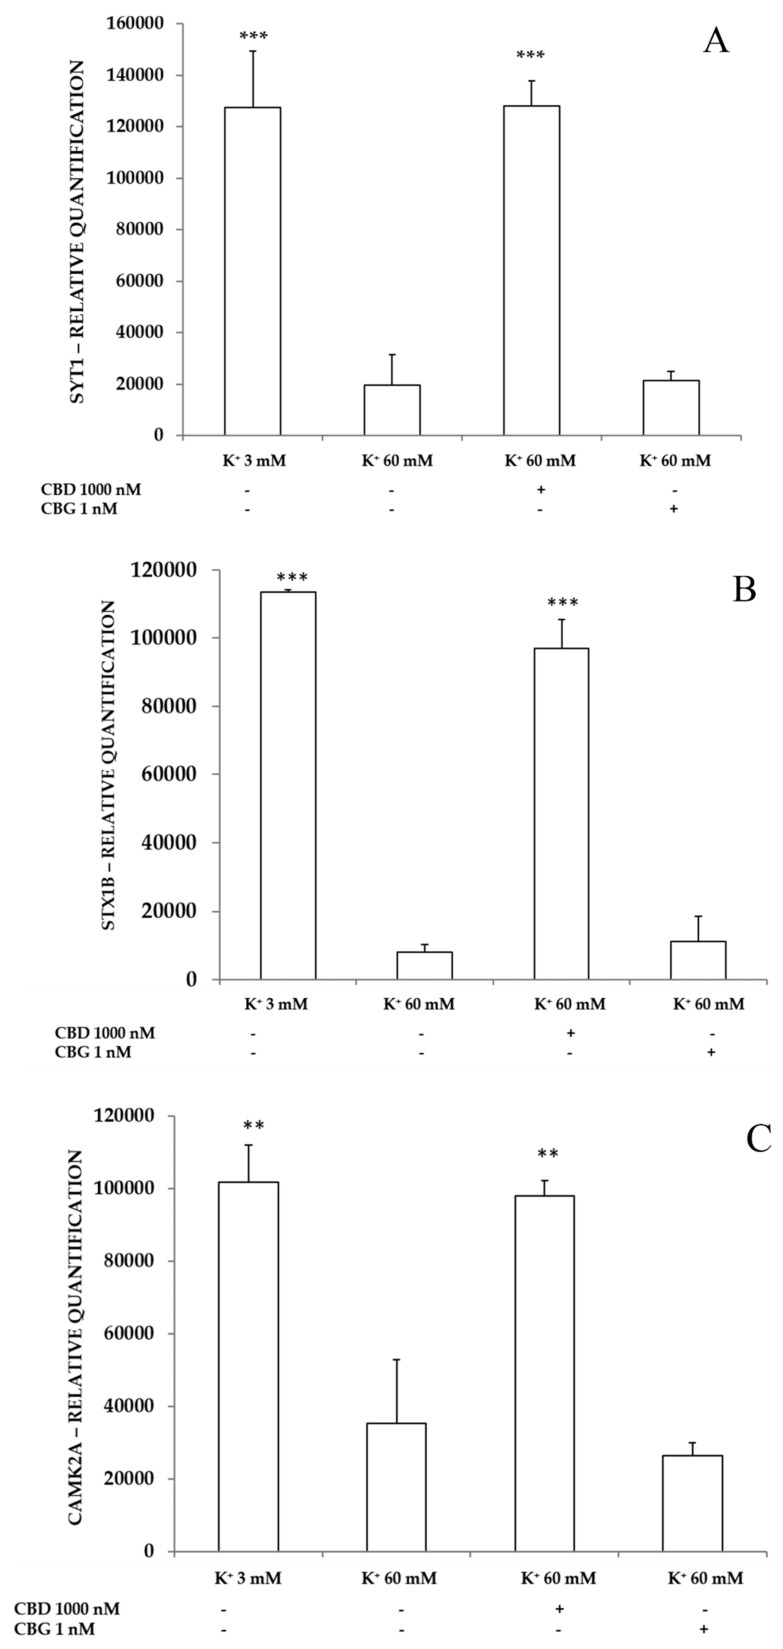
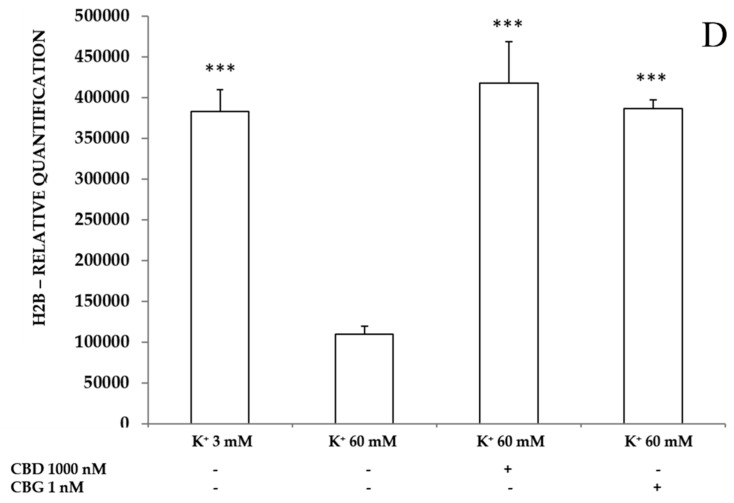
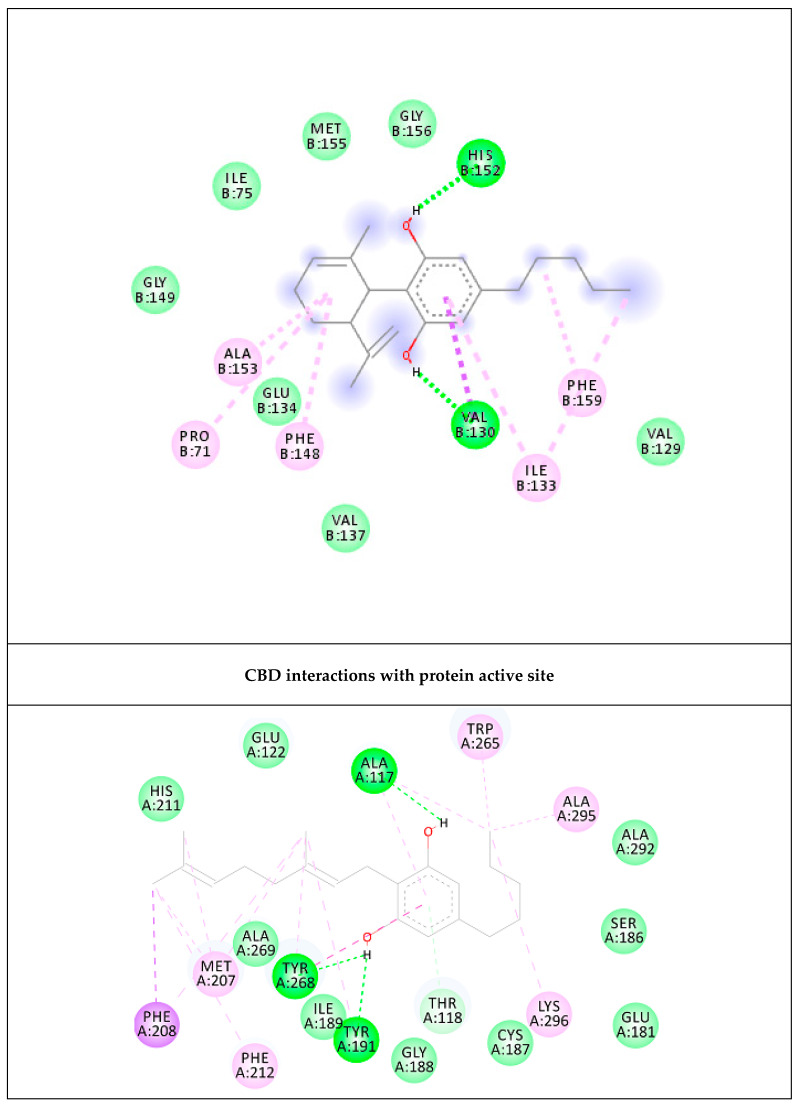
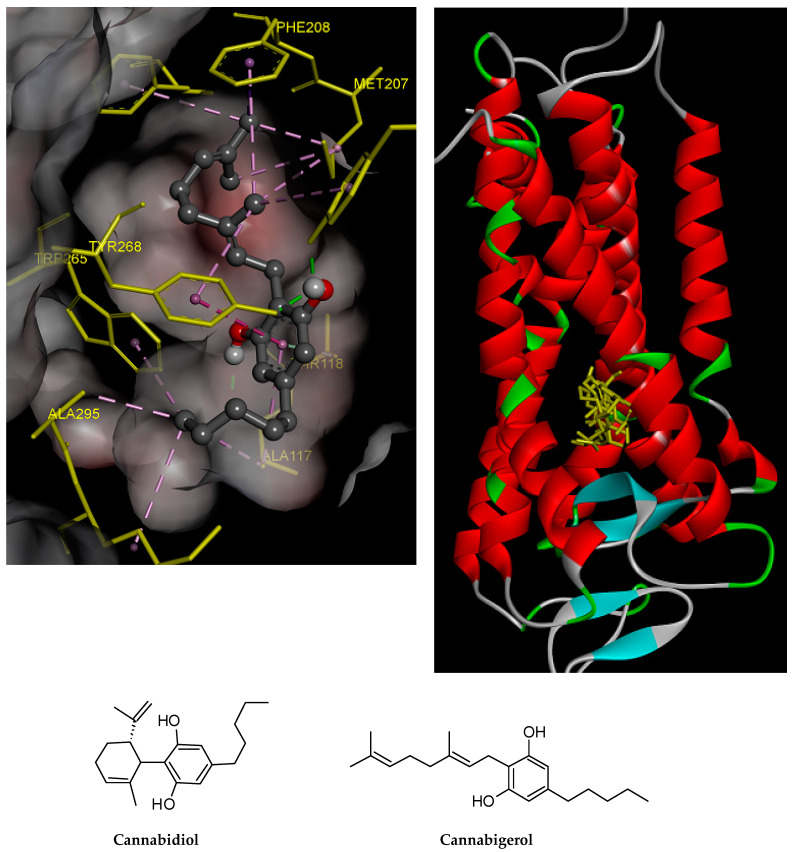
Cannabidiol (CBD) and cannabigerol (CBG) are Cannabis sativa terpenophenols. Although CBD's effectiveness against neurological diseases has already been demonstrated, nothing is known about CBG. Therefore, a comparison of the effects of these compounds was performed in two experimental models mimicking the oxidative stress and neurotoxicity occurring in neurological diseases. Rat astrocytes were exposed to hydrogen peroxide and cell viability, reactive oxygen species production and apoptosis occurrence were investigated. Cortexes were exposed to K+ 60 mM depolarizing stimulus and serotonin (5-HT) turnover, 3-hydroxykinurenine and kynurenic acid levels were measured. A proteomic analysis and bioinformatics and docking studies were performed. Both compounds exerted antioxidant effects in astrocytes and restored the cortex level of 5-HT depleted by neurotoxic stimuli, whereas sole CBD restored the basal levels of 3-hydroxykinurenine and kynurenic acid. CBG was less effective than CBD in restoring the levels of proteins involved in neurotransmitter exocytosis. Docking analyses predicted the inhibitory effects of these compounds towards the neurokinin B receptor. Conclusion: The results in the in vitro system suggest brain non-neuronal cells as a target in the treatment of oxidative conditions, whereas findings in the ex vivo system and docking analyses imply the potential roles of CBD and CBG as neuroprotective agents.

Keywords: apoptosis; cannabidiol; cannabigerol; docking; exocytosis; neuroprotection; oxidative stress; proteomic analysis; serotonin.


Conflict of interest statement

The authors declare no conflict of interest.

Figures

Figure 1
Figure 1
MTT assay of CTX-TNA2 astrocyte cell line exposed to different concentrations (1–1000 nM) of either cannabidiol (CBD) or cannabigerol (CBG) for 24 (black bars) and 48 h (grey bars). (A) Cells in basal conditions. (B) Cells challenged with 300 µM H2O2. The data graph bars are the mean ± SD (n = 3). ANOVA, * p < 0.05 vs. control group.
Figure 2
Figure 2
Reactive oxygen species (ROS) production in CTX-TNA2 astrocyte cell line exposed to 1000 nM CBD and 1 nM CBG and challenged with H2O2 for 24 and 48 h. One representative experiment out of three independent experiments is shown (n = 3).
Figure 3
Figure 3
Apoptosis occurrence in CTX-TNA2 astrocyte cell line exposed to 1000 nM CBD and 1 nM CBG and challenged with H2O2 for 24 and 48 h. ANOVA, * p < 0.05 vs. control group; $ p < 0.05 vs. H2O2 group. (A) A representative experiment (B) The graph shows the mean ± SD (n = 3). Early: early apoptosis, i.e., Annexin-Vpos and PIneg cells Late: late apoptosis, i.e., Annexin-Vpos and PIpos cells. Necrosis: Annexin-Vneg and PIpos cells.
Figure 3
Figure 3
Apoptosis occurrence in CTX-TNA2 astrocyte cell line exposed to 1000 nM CBD and 1 nM CBG and challenged with H2O2 for 24 and 48 h. ANOVA, * p < 0.05 vs. control group; $ p < 0.05 vs. H2O2 group. (A) A representative experiment (B) The graph shows the mean ± SD (n = 3). Early: early apoptosis, i.e., Annexin-Vpos and PIneg cells Late: late apoptosis, i.e., Annexin-Vpos and PIpos cells. Necrosis: Annexin-Vneg and PIpos cells.
Figure 4
Figure 4
Western blotting analysis in CTX-TNA2 astrocyte cell line exposed to 1000 nM CBD and 1 nM CBG and challenged with H2O2 for 24 h. The graph shows the mean ± SD (n = 3). ANOVA, * p < 0.05 vs. Ctrl group; $ p < 0.05 vs. H2O2 group. A representative western blotting for each protein is shown.
Figure 5
Figure 5
Inhibitory effects of CBD and CBG 1–1000 nM on H2O2-induced increase in nitrite level (expressed as percentage level compared to control group; panel (A) and reduction in 5-HT level (expressed as ng/mg wet tissue; panel (B), in isolated rat cortexes (n = 3 for each experimental condition). Panel A: ANOVA, p < 0.001, F = 14.02; post hoc test, * p < 0.05, ** p < 0.01 vs. hydrogen peroxide (H.P.) group. Panel B: ANOVA, p < 0.001, F = 12.99; post hoc test, * p < 0.05 vs. hydrogen peroxide (H.P.) group.
Figure 5
Figure 5
Inhibitory effects of CBD and CBG 1–1000 nM on H2O2-induced increase in nitrite level (expressed as percentage level compared to control group; panel (A) and reduction in 5-HT level (expressed as ng/mg wet tissue; panel (B), in isolated rat cortexes (n = 3 for each experimental condition). Panel A: ANOVA, p < 0.001, F = 14.02; post hoc test, * p < 0.05, ** p < 0.01 vs. hydrogen peroxide (H.P.) group. Panel B: ANOVA, p < 0.001, F = 12.99; post hoc test, * p < 0.05 vs. hydrogen peroxide (H.P.) group.
Figure 6
Figure 6
Effects of CBD 1000 nM and CBG 1 nM on K+ 60 mM-induced increase in 3-HK level (expressed as ng/mg wet tissue; Panel (A), reduction in kynurenic acid (KA) level (expressed as ng/mg wet tissue; Panel (B), and increase in 5-HT turnover (measured as 5HIIA/5-HT ratio, Panel C) in isolated rat cortexes (n = 3 for each experimental condition). Panel A: ANOVA, p < 0.001, F = 41.26; post hoc test, ** p < 0.01, *** p < 0.001 vs. K+ 60 mM group. Panel B: ANOVA, p < 0.001, F = 91.51; post hoc test, *** p < 0.001 vs. K+ 60 mM group. Panel C: ANOVA, p < 0.001, F = 32.37; post hoc test, * p < 0.05, ** p < 0.01 vs. K+ 60 mM group.
Figure 6
Figure 6
Effects of CBD 1000 nM and CBG 1 nM on K+ 60 mM-induced increase in 3-HK level (expressed as ng/mg wet tissue; Panel (A), reduction in kynurenic acid (KA) level (expressed as ng/mg wet tissue; Panel (B), and increase in 5-HT turnover (measured as 5HIIA/5-HT ratio, Panel C) in isolated rat cortexes (n = 3 for each experimental condition). Panel A: ANOVA, p < 0.001, F = 41.26; post hoc test, ** p < 0.01, *** p < 0.001 vs. K+ 60 mM group. Panel B: ANOVA, p < 0.001, F = 91.51; post hoc test, *** p < 0.001 vs. K+ 60 mM group. Panel C: ANOVA, p < 0.001, F = 32.37; post hoc test, * p < 0.05, ** p < 0.01 vs. K+ 60 mM group.
Figure 7
Figure 7
Inhibitory effects of CBD 1000 nM and CBG 1 nM on K+ 60 mM-induced reduction in Syt 1 (panel A), Stx 1b (panel B), CAMK2A (panel C) and H2B (panel D) levels (expressed as Relative Quantification: R.Q.), in isolated rat cortexes (n = 3 for each experimental condition). (Panel A): ANOVA, p < 0.0001, F = 125.5; post hoc test, ***p < 0.001 vs. K+ 60 mM group. (Panel B): ANOVA, p < 0.0001, F = 141.6; post hoc test, ***p < 0.001 vs. K+ 60 mM group. (Panel C): ANOVA, p < 0.0001, F = 50.51; post hoc test, ** p < 0.01 vs. K+ 60 mM group. (Panel D): ANOVA, p < 0.0001, F = 54.27; post hoc test, ***p < 0.001 vs. K+ 60 mM group.
Figure 7
Figure 7
Inhibitory effects of CBD 1000 nM and CBG 1 nM on K+ 60 mM-induced reduction in Syt 1 (panel A), Stx 1b (panel B), CAMK2A (panel C) and H2B (panel D) levels (expressed as Relative Quantification: R.Q.), in isolated rat cortexes (n = 3 for each experimental condition). (Panel A): ANOVA, p < 0.0001, F = 125.5; post hoc test, ***p < 0.001 vs. K+ 60 mM group. (Panel B): ANOVA, p < 0.0001, F = 141.6; post hoc test, ***p < 0.001 vs. K+ 60 mM group. (Panel C): ANOVA, p < 0.0001, F = 50.51; post hoc test, ** p < 0.01 vs. K+ 60 mM group. (Panel D): ANOVA, p < 0.0001, F = 54.27; post hoc test, ***p < 0.001 vs. K+ 60 mM group.
Figure 8
Figure 8
Interactions of the docked compounds, CBD and CBG. The 2D orientations of both docked compounds are shown. The putative interactions with neurokinin 3 receptor (NK3R) are shown with different colors.
Figure 8
Figure 8
Interactions of the docked compounds, CBD and CBG. The 2D orientations of both docked compounds are shown. The putative interactions with neurokinin 3 receptor (NK3R) are shown with different colors.
Figure 9
Figure 9
CBD and CBG overlap at the active site of NK3R. The higher affinity of CBG is related to the higher number of hydrogen bonds and pi–pi interactions of CBG with NK3R.

References

    1. Fasinu P.S., Phillips S., ElSohly M.A., Walker L.A. Current status and prospects for cannabidiol preparations as new therapeutic agents. Pharmacotherapy. 2016;36:781–796. doi: 10.1002/phar.1780. - DOI - PubMed
    1. Citti C., Linciano P., Russo F., Luongo L., Iannotta M., Maione S., Laganà A., Capriotti A.L., Forni F., Vandelli M.A., et al. A novel phytocannabinoid isolated from Cannabis sativa L. with an in vivo cannabimimetic activity higher than Δ9-tetrahydrocannabinol: Δ9-Tetrahydrocannabiphorol. Sci. Rep. 2019;9:20335. doi: 10.1038/s41598-019-56785-1. - DOI - PMC - PubMed
    1. Marchalant Y., Brothers H.M., Norman G.J., Karelina K., DeVries A.C., Wenk G.L. Cannabinoids attenuate the effects of aging upon neuroinflammation and neurogenesis. Neurobiol. Dis. 2009;34:300–307. doi: 10.1016/j.nbd.2009.01.014. - DOI - PubMed
    1. Aso E., Ferrer I. Cannabinoids for treatment of Alzheimer’s disease: Moving toward the clinic. Front. Pharmacol. 2014;5:37. doi: 10.3389/fphar.2014.00037. - DOI - PMC - PubMed
    1. Muller C., Morales P., Reggio P.H. Cannabinoid ligands targeting TRP channels. Front. Mol. Neurosci. 2018;11:487. doi: 10.3389/fnmol.2018.00487. - DOI - PMC - PubMed