

Fecal Malodor Detection Using Low-Cost Electrochemical Sensors
- PMID: 32443709
- PMCID: PMC7287618
- DOI: 10.3390/s20102888
Fecal Malodor Detection Using Low-Cost Electrochemical Sensors
Abstract
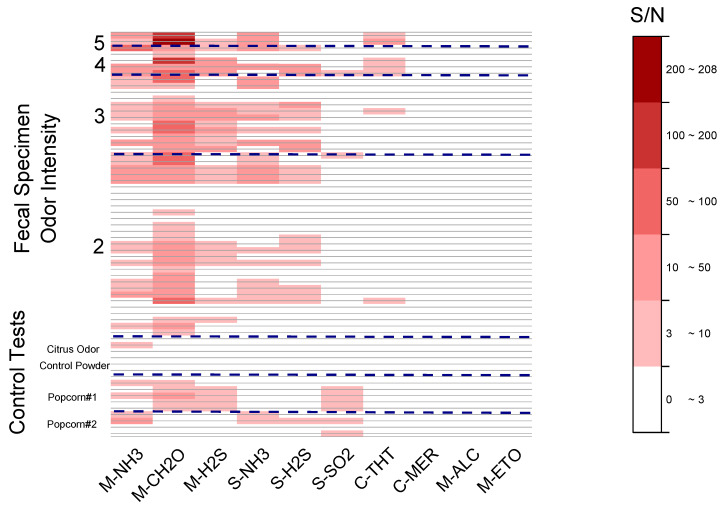
Technology innovation in sanitation is needed for the 4.2 billion people worldwide, lacking safely managed sanitation services. A major requirement for the adoption of these technologies is the management of malodor around toilet and treatment systems. There is an unmet need for a low-cost instrumented technology for detecting the onset of sanitation malodor and triggering corrective actions. This study combines sensory data with low-cost gas sensor data on malodor emanating from feces. The response of 10 commercial electrochemical gas sensors was collected alongside olfactometric measurements. Odor from fecal specimens at different relevant dilution as well as specimens with pleasant odors as a control were evaluated for a total of 64 responses. Several of the sensors responded positively to the fecal odor, with the formaldehyde, hydrogen sulfide, and ammonia sensors featuring the highest signal to noise ratio. A positive trend was observed between the sensors' responses and the concentration of the odorant and with odor intensity, but no clear correspondence with dilution to threshold (D/T) values was found. Selected sensors were responsive both above and below the intensity values used as the cutoff for offensive odor, suggesting the possibility of using those sensors to differentiate odor offensiveness based just on the magnitude of their response. The specificity of the sensors suggested that discrimination between the selected non-fecal and fecal odors was possible. This study demonstrates that some of the evaluated sensors could be used to assemble a low-cost malodor warning system.
Keywords: electronic nose; low-cost sensors; malodor; odor.
Conflict of interest statement
The authors declare no conflict of interest. The funders had no role in the design of the study; in the collection, analyses, or interpretation of data; in the writing of the manuscript, or in the decision to publish the results.
Figures


References
-
- Progress on Household Drinking Water, Sanitation and Hygiene I 2000-2017 Special Focus on Inequalities. [(accessed on 10 December 2019)]; Available online: https://www.who.int/water_sanitation_health/publications/jmp-report-2019...
-
- Target 6.2 –Sanitation and Hygiene -sdg6monitoring. [(accessed on 10 December 2019)]; Available online: https://www.sdg6monitoring.org/indicators/target-6-2.
-
- Reinvent the Toilet Challenge & Expo-Bill & Melinda Gates Foundation. [(accessed on 10 December 2019)]; Available online: https://www.gatesfoundation.org/what-we-do/global-growth-and-opportunity....
-
- Parkinson J., Tayler K., Colin J., Nema A. A Guide to Decisionmaking Technology Options for Urban Sanitation in India. [(accessed on 19 May 2020)];Water Sanit. Program. South. Asia World Bank New Delhi. 2008 Part C:55. Available online: http://mohua.gov.in/upload/uploadfiles/files/Urban_Sanitation.pdf.
-
- Bekchanov M., Evia P. Working Paper 168 Resources Recovery in South and Southeast Asia. [(accessed on 19 May 2020)]; Available online: https://papers.ssrn.com/sol3/papers.cfm?abstract_id=3293535.
MeSH terms
Substances
Grants and funding
LinkOut - more resources
Full Text Sources
Medical
