Bactericidal Activity of Usnic Acid-Chitosan Nanoparticles against Persister Cells of Biofilm-Forming Pathogenic Bacteria
- PMID: 32443816
- PMCID: PMC7281555
- DOI: 10.3390/md18050270
Bactericidal Activity of Usnic Acid-Chitosan Nanoparticles against Persister Cells of Biofilm-Forming Pathogenic Bacteria
Abstract
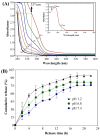
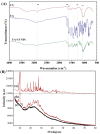
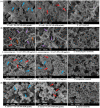
The present study aimed to prepare usnic acid (UA)-loaded chitosan (CS) nanoparticles (UA-CS NPs) and evaluate its antibacterial activity against biofilm-forming pathogenic bacteria. UA-CS NPs were prepared through simple ionic gelification of UA with CS, and further characterized using Fourier transform infrared spectroscopy, X-ray diffraction, and field-emission transmission electron microscopy. The UA-CS NPs presented a loading capacity (LC) of 5.2%, encapsulation efficiency (EE) of 24%, and a spherical shape and rough surface. The maximum release of UA was higher in pH 1.2 buffer solution as compared to that in pH 6.8 and 7.4 buffer solution. The average size and zeta potential of the UA-CS NPs was 311.5 ± 49.9 nm in diameter and +27.3 ± 0.8 mV, respectively. The newly prepared UA-CS NPs exhibited antibacterial activity against persister cells obtained from the stationary phase in batch culture, mature biofilms, and antibiotic-induced gram-positive and gram-negative pathogenic bacteria. Exposure of sub-inhibitory concentrations of UA-CS NPs to the bacterial cells resulted in a change in morphology. The present study suggests an alternative method for the application of UA into nanoparticles. Furthermore, the anti-persister activity of UA-CS NPs may be another possible strategy for the treatment of infections caused by biofilm-forming pathogenic bacteria.
Keywords: UA-CS NPs; anti-persister; bacteria; chitosan; nanoparticles; pathogens; usnic acid.
Conflict of interest statement
The authors declare no conflict of interest.
Figures


Similar articles
-
Fabrication and antimicrobial properties of novel meropenem-honey encapsulated chitosan nanoparticles against multiresistant and biofilm-forming Staphylococcus aureus as a new antimicrobial agent.Vet Med Sci. 2024 May;10(3):e1440. doi: 10.1002/vms3.1440. Vet Med Sci. 2024. PMID: 38613443 Free PMC article.
-
The synergistic effect of using bacteriophages and chitosan nanoparticles against pathogenic bacteria as a novel therapeutic approach.Int J Biol Macromol. 2023 Feb 15;228:374-384. doi: 10.1016/j.ijbiomac.2022.12.246. Epub 2022 Dec 26. Int J Biol Macromol. 2023. PMID: 36581028
-
Biological applications study of bio-nanocomposites based on chitosan/TiO2 nanoparticles polymeric films modified by oleic acid.J Biomed Mater Res A. 2021 Feb;109(2):232-247. doi: 10.1002/jbm.a.37019. Epub 2020 Jun 17. J Biomed Mater Res A. 2021. PMID: 32496626
-
Natural Product Usnic Acid as an Antibacterial Therapeutic Agent: Current Achievements and Further Prospects.ACS Infect Dis. 2025 Jun 13;11(6):1403-1415. doi: 10.1021/acsinfecdis.5c00238. Epub 2025 May 15. ACS Infect Dis. 2025. PMID: 40371696 Review.
-
Usnic Acid: Potential Role in Management of Wound Infections.Adv Exp Med Biol. 2019;1214:31-41. doi: 10.1007/5584_2018_260. Adv Exp Med Biol. 2019. PMID: 30151647 Review.
Cited by
-
Usnic Acid-Loaded Magnetite Nanoparticles-A Comparative Study between Synthesis Methods.Molecules. 2023 Jul 4;28(13):5198. doi: 10.3390/molecules28135198. Molecules. 2023. PMID: 37446861 Free PMC article.
-
ROS-Induced DNA-Damage and Autophagy in Oral Squamous Cell Carcinoma by Usnea barbata Oil Extract-An In Vitro Study.Int J Mol Sci. 2022 Nov 27;23(23):14836. doi: 10.3390/ijms232314836. Int J Mol Sci. 2022. PMID: 36499160 Free PMC article.
-
Sustained release of usnic acid from graphene coatings ensures long term antibiofilm protection.Sci Rep. 2021 May 11;11(1):9956. doi: 10.1038/s41598-021-89452-5. Sci Rep. 2021. PMID: 33976310 Free PMC article.
-
Research Progress on Extracellular Matrix-Based Composite Materials in Antibacterial Field.Biomater Res. 2025 Jan 16;29:0128. doi: 10.34133/bmr.0128. eCollection 2025. Biomater Res. 2025. PMID: 39822928 Free PMC article. Review.
-
Antiinfective properties of ursolic acid-loaded chitosan nanoparticles against Staphylococcus aureus.Turk J Chem. 2021 Oct 19;45(5):1454-1462. doi: 10.3906/kim-2104-13. eCollection 2021. Turk J Chem. 2021. PMID: 34849059 Free PMC article.
References
-
- Lewis K. Multidrug tolerance of biofilms and persister cells. Curr. Top. Microbiol. Immunol. 2008;322:107–131. - PubMed
MeSH terms
Substances
Grants and funding
LinkOut - more resources
Full Text Sources
Medical

