. 2020 May 20;9(5):1547.
doi: 10.3390/jcm9051547.

An Efficient COVID-19 Prediction Model Validated with the Cases of China, Italy and Spain: Total or Partial Lockdowns?

Affiliations

An Efficient COVID-19 Prediction Model Validated with the Cases of China, Italy and Spain: Total or Partial Lockdowns?

Samuel Sanchez-Caballero et al. J Clin Med. .

Abstract

The present work develops an accurate prediction model of the COVID-19 pandemic, capable not only of fitting data with a high regression coefficient but also to predict the overall infections and the infection peak day as well. The model is based on the Verhulst equation, which has been used to fit the data of the COVID-19 spread in China, Italy, and Spain. This model has been used to predict both the infection peak day, and the total infected people in Italy and Spain. With this prediction model, the overall infections, the infection peak, and date can accurately be predicted one week before they occur. According to the study, the infection peak took place on 23 March in Italy, and on 29 March in Spain. Moreover, the influence of the total and partial lockdowns has been studied, without finding any meaningful difference in the disease spread. However, the infected population, and the rate of new infections at the start of the lockdown, seem to play an important role in the infection spread. The developed model is not only an important tool to predict the disease spread, but also gives some significant clues about the main factors that affect to the COVID-19 spread, and quantifies the effects of partial and total lockdowns as well.

Keywords: COVID-19; China; France; Germany; Italy; SARS-CoV-2; Spain; UK; Verhulst; coronavirus; forecast; model; prediction.


Conflict of interest statement

The authors declare no conflict of interest.

Figures

Figure 1
Figure 1
Timeline of the most relevant milestones.
Figure 2
Figure 2
Total number of infected people in China.
Figure 3
Figure 3
Number of daily diagnosed cases in China.
Figure 4
Figure 4
Evolution of the peak of diagnosed COVID-19 patients in China.
Figure 5
Figure 5
Evolution of the total number of diagnosed COVID-19 patients in China.
Figure 6
Figure 6
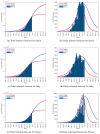
Evolution of the peak of diagnosed COVID-19 patients in Italy.
Figure 7
Figure 7
Evolution of the total number of diagnosed COVID-19 patients in Italy.
Figure 8
Figure 8
Total number of COVID-19 infections in Italy.
Figure 9
Figure 9
Number of daily diagnosed cases in Italy.
Figure 10
Figure 10
Evolution of the peak of diagnosed COVID-19 patients in Spain.
Figure 11
Figure 11
Evolution of the total number of diagnosed COVID-19 patients in Spain.
Figure 12
Figure 12
Total number of COVID-19 infections in Spain.
Figure 13
Figure 13
Number of daily diagnosed cases in Spain.
Figure 14
Figure 14
Slope determination for Spain.
Figure 15
Figure 15
Total and daily infected forecasts.
Figure 16
Figure 16
Total and daily infected forecasts.
Figure 17
Figure 17
Number of daily diagnosed cases comparison.
Figure 18
Figure 18
Comparison of centered rate of new infections.

References

    1. Smith D. The Palgrave Handbook of Unconventional Risk Transfer. Palgrave Macmillan; London, UK: 2017. Pandemic Risk Modelling; pp. 463–495.
    1. Huang C., Wang Y., Li X., Ren L., Zhao J., Hu Y., Zhang L., Fan G., Xu J., Gu X., et al. Clinical features of patients infected with 2019 novel coronavirus in Wuhan, China. Lancet. 2020;395:497–506. doi: 10.1016/S0140-6736(20)30183-5. - DOI - PMC - PubMed
    1. Al-qaness M.A.A., Ewees A.A., Fan H., Abd El Aziz M. Optimization Method for Forecasting Confirmed Cases of COVID-19 in China. J. Clin. Med. 2020;9:674. doi: 10.3390/jcm9030674. - DOI - PMC - PubMed
    1. Roosa K., Lee Y., Luo R., Kirpich A., Rothenberg R., Hyman J.M., Yan P., Chowell G. Short-term Forecasts of the COVID-19 Epidemic in Guangdong and Zhejiang, China: 13–23 February 2020. J. Clin. Med. 2020;9:596. doi: 10.3390/jcm9020596. - DOI - PMC - PubMed
    1. Shao N., Zhong M., Yan Y., Pan H., Cheng J., Chen W. Dynamic models for Coronavirus Disease 2019 and data analysis. Math. Methods Appl. Sci. 2020;43:4943–4949. doi: 10.1002/mma.6345. - DOI - PMC - PubMed