. 2020 May 20;9(5):650.
doi: 10.3390/plants9050650.

Patatin-Related Phospholipase pPLAIIIγ Involved in Osmotic and Salt Tolerance in Arabidopsis

Affiliations

Patatin-Related Phospholipase pPLAIIIγ Involved in Osmotic and Salt Tolerance in Arabidopsis

Jianwu Li et al. Plants (Basel). .

Abstract

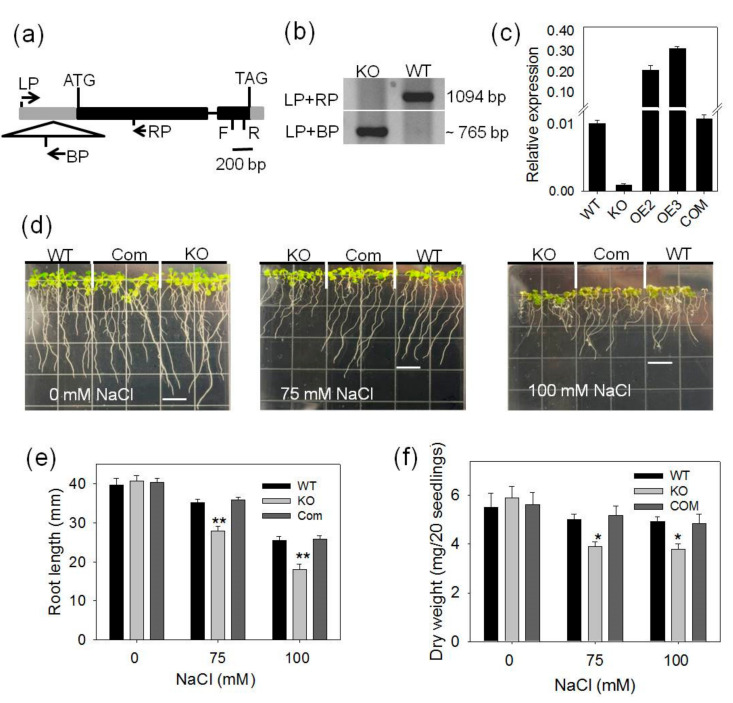
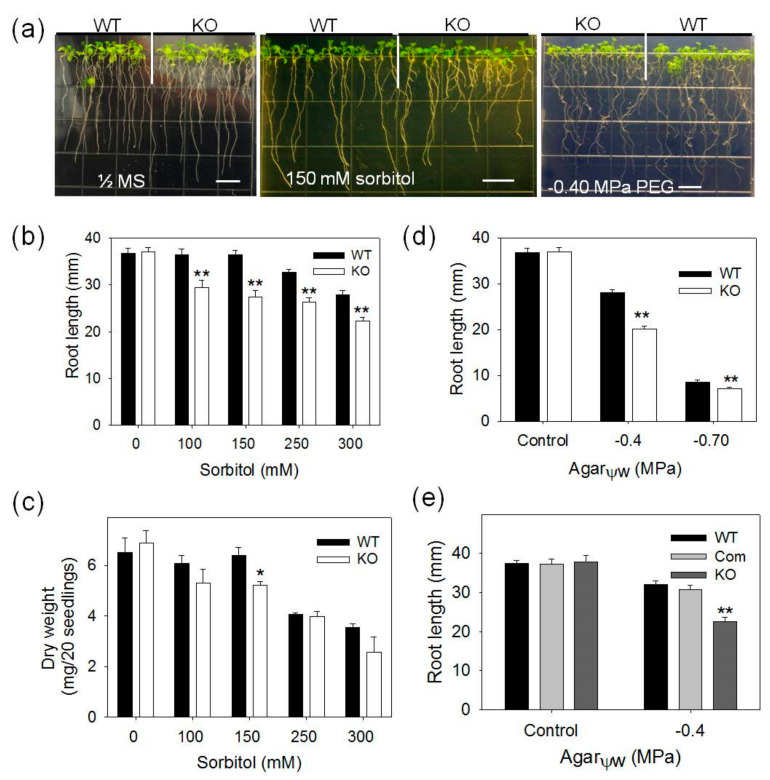
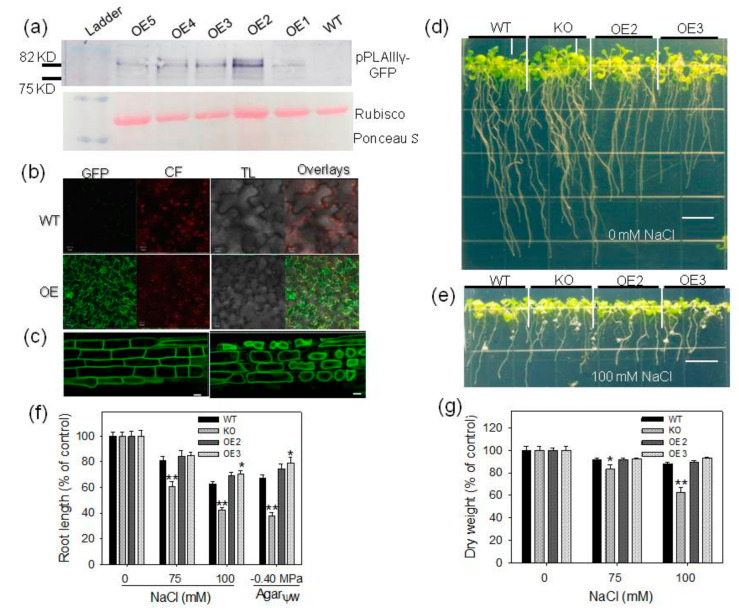
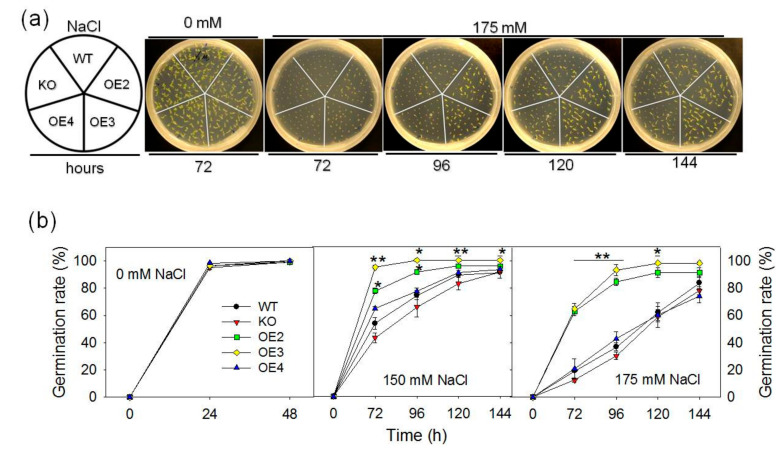
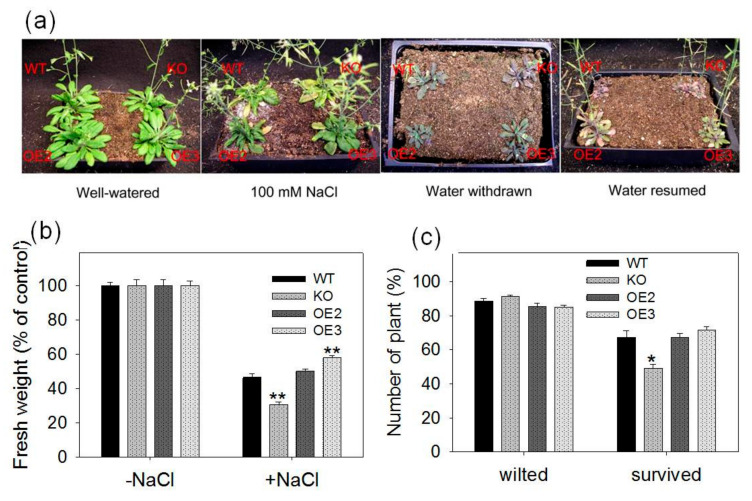
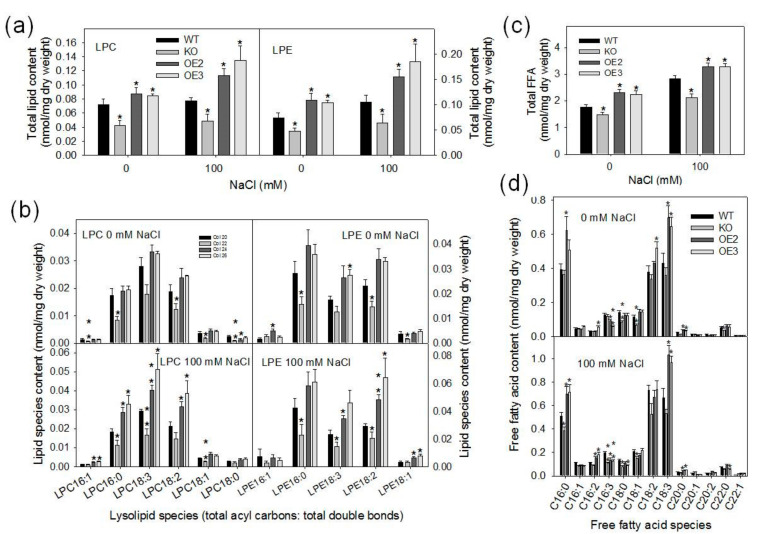
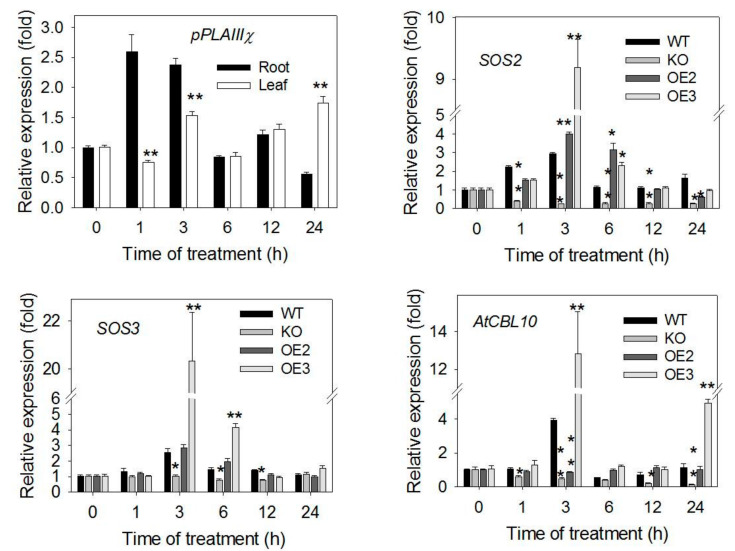
Patatinrelated phospholipases (pPLAs) are acylhydrolyzing enzymes implicated in various processes, including lipid metabolism, signal transduction, plant growth and stress responses, but the function for many specific pPLAs in plants remains unknown. Here we determine the effect of patatinrelated phospholipase A pPLAIIIγ on Arabidopsis response to abiotic stress. Knockout of pPLAIIIγ rendered plants more sensitive whereas overexpression of pPLAIIIγ enhanced plant tolerance to NaCl and drought in seed germination and seedling growth. The pPLAIIIγknockout and overexpressing seedlings displayed a lower and higher level of lysolipids and free fatty acids than that of wildtype plants in response to NaCl stress, respectively. These results indicate that pPLAIIIγ acts a positive regulator of salt and osmatic stress tolerance in Arabidopsis.

Keywords: Arabidopsis; abiotic stress; free fatty acid; lysophospholipids; patatinrelated phospholipase A; signaling mediators.


Conflict of interest statement

The corresponding author states that there is no conflict of interest.

Figures

Figure 1
Figure 1
pPLAIIIγ-KO, its complementation (COM) and response to different NaCl concentrations; (a) T-DNA insertion site in pPLAIIIγ. Solid boxes indicate exons, thin lines indicate introns, gray boxes represent the untranslated regions (UTR) at both the 5′ and 3′ positions. Arrows (LP, BP and RP) show positions of primers used for PCR. F and R present positions of JLP053 and JLP054 primers, respectively, for pPLAIIIγ relative expression in qPCR; (b) PCR-confirmation of T-DNA insertion in pPLAIIIγ using genomic DNA; (c) relative gene expression of pPLAIIIγ in WT, KO, OE and COM lines by qPCR. UBQ10 was used as internal control. Data are means ± SE (n = 3); (d) representative images of seedlings grown on half-strength MS media supplemented with 0, 75 and 100-mM NaCl. Measurement of primary root length (e) and dry weight (f) of WT, KO and COM lines. Seedlings were grown for 7 days under different treatments after transferring and then measured. Values are mean ± SE (n = 45–60 for root length or 3 biologic repeats for dry weight. One and two asterisks indicate significant differences from WT by Student’s t-test at p = 0.05 and p = 0.01, respectively.
Figure 2
Figure 2
Responses of pPLAIIIγ-KO, COM and WT Arabidopsis plants to sorbitol and polyethylene glycol (PEG). (a) Representative images under different sorbitol and PEG concentrations; (b, c) quantification of seedling growth in response to different levels of sorbitol. Three-day-old seedlings germinated on ½ MS media after stratification were transferred to plates with 0, 100, 150, 250 and 300-mM sorbitol. Seedlings were harvested and measured 7 days after transferring; (d,e) quantification of seedling growth in response to different levels of PEG. Values are mean ± SE from three biologic repeats for dry weight of each line in (c). Error bars indicate the SE (n = 45–60) in (b,d,e) for primary root length. One and two asterisks indicate significant differences from WT by Student’s t-test at p = 0.05 and p = 0.01, respectively.
Figure 3
Figure 3
Opposite effects of pPLAIIIγ-KO and -OE lines on tolerance to NaCl and PEG; (a) Immunoblotting of GFP-His-tagged pPLAIIIγ in Arabidopsis. Five independent homozygous lines of pPLAIIIγ-OE mutants were examined; (b) confocal images of epidermal cells of WT and pPLAIIIγ-OE:GFP leaves and chlorophyll fluorescence versus GFP; (c) plasmolysis of root epidermal cell of the pPLAIIIγ-OE:GFP. Representative images of WT, KO and OE lines without (d) or with (e) NaCl stress; (f) relative growth of root length of WT, KO and OE lines. Values are mean ± SE (n = 45–60); (g) relative growth of dry weight of WT, KO and OE lines. Values are mean ± SE from three biologic repeats for each line (20 seedlings dry weight per biologic repeat). One and two asterisks indicate significant differences from WT by Student’s t-test at p = 0.05 and p = 0.01, respectively.
Figure 4
Figure 4
Effect of pPLAIIIγ-KO and -OE on seed germination under salt stress. (a) Representative images of seed germination; (b) effect of NaCl on seed germination phenotype of wild type (WT), pPLAIIIγ knockout (KO) and OE-lines. Thirty-seven to forty-one seeds of each line per biologic repeat were germinated on an agar plate containing 0-, 150- or 175-mM NaCl, respectively. Germinated seeds were counted at 48, 72, 96,120 and 144 h after stratification. Values are mean ± SE of three biologic repeats. One and two asterisks indicate significant differences from WT by Student’s t-test at p = 0.05 and p = 0.01, respectively.
Figure 5
Figure 5
Soil-grown plants of WT, pPLAIIIγ-KO and OE mutants under salt and drought stress; (a) images of plants that were watered regularly (well-watered), treated with 100-mM NaCl for 20 days (100-mM NaCl) or deprived of water for 16 days (water withdraw) and then watering was resumed (water resumed). Three-week-old seedlings were used for NaCl and drought treatments, and drought-treated plants were rewatered and grown for 18 days; (b) measurement of the relative growth of WT, KO and OE lines; (c) measurement of wilted and survived plants when water was withdrawn (wilted) and survived plants that wilted plants were watered again when water was resumed (survived). Error bars represent standard error (four biologic repeats). One and two asterisks indicate significant differences from WT by Student’s t-test at p = 0.05 and p = 0.01, respectively.
Figure 6
Figure 6
Effects of pPLAIIIγ-KO and OE on lysophospholipid and free fatty acids (FFA) levels in Arabidopsis; (a) total lysophospholipid content of LPC and LPE in WT, pPLAIIIγ-KO and -OE seedlings; (b) lysophospholipid species in WT, KO and OE lines; (c) total FFA content in WT, KO and OE lines; (d) FFA molecules species in WT, KO and OE lines. Values are means ± SE (n = 5 separate samples). Asterisks indicate significant differences from WT by Student’s t-test at p = 0.05.
Figure 7
Figure 7
Transcript levels of pPLAIIIγ and SOS genes in WT, KO and OE lines under 0 and 100-mM NaCl. Transcript level of pPLAIIIγ measured by qPCR in leaves and roots of WT with and without 100-mM NaCl at different time points (1–24 h). Transcript levels of SOS2, SOS3, AtCBL10 quantified by qPCR in roots of WT and KO seedlings with treatments as above. UBQ10 was used as internal control and data represent means ± SE (n = 4 technical repeats). asterisk presents a significant difference at 0.05 level by Students’ t-test.

Similar articles

Cited by

References

    1. Wang X. Lipid signaling. Curr. Opin. Plant Biol. 2004;7:329–336. doi: 10.1016/j.pbi.2004.03.012. - DOI - PubMed
    1. Hong Y., Zhao J., Guo L., Kim S.C., Deng X., Wang G., Zhang G., Li M., Wang X. Plant phospholipases D and C and their diverse functions in stress responses. Prog. Lipid Res. 2016;62:55–74. doi: 10.1016/j.plipres.2016.01.002. - DOI - PubMed
    1. Munnik T., Testerink C. Plant phospholipid signaling: “In a nutshell”. J. Lipid Res. 2009;50:S260–S265. doi: 10.1194/jlr.R800098-JLR200. - DOI - PMC - PubMed
    1. Hong Y., Pan X., Welti R., Wang X. Phospholipase Dα3 is involved in the hyperosmotic response in Arabidopsis. Plant Cell. 2008;20:803–816. doi: 10.1105/tpc.107.056390. - DOI - PMC - PubMed
    1. Munnik T., Vermeer J.E.M. Osmotic stress-induced phosphoinositide and inositol phosphate signalling in plants. Plant Cell Environ. 2010;33:655–669. doi: 10.1111/j.1365-3040.2009.02097.x. - DOI - PubMed

LinkOut - more resources