Review
. 2020 Aug 31:21:37-54.
doi: 10.1146/annurev-genom-121719-010946. Epub 2020 May 22.

Enhancer Predictions and Genome-Wide Regulatory Circuits

Affiliations
Review

Enhancer Predictions and Genome-Wide Regulatory Circuits

Michael A Beer et al. Annu Rev Genomics Hum Genet. .

Abstract

Spatiotemporal control of gene expression during development requires orchestrated activities of numerous enhancers, which are cis-regulatory DNA sequences that, when bound by transcription factors, support selective activation or repression of associated genes. Proper activation of enhancers is critical during embryonic development, adult tissue homeostasis, and regeneration, and inappropriate enhancer activity is often associated with pathological conditions such as cancer. Multiple consortia [e.g., the Encyclopedia of DNA Elements (ENCODE) Consortium and National Institutes of Health Roadmap Epigenomics Mapping Consortium] and independent investigators have mapped putative regulatory regions in a large number of cell types and tissues, but the sequence determinants of cell-specific enhancers are not yet fully understood. Machine learning approaches trained on large sets of these regulatory regions can identify core transcription factor binding sites and generate quantitative predictions of enhancer activity and the impact of sequence variants on activity. Here, we review these computational methods in the context of enhancer prediction and gene regulatory network models specifying cell fate.

Keywords: cell fate switching; enhancers; gene regulatory networks; machine learning; sequence-based prediction.


Figures

Figure 1.
Figure 1.. Overview of the in situ perturbation screening strategy to uncover core regulators based on lineage reporters.
Figure 2.
Figure 2.. Cell specific gene regulatory network model.
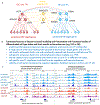
A model of the ESC and DE cell states (a) consistent with observations (b) from our sequence based computational analysis, perturbative studies, and functional studies of the ESC-DE transition, where the activity of a small set of core regulators interact through local enhancers and target a large number peripheral gene enhancers. (c) Functional studies show that these core TFs and bind cooperatively at enhancers specific to ESC or DE states, and that shared cofactors shuttle between binding cooperatively with different sets of the core factors active in each state across the transition.
Figure 3.
Figure 3.. gkm-SVM gapped kmer weight distribution quantifies contribution of TF binding to cell-specific chromatin accessibility.
(a) Gapped kmer weights for gkm-SVM trained on lymphoblast DHS. (b) Mapping to full 10-mers produces an equivalent SVM scoring function. (14) (c) The long positive tail of this weight distribution specifies relative rank of binding site strength for a set of active TFs in lymphoblasts. Highlighted in red: (a) gapped kmers (b) top 10-mer GGAAATCCCC, and (c) PWM for NFkB.
Figure 4.
Figure 4.. Detecting ESC and DE TF regulators.
TFBS mapping to the tail of the gkm-SVM weight distribution trained on differentially active ATAC-seq regions (AUROC=.92) (a) Here gkm-SVM is trained on DE d1 open (blue) vs. ESC open (red) ATAC-seq regions and (b) detects the core DE d1 specific TFs (blue) and ESC specific TFs (red). Each dot in (b) is a distinct kmer. From the two ATAC-seq experiments a set of core regulators for the ESC and DE states can be found.
Figure 5.
Figure 5.. Similar TF vocabulary identified in human islets and stem cell derived pancreatic progenitors.
a) ATAC-seq data from Human Islets(51, 67) and our ATAC-seq data generated in PP1 pancreatic progenitors(42) in the KCNJ11-ABCC8 T2D associated locus detect peaks with islet specific PCHI-C interactions(51). (b) gkm-SVM detects overlapping regulatory programs in ATAC peaks from PP1 and islets and detects known islet regulators.
Fig 6.
Fig 6.. Comparisons of deltaSVM predictions and MPRA expression change.
(a) Overall correlation across 15 tested elements improves from C=.39 to C=.58 when trained on multiple ENCODE datasets(46). (b) IRF4 enhancer, C=.73 (c) and LDLR promoter, C=.81.
Figure 7.
Figure 7.. Analysis of a simple non-cooperative model of cell-state bifurcation transitions driven by autoregulation and negative feedback.
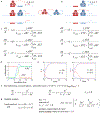
a,b) Bistable genetic circuit where genes A and B auto-activate their own transcription by binding an enhancer driving their own expression but interfere with or repress the transcription of the other TF. c) Rate equations describing the evolution of concentrations of TF A and B under this model. d) Stochastic simulations of this simple circuit show how transitions from the high A to high B state can be induced by external simulation and qualitatively agree with experimentally observed transition rates.(43) e) Concentration dependence of transcription rate of gene A according to this model. f) Bistable solutions and cell-state transitions exist for some parameter choices (t=3.8, k=2) but not others (t=3.8, k=0.9). g) Normalized system of equations for stability analysis. h) Fixed points of this system. i) Stability analysis shows that system is only bistable for k>1, which requires possibly unrealistically strong negative feedback.
Figure 8.
Figure 8.. Analysis of cooperative model of cell-state bifurcation transitions.
a,b) Bistable genetic circuit where genes A,B,C and X,Y,Z cooperatively auto-activate their own transcription by binding an enhancer driving their own expression, but interfere with or repress the transcription of the other three TFs. c) Rate equations describing the evolution of concentrations of TF A,B,C and X,Y,Z under this model. d) Stochastic simulations of this simple circuit show how transitions from the high ABC to high XYZ state can be induced by external stimulation of A. e) For the cooperative model, bistable solutions and cell-state transitions exist for a much broader range of parameter choices; now both (t=3.8, k=2) and (t=3.8, k=0.2) support bistable behavior. f) Normalized system of equations for stability analysis. g) Stability analysis shows that the cooperative system is bistable for all choices of k, as long as transcription is not weak (t>1.9).

References

    1. Agius P, Arvey A, Chang W, Noble WS, Leslie C. 2010. High Resolution Models of Transcription Factor-DNA Affinities Improve In Vitro and In Vivo Binding Predictions. PLoS Comput Biol. 6(9):e1000916. - PMC - PubMed
    1. Alexander J, Stainier DYR. 1999. A molecular pathway leading to endoderm formation in zebrafish. Current Biology. 9(20):1147–57 - PubMed
    1. Alipanahi B, Delong A, Weirauch MT, Frey BJ. 2015. Predicting the sequence specificities of DNA- and RNA-binding proteins by deep learning. Nat Biotech. 33(8):831–38 - PubMed
    1. Allis CD, Jenuwein T. 2016. The molecular hallmarks of epigenetic control. Nature Reviews Genetics. 17(8):487–500 - PubMed
    1. Arvey A, Agius P, Noble WS, Leslie C. 2012. Sequence and chromatin determinants of cell-type-specific transcription factor binding. Genome Res. 22(9):1723–34 - PMC - PubMed

Publication types

LinkOut - more resources