. 2020 Jul 7;10(7):2423-2434.
doi: 10.1534/g3.120.401207.

Support Vector Machine for Lung Adenocarcinoma Staging Through Variant Pathways

Affiliations

Support Vector Machine for Lung Adenocarcinoma Staging Through Variant Pathways

Feng Di et al. G3 (Bethesda). .

Abstract

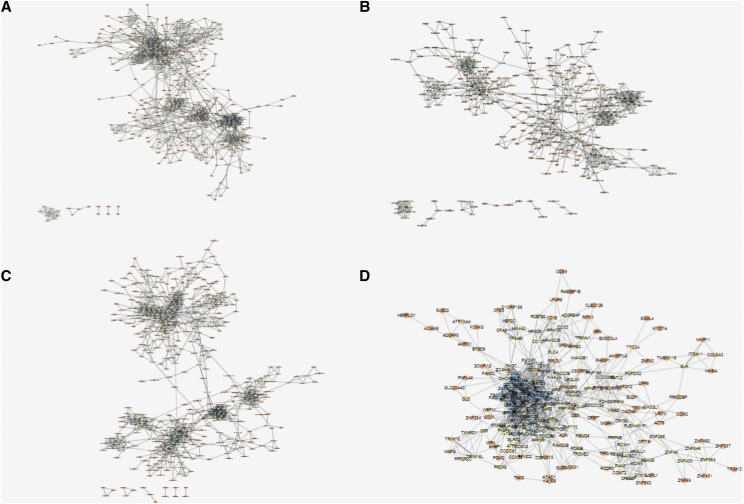
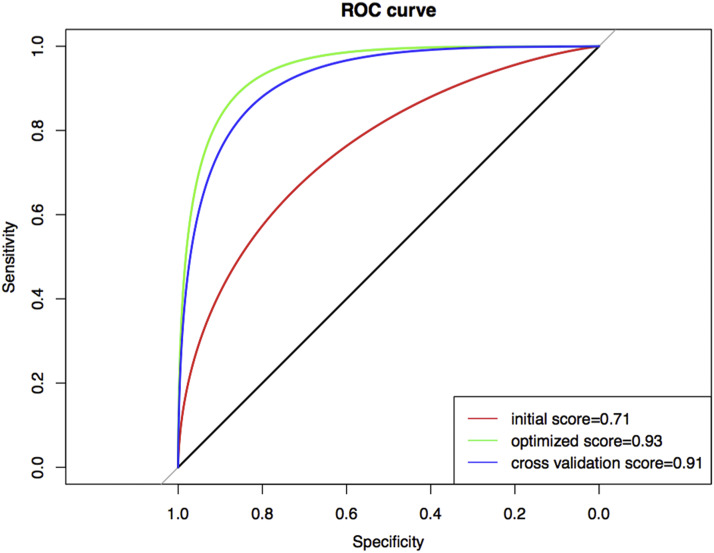
Lung adenocarcinoma (LUAD) is one of the most common malignant tumors. How to effectively diagnose LUAD at an early stage and make an accurate judgement of the occurrence and progression of LUAD are still the focus of current research. Support vector machine (SVM) is one of the most effective methods for diagnosing LUAD of different stages. The study aimed to explore the dynamic change of differentially expressed genes (DEGs) in different stages of LUAD, and to assess the risk of LUAD through DEGs enriched pathways and establish a diagnostic model based on SVM method. Based on TMN stages and gene expression profiles of 517 samples in TCGA-LUAD database, coefficient of variation (CV) combined with one-way analysis of variance (ANOVA) were used to screen out feature genes in different TMN stages after data standardization. Unsupervised clustering analysis was conducted on samples and feature genes. The feature genes were analyzed by Pearson correlation coefficient to construct a co-expression network. Fisher exact test was conducted to verify the most enriched pathways, and the variation of each pathway in different stages was analyzed. SVM networks were trained and ROC curves were drawn based on the predicted results so as to evaluate the predictive effectiveness of the SVM model. Unsupervised hierarchical clustering analysis results showed that almost all the samples in stage III/IV were clustered together, while samples in stage I/II were clustered together. The correlation of feature genes in different stages was different. In addition, with the increase of malignant degree of lung cancer, the average shortest path of the network gradually increased, while the closeness centrality gradually decreased. Finally, four feature pathways that could distinguish different stages of LUAD were obtained and the ability was tested by the SVM model with an accuracy of 91%. Functional level differences were quantified based on the expression of feature genes in lung cancer patients of different stages, so as to help the diagnosis and prediction of lung cancer. The accuracy of our model in differentiating between stage I/II and stage III/IV could reach 91%.

Keywords: co-expression; diagnostic model; functional pathway; lung adenocarcinoma.


Figures

Figure 1
Figure 1
The distribution of CV in genes. The x axis is CV and the y axis is the distribution of density. The red and green vertical lines represent 75% and 25% of the quantile, respectively. Therefore, genes with CV greater than 0.08 or less than -0.07 are considered to have greater abnormal expression in LUAD.
Figure 2
Figure 2
Venn diagram of four stage feature genes The four stages in the figure are marked with four colors. The intersection of any two stages represents the significant difference between the shared genes in the two stage samples.
Figure 3
Figure 3
311 genes are used for unsupervised clustering analysis of four lung cancer stages The x axis represents the samples and the y axis represents the genes. Four colors are used to mark the LUAD samples with different cancer stages, blue for stage I group, green for stage II group, red for stage III group, and black for stage IV group. The red blocks represent up-regulated genes and green blocks represent down-regulated genes.
Figure 4
Figure 4
Correlation analysis of feature genes in 4 stages Each color block corresponds to the correlation coefficient of two genes, red for positive correlation while blue for negative correlation.
Figure 5
Figure 5
Co-expression network diagram of four stage feature genes A to D corresponds stage I, stage II, stage III, stage IV group, respectively. The closer the node color is to blue, the higher the node degree is in the network. The closer the node color is to red, the lower the node degree is. Edges between nodes represent the correlation coefficient, and the stronger the correlation, the thicker the edge.
Figure 6
Figure 6
Analysis of network topological properties of four stages Analysis of 4 network topological properties, including ASP, Degree, Closeness Centrality and Cluster Coefficient. ASP measures the average state of the shortest path of a gene to other nodes in the network. Therefore, the shorter the ASP is, the more convergent the network is and the higher the signal transmission efficiency is. Degree measures the number of adjacent nodes connected by a gene in the network. Higher degree indicates that more adjacent nodes can be affected by the gene and the signal transmission efficiency is higher. Closeness Centrality reflects the degree of proximity between one node and other nodes in the network. The smaller the Closeness Centrality is, the stronger the network contractility and the closer the distance between the genes are. Cluster Coefficient represents the ability of adjacent nodes in a graph to form a complete graph. There may be submodules such as connected branches in the network with high Cluster Coefficient.
Figure 7
Figure 7
GO enrichment analysis of feature genes in four stages A-D corresponds to the pathway enrichment results of stage I-IV, respectively. The X-axis is the pathway term, and the Y-axis is the p value of the negative logarithmic transformation. We labeled the number of genes enriched in the pathway by dark blue and light blue. The brighter the color is, the more genes are enriched in the pathway, and darker color indicates fewer enriched genes.
Figure 8
Figure 8
Dynamic change of 12 enriched pathways in 4 stages Stage I- IV are marked in red, green, blue, and purple respectively.
Figure 9
Figure 9
Boxplot visualizes the functional imbalance scores of 12 pathways in four stages Score boxplots of 12 pathways in stages showed the median value and confidence intervals, respectively. The four stage groups were also marked in red, green, blue and purple, respectively.
Figure 10
Figure 10
The ROC curves for accuracy evaluation of the SVM model The ROC curve evaluates the classification effectiveness of the model. The red curve is the initial model precision. The green curve is the precision of the model after feature selection and parameter optimization. The blue curve is the average precision calculated by fivefold cross validation method. In the process of cross-validation, samples are randomly shuffled each time. Four samples are taken for training and one was predicted. The X-axis represents false positive rate and the Y-axis represents true positive rate.

Similar articles

Cited by

References

    1. Banat G. A., Tretyn A., Pullamsetti S. S., Wilhelm J., Weigert A. et al. , 2015. Immune and Inflammatory Cell Composition of Human Lung Cancer Stroma. PLoS One 10: e0139073 10.1371/journal.pone.0139073 - DOI - PMC - PubMed
    1. Bishara A. J., and Hittner J. B., 2012. Testing the significance of a correlation with nonnormal data: comparison of Pearson, Spearman, transformation, and resampling approaches. Psychol. Methods 17: 399–417. 10.1037/a0028087 - DOI - PubMed
    1. Blumenthal D. T., Artzi M., Liberman G., Bokstein F., Aizenstein O. et al. , 2017. Classification of High-Grade Glioma into Tumor and Nontumor Components Using Support Vector Machine. AJNR Am. J. Neuroradiol. 38: 908–914. 10.3174/ajnr.A5127 - DOI - PMC - PubMed
    1. Cassim S., Chepulis L., Keenan R., Kidd J., Firth M. et al. , 2019. Patient and carer perceived barriers to early presentation and diagnosis of lung cancer: a systematic review. BMC Cancer 19: 25 10.1186/s12885-018-5169-9 - DOI - PMC - PubMed
    1. Chalela R., Curull V., Enriquez C., Pijuan L., Bellosillo B. et al. , 2017. Lung adenocarcinoma: from molecular basis to genome-guided therapy and immunotherapy. J. Thorac. Dis. 9: 2142–2158. 10.21037/jtd.2017.06.20 - DOI - PMC - PubMed

LinkOut - more resources