. 2020 Sep;10(9):1388-1409.
doi: 10.1158/2159-8290.CD-19-1436. Epub 2020 May 22.

Posttranslational Regulation of the Exon Skipping Machinery Controls Aberrant Splicing in Leukemia

Affiliations

Posttranslational Regulation of the Exon Skipping Machinery Controls Aberrant Splicing in Leukemia

Yalu Zhou et al. Cancer Discov. 2020 Sep.

Abstract

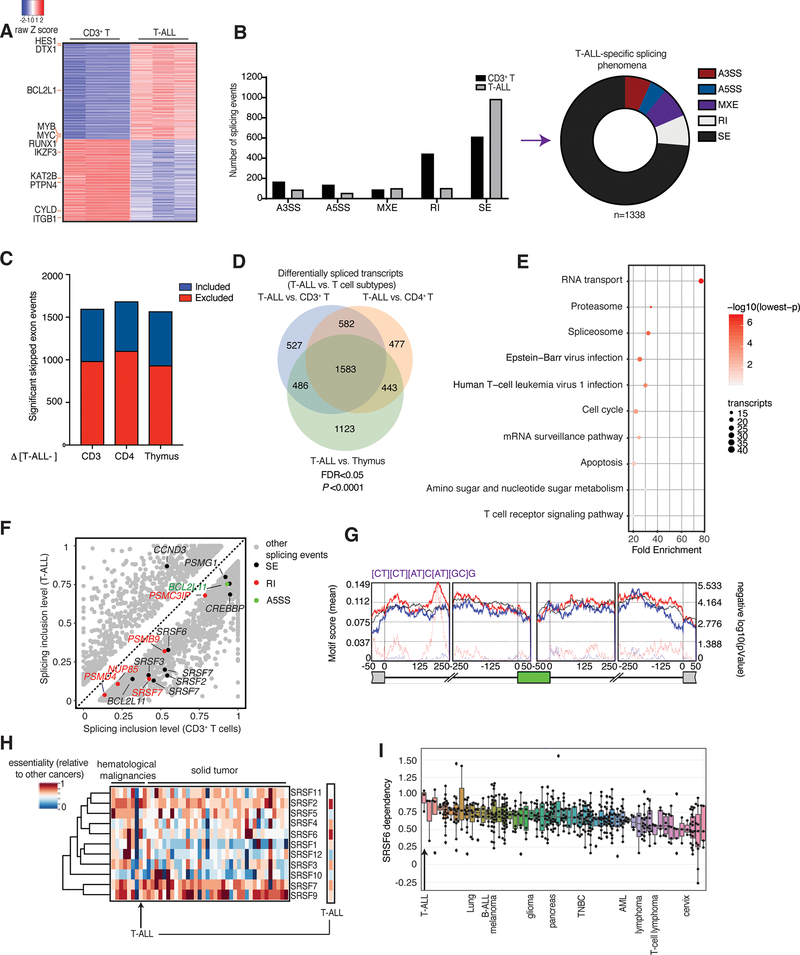
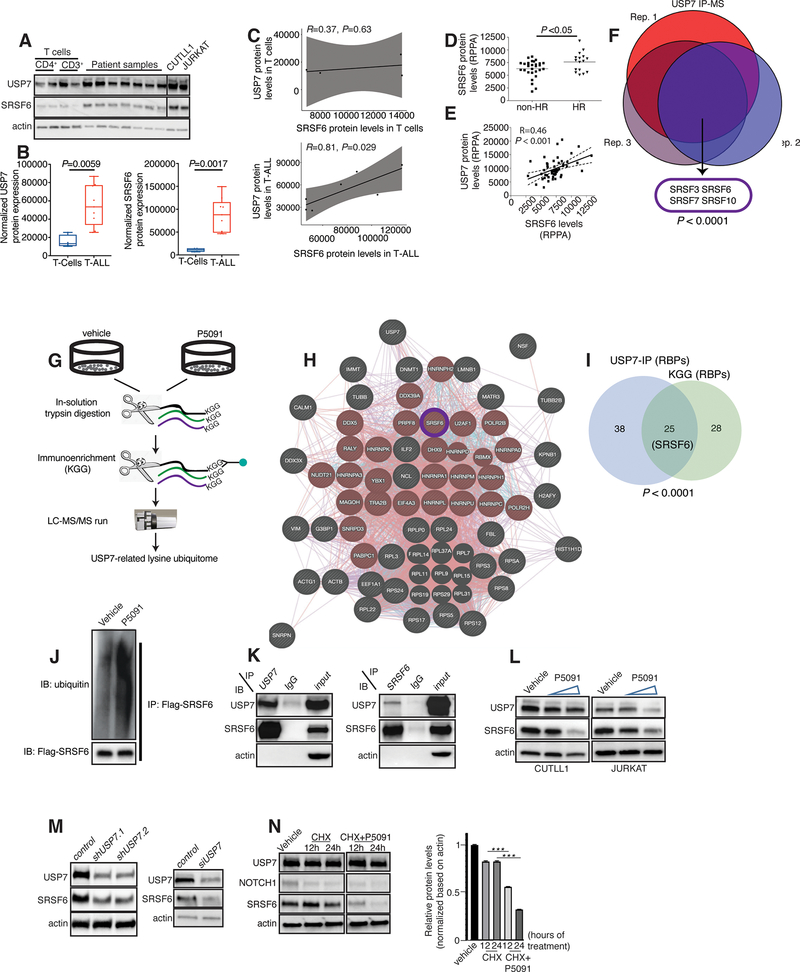
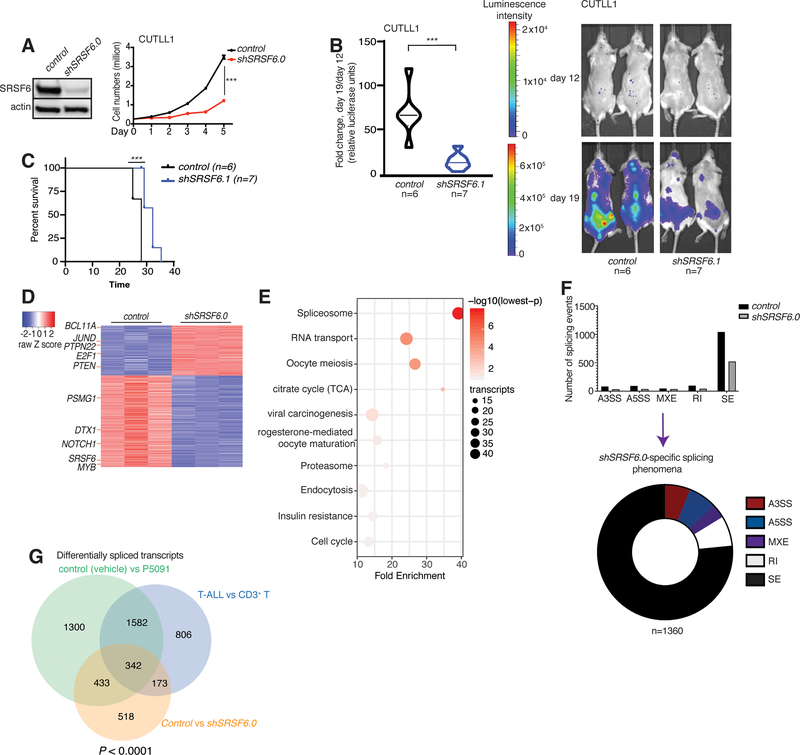
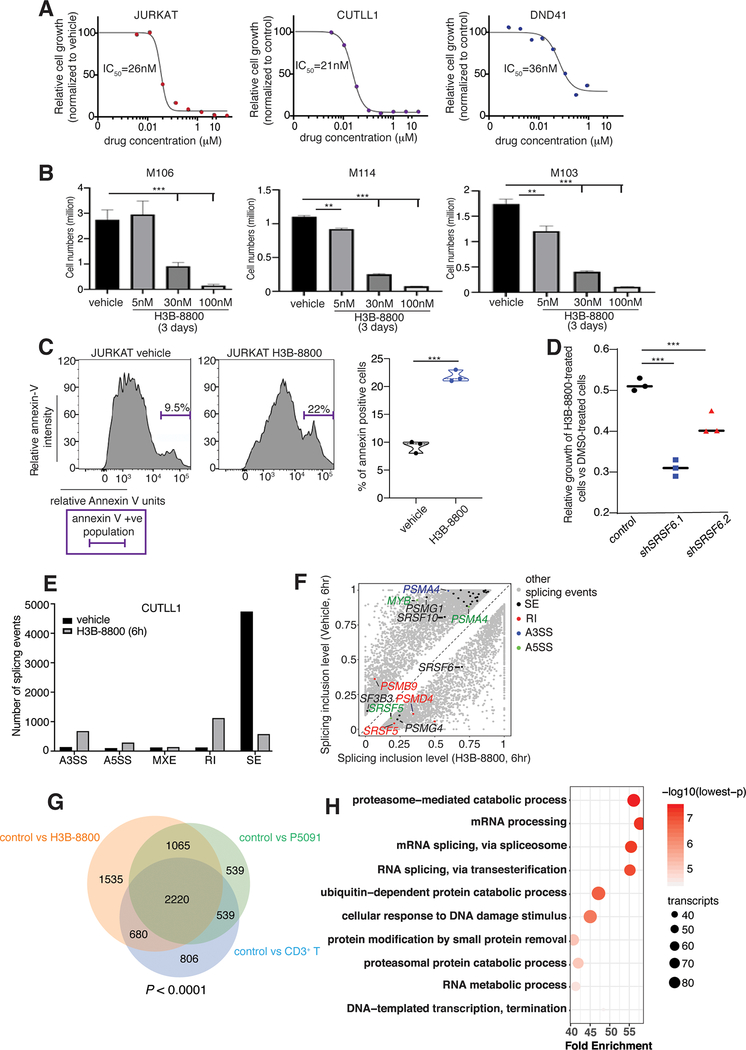
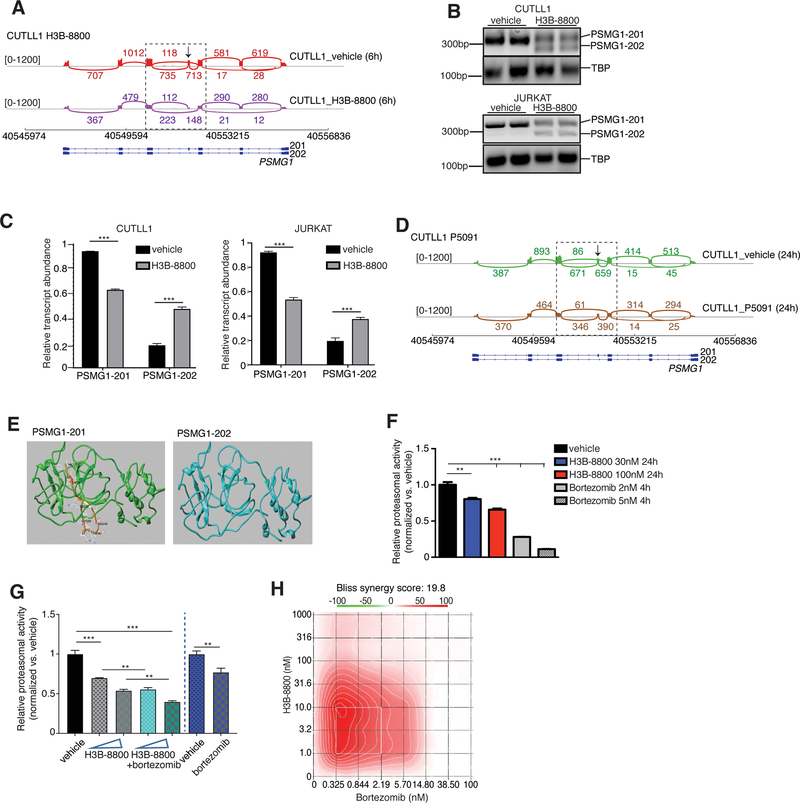
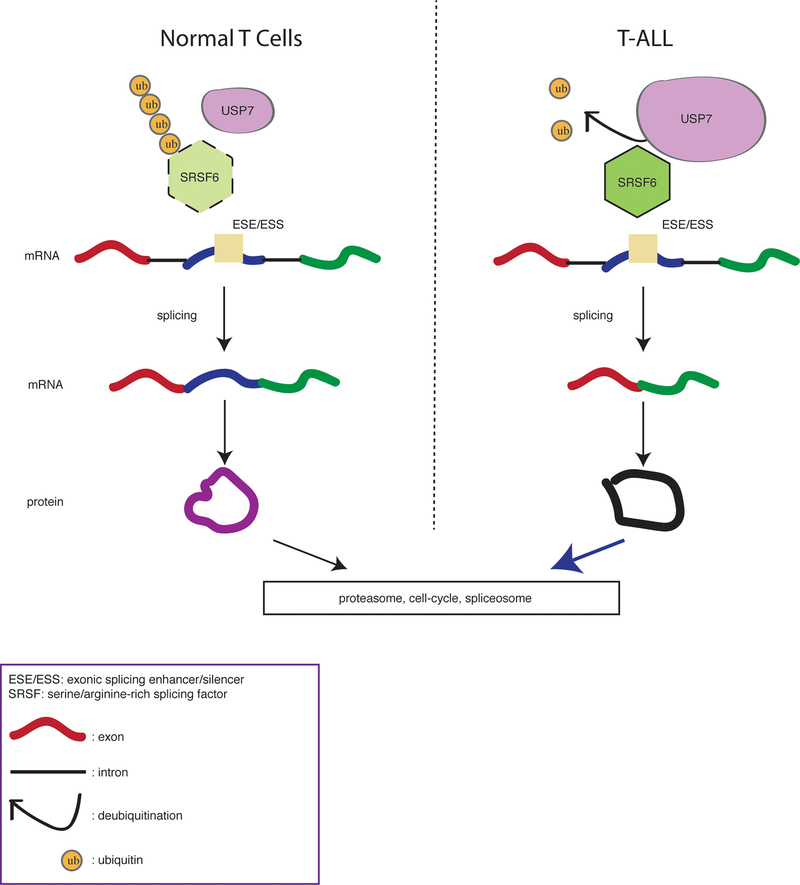
Splicing alterations are common in diseases such as cancer, where mutations in splicing factor genes are frequently responsible for aberrant splicing. Here we present an alternative mechanism for splicing regulation in T-cell acute lymphoblastic leukemia (T-ALL) that involves posttranslational stabilization of the splicing machinery via deubiquitination. We demonstrate there are extensive exon skipping changes in disease, affecting proteasomal subunits, cell-cycle regulators, and the RNA machinery. We present that the serine/arginine-rich splicing factors (SRSF), controlling exon skipping, are critical for leukemia cell survival. The ubiquitin-specific peptidase 7 (USP7) regulates SRSF6 protein levels via active deubiquitination, and USP7 inhibition alters the exon skipping pattern and blocks T-ALL growth. The splicing inhibitor H3B-8800 affects splicing of proteasomal transcripts and proteasome activity and acts synergistically with proteasome inhibitors in inhibiting T-ALL growth. Our study provides the proof-of-principle for regulation of splicing factors via deubiquitination and suggests new therapeutic modalities in T-ALL. SIGNIFICANCE: Our study provides a new proof-of-principle for posttranslational regulation of splicing factors independently of mutations in aggressive T-cell leukemia. It further suggests a new drug combination of splicing and proteasomal inhibitors, a concept that might apply to other diseases with or without mutations affecting the splicing machinery.This article is highlighted in the In This Issue feature, p. 1241.


Conflict of interest statement

Competing Interests: Ping Zhu is an employee at H3 Biomedicine. The other authors have no conflicts of interest.

Figures

Fig. 1.
Fig. 1.. Extensive changes in exon skipping phenomena in T-ALL compared to physiological T cells.
A, Heatmap of gene expression changes representing 630 significantly up-regulated genes and 531 down-regulated genes in T-ALL patient samples compared to CD3+ T cells, ranked based on expression level in T-ALL (n=3, adj. P<0.01). B, Differential splicing in T-ALL versus CD3+ T cells. Bar graph (left) represents different types of splicing events; pie chart (right) shows T-ALL specific splicing phenomena (correspond to the grey bars). The plot represents the MATS analysis using three biological replicates per group. Only events that passed the statistics threshold (FDR, false discovery rate <0.05) and percent spliced in (PSI) > 0.1 (10% of the transcripts of a given gene) are taken into consideration. Exon skipping (SE) is the type of event affected most significantly. A3SS, alternative 3’ splice sites; A5SS, alternative 5’ splice sites; MXE, mutually exclusive exons; RI, intron retention. C, Directionality of exon skipping in T-ALL compared to T-cell subtypes, where positive (blue) and negative (red) values represent exon inclusion and exclusion, respectively. Please note there is a higher number of skipped exons in T-ALL (red) compared to any T cell subtype. Panels B and C collectively show that there are more skipped exons in T-ALL compared to normal T cells. D, Overlapping transcripts affected by splicing changes in T-ALL compared to CD3+ T cells, CD4+ T cells, and thymocytes (FDR <0.05). E, Kyoto Encyclopedia of Genes and Genomes (KEGG) analysis showing main transcript pathways enriched in splicing events in T-ALL compared to CD3+ T cells. Transcript categories are ranked based on the enrichment score, P value and size of the group. F, Scatterplot of splicing changes and distribution in T-ALL compared to CD3+ T cells. Selected transcripts are colored based on the type of differentially spliced event. Transcripts presenting PSI>0.1 are shown. G, De novo binding motif discovery based on exon skipping data (including the skipped exon and flanking intron/exon sequences) in T-ALL vs. CD3+ T cells using rMAPS. SRSF6-bound motif enrichment in skipped exons in T-ALL (red) and in included exons in CD3+ T-cells (in blue) is shown. Background motif enrichment is shown in black and -log (p Value) over the background is represented by red and blue dotted lines. H, Relative essentiality of the SRSF gene family across different types of cancer cell lines. Essentiality data, reflecting the importance of individual genes for cellular fitness, was obtained from the Project Achilles CRISPR-Cas9 screening dataset of 563 cancer cell lines. I, Essentiality for SRSF6 amongst different cancer types from the Project Achilles. A gene essentiality score of 1 is typical for genes considered pan-essential, such as ribosome components. T-ALL and other representative cancer types are shown. B-ALL, B cell acute lymphoblastic leukemia; TNBC, triple-negative breast cancer; AML, acute myeloid leukemia.
Fig. 2.
Fig. 2.. Posttranslational regulation of SRSF6 by USP7.
A, Immunoblot showing SRSF6 protein levels in normal CD4+ T-cells (n=2) and CD3+ T cells (n=2), T-ALL patients (n=7), and CUTLL1 and JURKAT cells. B, C, Quantification of immunoblot bands presented in A. USP7 and SRSF6 protein levels are higher in T-ALL compared to T cells (B). USP7 protein levels significantly correlate with SRSF6 levels in T-ALL (C). Actin is used as a loading control. D, E, RPPA analysis for SRSF6 protein levels in HR (n=16) vs. non-HR T-ALL (n=31) cases (D) and correlation with USP7 expression (E). F, USP7 immunoprecipitation coupled to mass spectrometry (IP-MS) analysis in JURKAT cells. Shown is the overlap of USP7-associated proteins across 3 biological replicates, revealing splicing factors associated with USP7. G, Schematic representation of the USP7-related lysine ubiquitome analysis in JURKAT cells. H, Network analysis of the overlapped proteins of USP7 immunoprecipitation-mass spectrometry and KGG mass spectrometry using GeneMANIA. Splicing related proteins are highlighted in red. I, Analysis of the overlapping data sets for USP7 immunoprecipitation-mass spectrometry and KGG mass spectrometry studies reveals a significant number of RNA binding proteins in common (25, P< 0.0001). J, Immunoblot for detection of ubiquitination upon lentiviral expression of Flag-tagged SRSF6 in CUTLL1 cells coupled to treatment with P5091. The Flag epitope was used for SRSF6 pulldown. A representative blot for one biological replicate of vehicle- and P5091-treated CUTLL1 cells for the pull-down is shown. K, Immunoblots (WB) following immunoprecipitation (IP) of USP7 (left panel) and SRSF6 (right panel) in JURKAT cells, showing interaction of USP7 and SRSF6. L, Immunoblot studies for USP7 and SRSF6 using CUTLL1 and JURKAT cells upon treatment with increasing concentrations of P5091. Actin is used as a loading control. M, Immunoblot studies for USP7 and SRSF6 upon silencing of USP7 using two different short-hairpin RNAs in CUTLL1 cells (left panel) or siRNA over a period of 96h in 293T cells (right panel). Actin is used as a loading control. N, Immunoblot analysis for SRSF6 levels upon treatment with cycloheximide (CHX, 200μg/ml), or combination of CHX with P5091 (10μM) over a period of 24h. Representative blot from one out of three experiments (left) and quantification of protein levels from three experiments (right) are shown (***, P<0.001).
Fig. 3.
Fig. 3.. SRSF6 silencing inhibits T-ALL growth.
A, Immunoblot analysis of SRSF6 protein levels (left) as well as growth of control- and shSRSF6-expressing CUTLL1 cells over a period of 5 days (n=3, right panel, *** P<0.001). Actin is used as loading control. B, Luciferase-expressing CUTLL1 cells were transduced with lentiviral vector expressing a control hairpin RNA or shSRSF6.1, selected using puromycin for a period of 7 days, and injected intravenously into immunocompromised mice. Leukemic burden was assessed via blast detection in mouse body using bioluminescence and IVIS equipment twice per week. Relative bioluminescence intensity is shown for two representative mouse per treatment group on days 12 and 19 of treatment (right panel). The fold change in total flux from day 12 to day 19 is shown on the left (control, n=6; shSRSF6.1, n=7, *** P<0.001). C, Survival analysis of mice transplanted with control hairpin RNA or shSRSF6.1-expressing CUTLL1 cells (control, n=6; shSRSF6.1, n=7, *** P<0.001). D, Heatmap of changes in gene expression representing 543 significantly up-regulated genes and 1001 down-regulated genes in shSRSF6.0-expressing compared to control JURKAT cells (adj. P<0.01). E, Kyoto Encyclopedia of Genes and Genomes (KEGG) analysis showing main transcript pathways enriched for gene expression changes in shSRSF6.0-expressing JURKAT cells compared to the control JURKAT population. F, Splicing analysis in the shSRSF6.0 sample and comparison to control JURKAT cells. Bar graph (top) represents different types of splicing events in each genotype, pie chart (bottom) shows shSRSF6.0-specific splicing phenomena. Skipped exons (SE) is the main event category. The plot represents the MATS analysis using three biological replicates per group. Only events that passed the statistics threshold (FDR<0.05) and present with PSI>0.1 are presented. G, Overlap of transcripts presenting with splicing changes in DMSO (vehicle) vs. P5091, CD3+ T cells vs. T-ALL cells, as well as control vs. shSRSF6.0 conditions. Analysis shows 342 genes common in all comparisons (P<0.0001).
Fig. 4.
Fig. 4.. Inhibition of splicing blocks the growth of T-cell leukemia tumors.
A, IC50 curves of splicing inhibition using H3B-8800 in T-ALL cell lines (JURKAT, CUTLL1, DND41) over a period of 72h. To study cell growth, 3,000 cells per well were used and incubated with alamarBlue for 4 h. B, Cell numbers for three patient samples treated with vehicle and increasing concentrations of H3B-800 up to 100nM over a 72h period. Live human T-cell leukemia cell populations were measured using cytometry and staining with hCD7 and hCD45 antibodies (***, P < 0.001). C, Annexin V staining plots (left panel) and quantification (right panel) upon treatment with 30 nM H3B-8800 over a period of 48 h in JURKAT T-ALL cells (n=3, ***, P<0.001). D, Relative growth of H3B-8800-treated cells compared to vehicle-treated cells is shown for control, shSRSF6.1, and shSRSF6.2-expressing CUTLL1 cell populations. shSRSF6.1-expressing cells present with an increased sensitivity to splicing inhibition compared to control cells (n=3, ***, P<0.001). E, Number of splicing events in CUTLL1 cells upon treatment with H3B-8800 for 6 h versus DMSO (vehicle). Retained introns (RI) and skipped exons (SE) were the two event categories affected most dramatically. The plot represents the MATS analysis using three biological replicates per group. Only events that passed the statistics threshold (FDR <0.05) and percent spliced in (PSI) > 0.1 are presented. F, Scatterplot of splicing changes and distribution in H3B-8800-treated CUTLL1 cells (6h) compared to vehicle-treated CUTLL1 cells. Selected transcripts are colored by the type of differentially spliced event. Splicing is quantified using a “percent spliced in” value (PSI, or ψ value) and changes affecting at least 10% of transcripts are presented. G, Overlapping of transcripts affected by splicing changes in vehicle-treated JURKAT cells in comparison to H3B-8800- and P5091-treated JURKAT cells as well as CD3+ T cells. Analysis identified 2220 transcripts alternatively spliced in vehicle-treated JURKAT cells compared to the three other conditions. H, Gene ontology analysis of 2220 overlapping genes from (G) showing enrichment of critical transcript families, including the proteasome- and spliceosome machinery-encoding transcripts.
Fig. 5.
Fig. 5.. Extensive splicing changes affecting proteasome subunits is a vulnerability in T-cell leukemia.
A, Sashimi plots representing splicing and exon-exon junctions for the PSMG1 transcript in CUTLL1 cells treated with 30nM H3B-8800 for 6 h. DNA/gene is shown along the horizontal axis. Thicker sections represent exons coding for protein sequence. Numbers over the lines connecting exons represent the number of reads mapped to that exon-exon junction. B, PCR-based analysis coupled to electrophoresis for detection of PSMG1–201 and PSMG-202 isoforms upon H3B-8800 treatment (30nM, 6h) using CUTLL1 (top panel) and JURKAT cells (bottom panel). C, Quantification of band intensities presented in B. * * * P≤0.001. D, Sashimi plots representing splicing and exon-exon junctions for the PSMG1 transcript in CUTLL1 cells treated with 10μM P5091 for 24 h. RNA sequence is shown along the horizontal axis. Thicker sections represent exons coding for protein sequence. Numbers over the lines connecting exons represent the number of reads mapped to that junction. E, Modeling of PSMG1 protein structure changes upon H3B-8800 treatment. Structures of constructs 201 and 202 (consensus coding sequence (CCDS) CCDS13660 and CCDS13661 correspondingly for protein Q95456) were displayed. Brown and yellow part represents 21 amino acids present in 201 but missing from 202. Amino acids VAL123, GLN136, GLU143, GLN145, LEU150 and CYS152 are highlighted. F, Measurement of proteasome activity using a luminescence-based method upon treatment of JURKAT cells with 30nM and 100nM H3B-8800 for 24h. Bortezomib was used as a positive control for proteasome inhibition (**, P <0.01, ***, P <0.001). G, Measurement of proteasome activity using a luminescence-based method upon treatment of JURKAT cells with 30nM and 100nM H3B-8800 for 24h, alone (grey bars) or in combination with 0.5nM bortezomib (4h treatment, green bars). Bortezomib was used as a positive control for proteasome inhibition (0.5nM, 4h treatment, blue bar, **, P <0.01, ***, P <0.001). H, Synergy heatmaps for proteasomal inhibitor bortezomib and H3B-8800 treatment over a period of 3 days in JURKAT cells. Bliss analysis is shown. This result indicates synergy at the lower dose range for both drugs which might allow for combinatorial drug treatment with minimum toxicity.
Fig. 6.
Fig. 6.. Schematic representation of abnormal splicing via deubiquitination in T-cell leukemia.
T cells exhibit physiological levels of USP7 and SRSF6 coupled to normal splicing. Aberrantly high levels of USP7 (illustrated by the larger size of USP7 scheme in the right panel) contribute to high levels of SRSF6 and exon skipping changes in leukemia.

References

    1. Wang ET et al. Alternative isoform regulation in human tissue transcriptomes. Nature 456, 470–476, doi:10.1038/nature07509 (2008). - DOI - PMC - PubMed
    1. Kim E et al. SRSF2 Mutations Contribute to Myelodysplasia by Mutant-Specific Effects on Exon Recognition. Cancer Cell 27, 617–630, doi:10.1016/j.ccell.2015.04.006 (2015). - DOI - PMC - PubMed
    1. Lee SC et al. Modulation of splicing catalysis for therapeutic targeting of leukemia with mutations in genes encoding spliceosomal proteins. Nat Med 22, 672–678, doi:10.1038/nm.4097 (2016). - DOI - PMC - PubMed
    1. Ntziachristos P, Abdel-Wahab O & Aifantis I Emerging concepts of epigenetic dysregulation in hematological malignancies. Nat Immunol 17, 1016–1024, doi:10.1038/ni.3517 (2016). - DOI - PMC - PubMed
    1. Dvinge H, Kim E, Abdel-Wahab O & Bradley RK RNA splicing factors as oncoproteins and tumour suppressors. Nature reviews. Cancer 16, 413–430, doi:10.1038/nrc.2016.51 (2016). - DOI - PMC - PubMed

Publication types

MeSH terms