. 2020 May 22;5(47):eaax6085.
doi: 10.1126/sciimmunol.aax6085.

IRF5 guides monocytes toward an inflammatory CD11c+ macrophage phenotype and promotes intestinal inflammation

Affiliations

IRF5 guides monocytes toward an inflammatory CD11c+ macrophage phenotype and promotes intestinal inflammation

Alastair L Corbin et al. Sci Immunol. .

Abstract

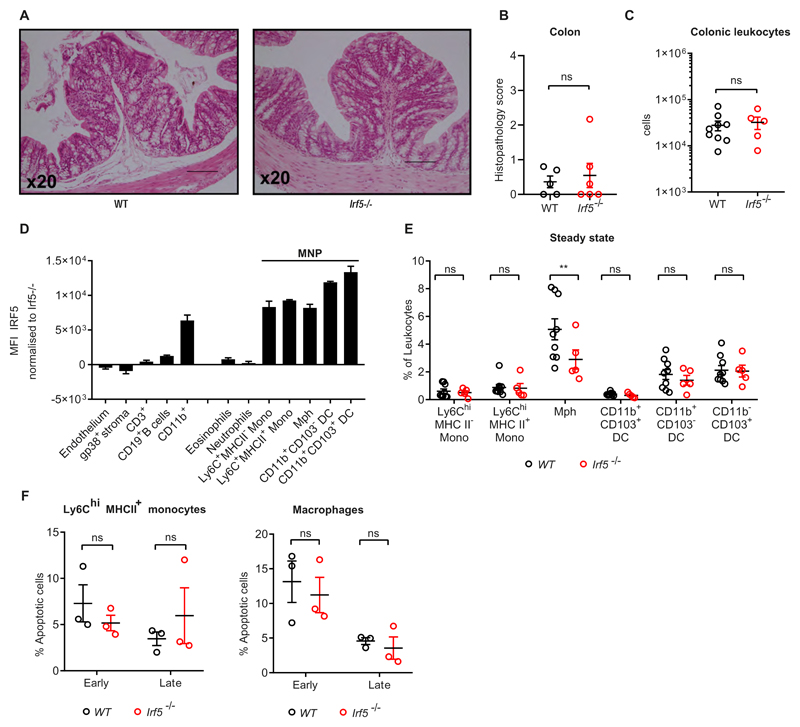
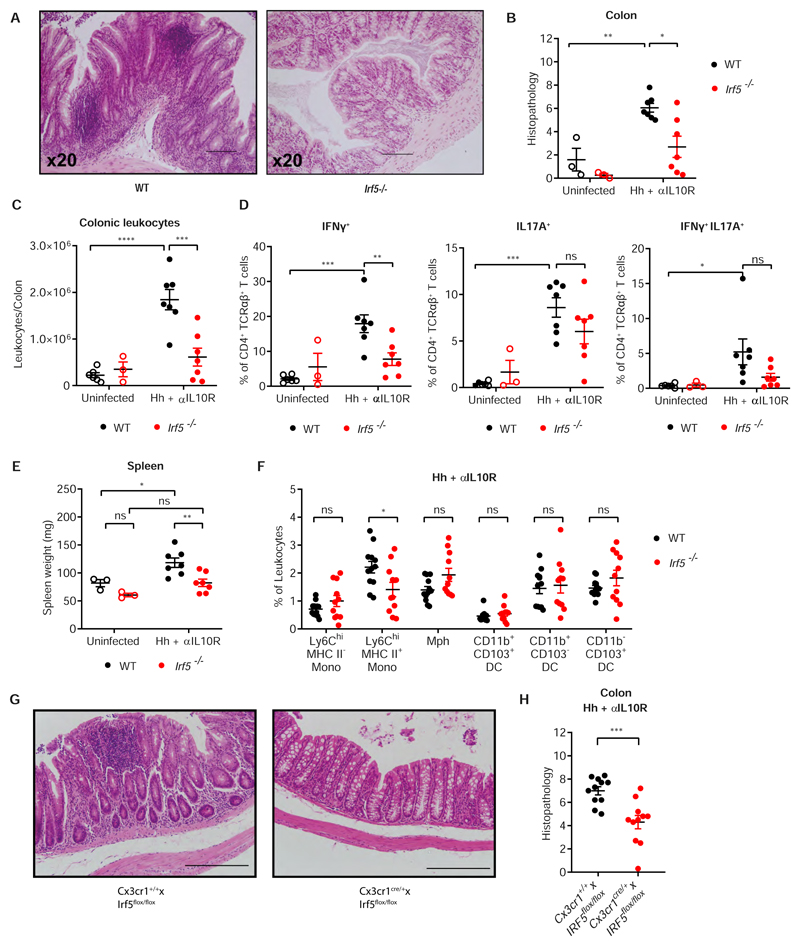
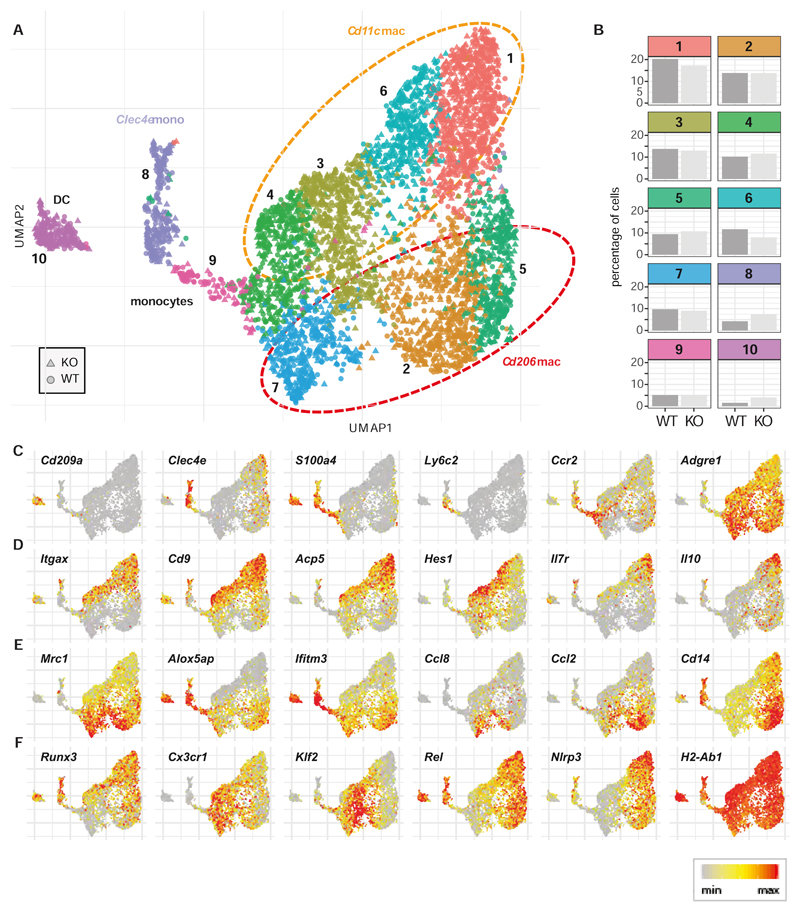
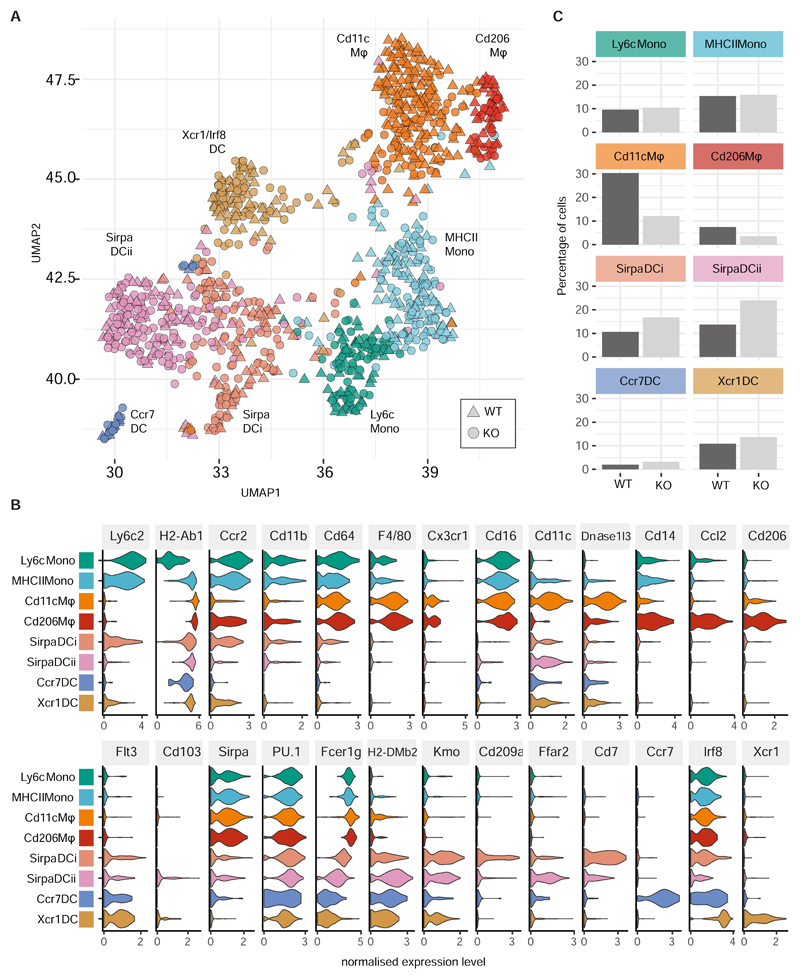
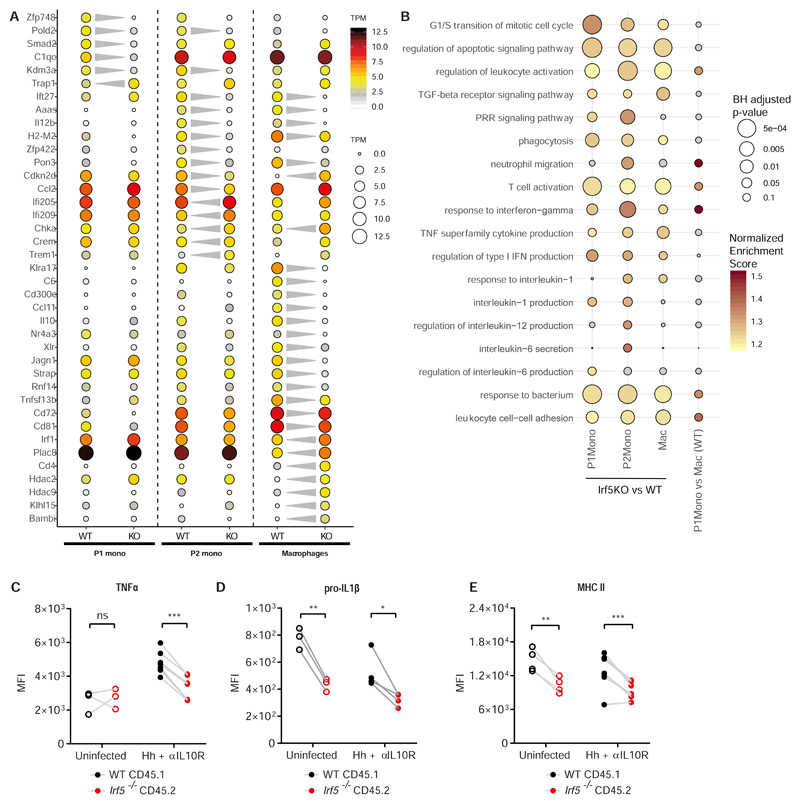
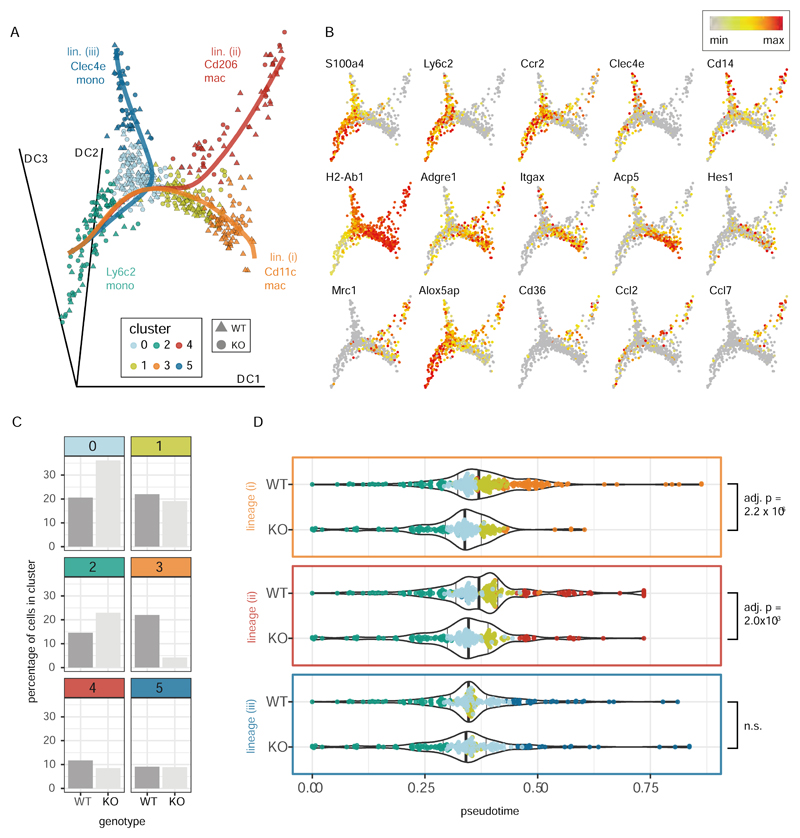
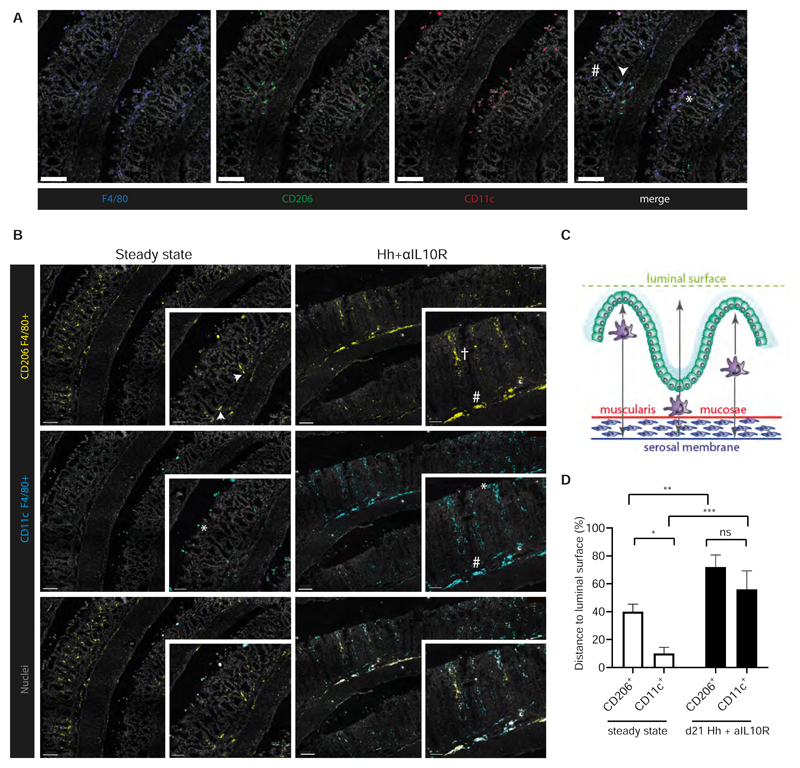
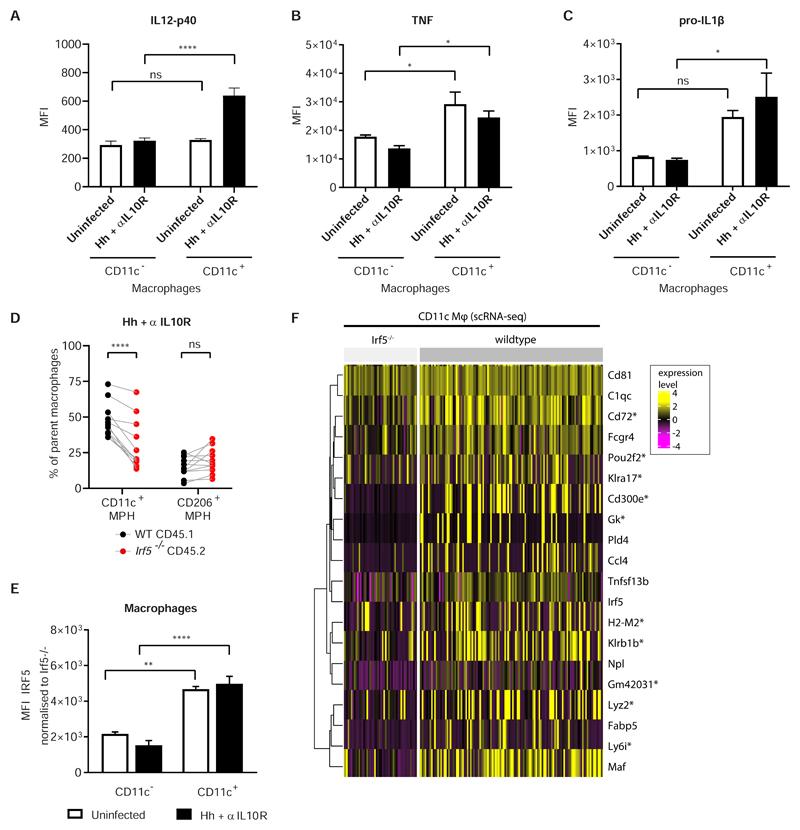
Mononuclear phagocytes (MNPs) are vital for maintaining intestinal homeostasis but, in response to acute microbial stimulation, can also trigger immunopathology, accelerating recruitment of Ly6Chi monocytes to the gut. The regulators that control monocyte tissue adaptation in the gut remain poorly understood. Interferon regulatory factor 5 (IRF5) is a transcription factor previously shown to play a key role in maintaining the inflammatory phenotype of macrophages. Here, we investigate the impact of IRF5 on the MNP system and physiology of the gut at homeostasis and during inflammation. We demonstrate that IRF5 deficiency has a limited impact on colon physiology at steady state but ameliorates immunopathology during Helicobacter hepaticus-induced colitis. Inhibition of IRF5 activity in MNPs phenocopies global IRF5 deficiency. Using a combination of bone marrow chimera and single-cell RNA-sequencing approaches, we examined the intrinsic role of IRF5 in controlling colonic MNP development. We demonstrate that IRF5 promotes differentiation of Ly6Chi monocytes into CD11c+ macrophages and controls the production of antimicrobial and inflammatory mediators by these cells. Thus, we identify IRF5 as a key transcriptional regulator of the colonic MNP system during intestinal inflammation.


Conflict of interest statement

Competing financial interests:

FP received research funding or consultancy fees from GSK, Genentech, Roche and UCB. Other authors declare that they have no competing interests.

Figures

Figure 1
Figure 1. IRF5 deficiency has limited impact on colon physiology at steady-state
A) Representative H&E sections of colons from WT (left) and Irf5-/- (right) mice at steady state. B) Histopathology scoring of WT (n=6) and Irf5-/- (n=5) colons. C) Number of cLPLs retrieved from steady state WT (n=9) and Irf5-/- (n=5) mice. D) IRF5 expression in the steady state cLP of WT mice (n=3). E) The frequency of intestinal MNPs in the cLP of steady state WT (n=9) and Irf5-/- (n=5) mice. F) Quantification of early phase (Annexin V+ Live/Dead-), and late phase (Annexin V+ Live/Dead+) cell death assessed by Annexin V labelling combined with viability dye staining in WT (n=3) and Irf5-/- (n=3) cLP Ly6Chi MHC II+ (P2) monocytes and macrophages using flow cytometry immediately after cell isolation. B, C, E: Data are pooled from two independent experiments. D, F: data are representative of two independent experiments. B, C) Mann-Whitney U test. E, F) Two-Way ANOVA with Sidak correction. Data presented are mean ± SEM, ns = not significant, ** p ≤ 0.01
Figure 2
Figure 2. IRF5 deficiency protects against intestinal inflammation
A) Representative H&E sections of colons from WT (left) and Irf5-/- (right) mice at d21 Hh + αILI0R. B) Histopathology scoring of WT and Irf5-/- colons. C) Number of cLPLs retrieved from steady state and d21 Hh + αILI0R WT and Irf5-/- mice. D) frequencies of IFNγ-, IL17A- and IFNγ/IL17-producing CD4+ T cells in WT and Irf5-/- mice following 4 hours of culture with PMA/Ionomycin and brefeldin assessed by intracellular flow cytometry. E) Spleen weights of WT and Irf5-/- mice at steady state and d21 Hh + αILI0R. B,E: Data are representative of two independent experiments, (ss n=3, Hh + αILI0R n=7). Two-Way ANOVA with Tukey correction. C,D: Data are representative of two independent experiments, (WT ss n=6, Irf5-/- ss n = 3 Hh + αIL10R n=7). Two-Way ANOVA with Tukey correction. F) The frequency of intestinal MNPs in the cLP at d21 Hh + αIL10R WT (n=12) and Irf5-/- (n=11) mice. G) Representative H&E sections of colons from CX3CR1IRF5+ (left) and CX3CR1IRF5- (right) mice at d21 Hh + αIL10R. H) Histopathology scoring of colons from CX3CR1IRF5+ (n=11) and CX3CR1IRF5- (n=11) mice at d21 Hh + αIL10R. F,H: Data are pooled from two independent experiments. F) Two-Way ANOVA with Sidak correction, H) Unpaired t-test. Data presented are mean ± SEM, ns = not significant, * p ≤ 0.05, ** p ≤ 0.01, *** p ≤ 0.001, **** p < 0.0001
Figure 3
Figure 3. IRF5 has subtle effect on CD11c+ intestinal macrophages at steady state
WT and Irf5-/- CD45+CD11b+SiglecF-Ly6G-CX3CR1+ cells were sorted from the colons of five mixed bone marrow chimera animals and subjected to scRNA-Seq analysis. A) Graph based clustering(58) of equal numbers of WT and Irf5-/- cells (n=4780 total) identified nine clusters of MNPs and one cluster of dendritic cells. B) The bar plots show the percentages of WT and Irf5-/- cells that were found in each cluster. Panels C) – F) show the expression of cell type markers C), genes expressed in Cd11c +ve macrophages D), genes expressed in Mrc1 +ve macrophages and genes with associated with macrophage differentiation and activation E).
Figure 4
Figure 4. IRF5 promotes generation of CD11c+ macrophages in inflamed colon
WT and Irf5-/- CD45+CD11b+SiglecF-Ly6G-CX3CR1+ cells were sorted from the colons of three mixed bone marrow chimera animals at d21 of Hh + αIL10R colitis and subjected to droplet-based single cell transcriptomic analysis. A) Graph based clustering(58) of equal numbers of WT and Irf5-/- cells (n=1106 total) identified four clusters of MNPs and four clusters of dendritic cells. B) The violin plots show the expression levels (x axes) of selected known cLP MNP and DC sub-population markers in each of the identified clusters (y axes). C) The bar plots show the percentages of WT and Irf5-/- cells that were found in each cluster.
Figure 5
Figure 5. IRF5 defines an inflammatory MNP signature during colitis
WT and Irf5-/- P1 monocytes, P2 monocytes and macrophages were sorted from three mixed bone marrow chimera animals at d21 Hh + αIL10R. A) The dot plot shows the expression (mean TPM, n=3 biological replicates) of selected genes found to be differentially expressed between WT and Irf5-/- cells at one or more stages of the monocyte waterfall. The significant changes (| fc | > 2, BH adjusted p < 0.05) are indicated by the grey triangles. B) Selected GO Biological process categories that showed a significant enrichment (coloured dots, GSEA analysis, BH adjusted p < 0.1) in at least one of the three Irf5 KO vs WT small bulk RNA-seq comparisons. C-E) Intracellular or extracellular flow cytometry labelling was used to quantify the expression of C) TNFα, D) pro-IL1β, E) MHC II on WT vs Irf5-/- macrophages in mixed bone marrow chimera uninfected (n=3), and at d21 Hh + αIL10R colitis (n=4). Two-Way ANOVA with Sidak Correction. Data from one representative experiment presented are mean ± SEM, ns = not significant, * p ≤ 0.05, ** p ≤ 0.01, *** p ≤ 0.001
Figure 6
Figure 6. IRF5 promotes monocyte to Cd11c macrophage differentiation during intestinal inflammation
WT and Irf5-/- monocytes and macrophages from the inflamed intestine (Fig 4) were re-clustered at higher resolution (Supplementary Fig S10) and subject to pseudotime analysis. A) Embedding of the cells in the first three dimensions of a diffusion map shows the three differentiation trajectories (solid lines) identified by the Slingshot pseudotime algorithm (with the Ly6c2 monocytes assumed to represent the root state) B) Expression of selected cell type marker genes and genes associated with Cd11c (Itgax) an Mrc1 (Cd206) macrophages. C) The bar plots show the percentages of WT and Irf5-/- cells that were found in each cluster. D) The violin plots show the progression of the WT and Irf5-/- (KO) cells through pseudotime along the three identified trajectories (as shown in A)). Differences in the distribution of cells in pseudotime between the genotypes were assessed with a KS tests (p-values adjusted using the Bonferroni correction). The position of the cells in pseudotime is shown on top of the violin plots (cells colored by cluster as in A)). The position of the 50th quantiles is indicated by the bold vertical lines.
Figure 7
Figure 7. CD11c+ macrophages occupy a distinct colonic niche
A) Representative images of immunofluorescent labelling of colonic sections at steady state. Individual channels visualise the distribution of F4/80+ (blue), CD206+ (green) and CD11c+ (red) cells within the structure of the colon. CD206+ macrophages (white arrow) and CD11c+ macrophages (*) as well as single-positive F4/80+ cells (#) can be detected in the merged image. Cell nuclei are labelled with Sytoxblue (grey). Scalebars represent 50 μM. B) Localisation of double-positive CD11c+F4/80+ (cyan) and CD206+F4/80 (yellow) cells, in steady state (n=6) and colitic mouse colons (n=6) by immunehistofluorescence. Separate channels based on overlap of staining were created. Cell nuclei were labelled with Sytoxblue (grey). A minimum of 5 sections per mouse were evaluated. Macrophages at the base of the crypts (white arrow), at the tips of the villi (*), interspersed within the villi (†); at the Muscularis mucosae membrane (#). Scalebars represent 100 μM in the overview images and 50μM in the enlargement. C) Schematic depiction of image quantification analysis. Localisation of macrophages is assessed by their minimal distance (black arrow) to the tip of the villi (artificial luminal surface depicted in green), muscularis mycosae (red) and serosal membranes (blue). D) Quantification of minimal distance of CD206+ F4/80+ and CD11c+ F4/80+ cells in steady state and d21 Hh + αIL1 OR to the luminal surface. Minimal distance is presented as a percentage of the distance to the tip of the villi to the total distance between the luminal surface and serosal membrane. Two-way Anova with Tukey’s multiple comparisons test. Data presented as mean ± SEM, ns p > 0.05, * p < 0.05, ** p < 0.01, *** p <0.001.
Figure 8
Figure 8. IRF5 controls phenotype of CD11c+ macrophages
A, B, C) Comparison of IL12p40, TNF and IL-1β inflammatory cytokine expression in CD11c+ vs CD11c- cLP macrophages assessed by intracellular flow cytometry, in uninfected MBMC (n=3) and d21 Hh + αIL10R (n=4). One experiment. Two-Way ANOVA with Tukey Correction. Data presented are mean ± SEM, ns = not significant, * p ≤ 0.05, **** p < 0.0001. D) The frequency of parent WT and Irf5-/- macrophages expressing CD11c or CD206 at d21 Hh + αIL10R colitis. Two-Way ANOVA with Sidak Correction. Data presented are mean ± SEM from two independent experiments, ns = not significant, **** p < 0.0001. E) IRF5 expression in CD11c+ vs CD11c- macrophages in mixed bone marrow chimera assessed by intracellular flow cytometry. One representative experiment, uninfected n=3, Hh + αIL10R n=4. F) Heatmap of expression of selected genes in WT and Irf5-/- Cd11c macrophages from the inflamed cLP of the mixed bone marrow chimeras (see Fig 5). All of the genes shown were found to be significantly differentially expressed between the WT and Irf5-/- cells of this cluster (Wilcoxon tests, BH adjusted p < 0.05). *’s denote significant differential expression between the genotypes in the macrophage small-bulk RNA-seq data.

References

    1. Maloy KJ, Powrie F. Intestinal homeostasis and its breakdown in inflammatory bowel disease. Nature. 2011;474:298. - PubMed
    1. Bryant RV, Brain O, Travis SPL. Conventional drug therapy for inflammatory bowel disease. Scandinavian Journal of Gastroenterology. 2015;50:90–112. - PubMed
    1. Bravatà I, Fiorino G, Allocca M, Repici A, Danese S. New targeted therapies such as anti-adhesion molecules, anti-IL-12/23 and anti-Janus kinases are looking toward a more effective treatment of inflammatory bowel disease. Scandinavian Journal of Gastroenterology. 2015;50:113–120. - PubMed
    1. Meuret G, Bitzi A, Hammer B. Macrophage turnover in Crohn’s disease and ulcerative colitis. Gastroenterology. 1978;74:501–503. - PubMed
    1. Bune AJ, Hayman AR, Evans MJ, Cox TM. Mice lacking tartrate-resistant acid phosphatase (Acp 5) have disordered macrophage inflammatory responses and reduced clearance of the pathogen, Staphylococcus aureus. Immunology. 2001;102:103–113. - PMC - PubMed

Publication types