Temporal estimates of case-fatality rate for COVID-19 outbreaks in Canada and the United States
- PMID: 32444481
- PMCID: PMC7828851
- DOI: 10.1503/cmaj.200711
Temporal estimates of case-fatality rate for COVID-19 outbreaks in Canada and the United States
Abstract
Background: Estimates of the case-fatality rate (CFR) associated with coronavirus disease 2019 (COVID-19) vary widely in different population settings. We sought to estimate and compare the COVID-19 CFR in Canada and the United States while adjusting for 2 potential biases in crude CFR.
Methods: We used the daily incidence of confirmed COVID-19 cases and deaths in Canada and the US from Jan. 31 to Apr. 22, 2020. We applied a statistical method to minimize bias in the crude CFR by accounting for the survival interval as the lag time between disease onset and death, while considering reporting rates of COVID-19 cases less than 50% (95% confidence interval 10%-50%).
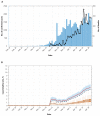
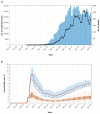
Results: Using data for confirmed cases in Canada, we estimated the crude CFR to be 4.9% on Apr. 22, 2020, and the adjusted CFR to be 5.5% (credible interval [CrI] 4.9%-6.4%). After we accounted for various reporting rates less than 50%, the adjusted CFR was estimated at 1.6% (CrI 0.7%-3.1%). The US crude CFR was estimated to be 5.4% on Apr. 20, 2020, with an adjusted CFR of 6.1% (CrI 5.4%-6.9%). With reporting rates of less than 50%, the adjusted CFR for the US was 1.78 (CrI 0.8%-3.6%).
Interpretation: Our estimates suggest that, if the reporting rate is less than 50%, the adjusted CFR of COVID-19 in Canada is likely to be less than 2%. The CFR estimates for the US were higher than those for Canada, but the adjusted CFR still remained below 2%. Quantification of case reporting can provide a more accurate measure of the virulence and disease burden of severe acute respiratory syndrome coronavirus 2.
© 2020 Joule Inc. or its licensors.
Conflict of interest statement
Competing interests: Joanne Langley holds the Canadian Institutes of Health Research- GlaxoSmithKline Chair in Pediatric Vaccinology at Dalhousie University. Dalhousie University has received funding for research studies from Sanofi Pasteur, Merck, Janssen, VBI and Pfizer. No other competing interests were declared.
Figures


References
-
- Wang X, Ma Z, Ning Y, et al. Estimating the case fatality ratio of the COVID-19 epidemic in China. medRxiv 2020. March 3. 10.1101/2020.02.17.20023630. - DOI
-
- Verity R, Okell LC, Dorigatti I, et al. Estimates of the severity of coronavirus disease 2019: a model-based analysis [published erratum in Lancet Infect Dis 2020 Apr. 15 [Epub ahead of print]. pii: S1473-3099(20)30309-1. doi: 10.1016/S1473-3099(20)30309-1; Lancet Infect Dis 2020. May 4 [Epub ahead of print]. pii S1473-3099 (20)30368-6. 10.1016/S1473-3099(20)30368-6]. - DOI - PMC - PubMed
- Lancet Infect Dis 2020. Mar. 30 [Epub ahead of print]. pii S1473-3099(20)30243-7. 10.1016/S1473-3099(20)30243-7. - DOI
-
- Garske T, Legrand J, Donnelly CA, et al. Assessing the severity of the novel influenza A/H1N1 pandemic. BMJ 2009;339:b2840. - PubMed
MeSH terms
Grants and funding
LinkOut - more resources
Full Text Sources
Medical
Miscellaneous
