. 2020 Jun 9;117(23):13012-13022.
doi: 10.1073/pnas.1918845117. Epub 2020 May 22.

Metformin selectively inhibits metastatic colorectal cancer with the KRAS mutation by intracellular accumulation through silencing MATE1

Affiliations

Metformin selectively inhibits metastatic colorectal cancer with the KRAS mutation by intracellular accumulation through silencing MATE1

Jinye Xie et al. Proc Natl Acad Sci U S A. .

Abstract

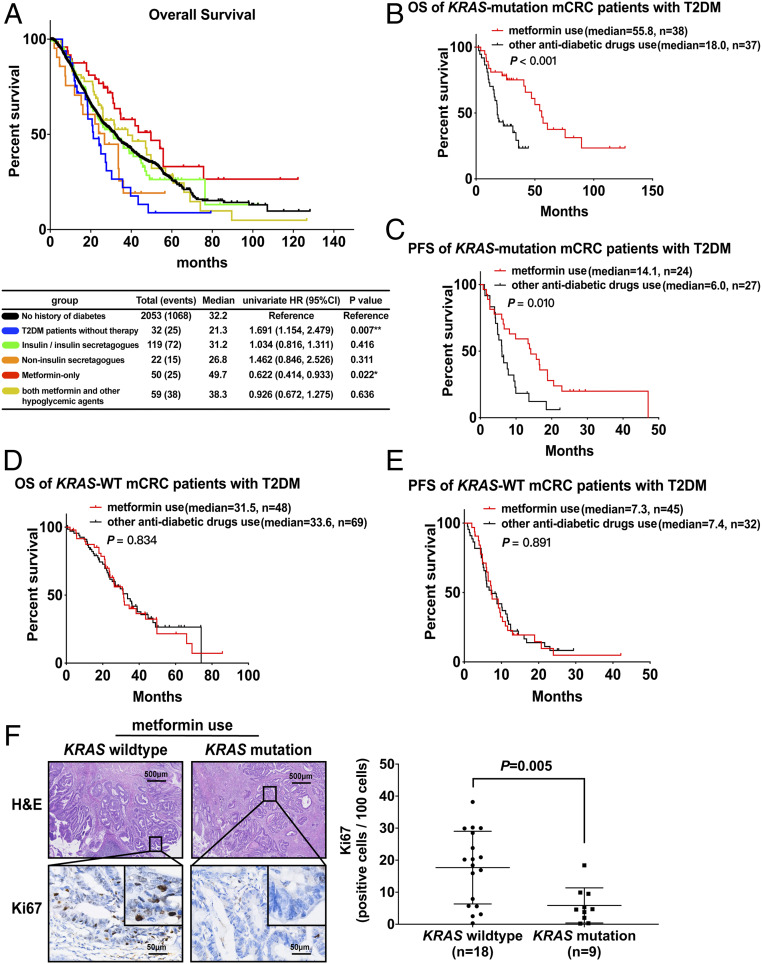
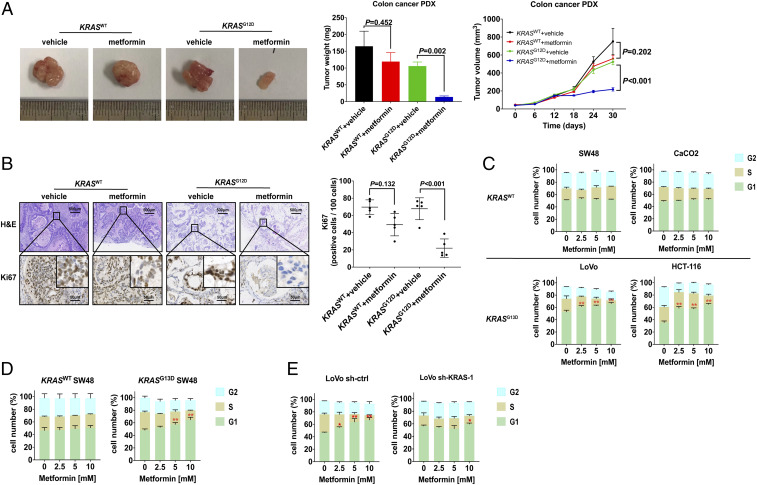
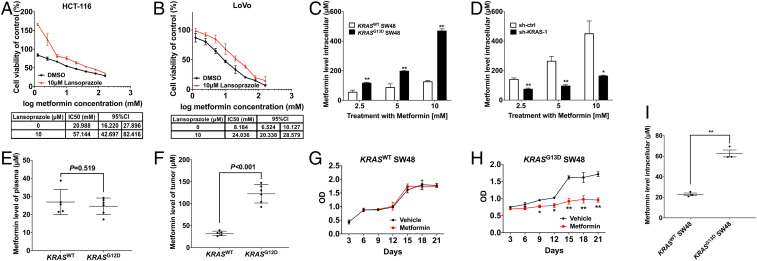
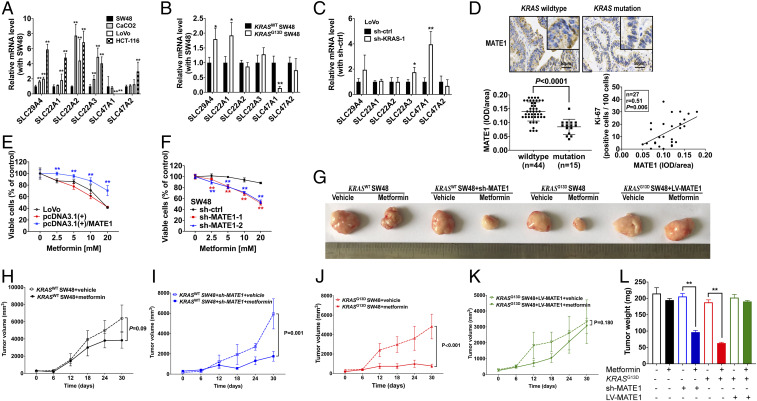
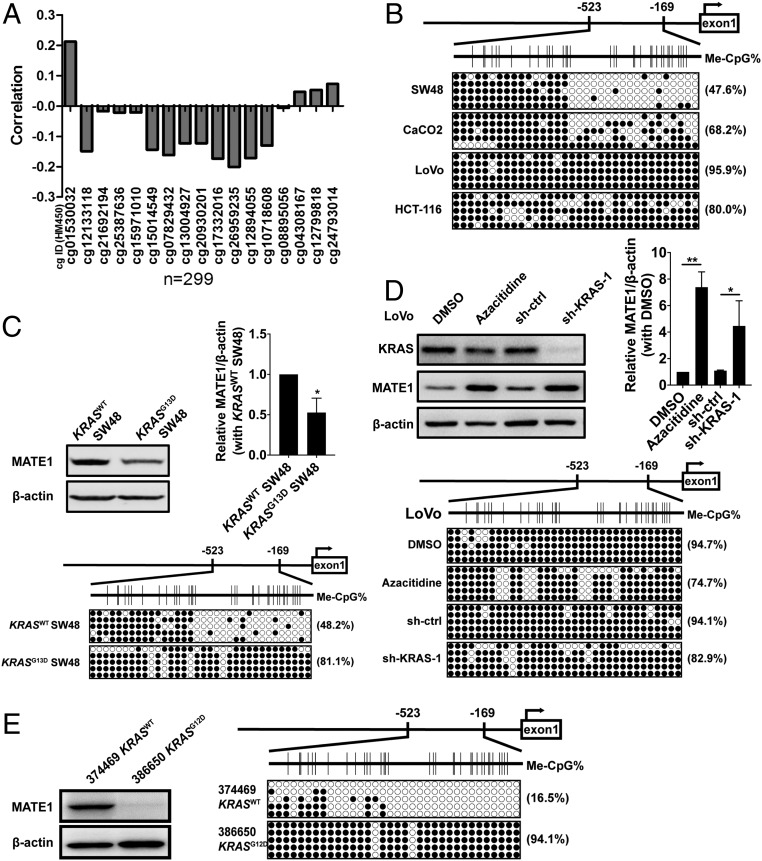
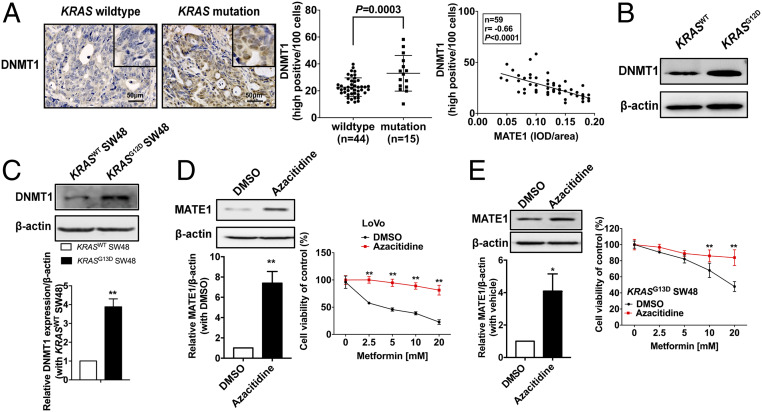
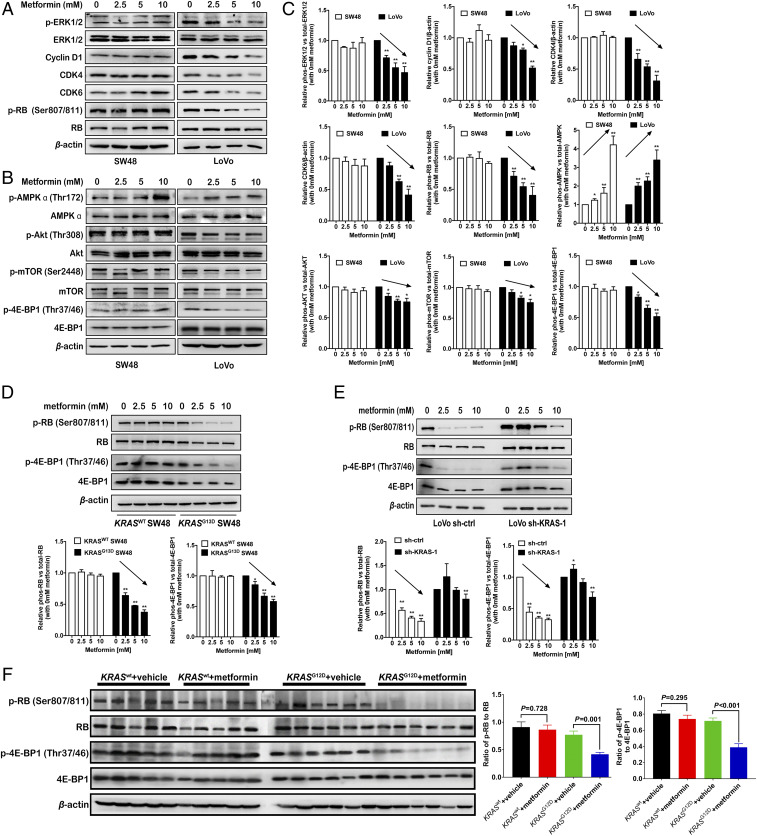
Metastatic colorectal cancer (mCRC) patients have poor overall survival despite using irinotecan- or oxaliplatin-based chemotherapy combined with anti-EGFR (epidermal growth factor receptor) drugs, especially those with the oncogene mutation of KRAS Metformin has been reported as a potentially novel antitumor agent in many experiments, but its therapeutic activity is discrepant and controversial so far. Inspiringly, the median survival time for KRAS-mutation mCRC patients with diabetes on metformin is 37.8 mo longer than those treated with other hypoglycemic drugs in combination with standard systemic therapy. In contrast, metformin could not improve the survival of mCRC patients with wild-type KRAS Interestingly, metformin is preferentially accumulated in KRAS-mutation mCRC cells, but not wild-type ones, in both primary cell cultures and patient-derived xenografts, which is in agreement with its tremendous effect in KRAS-mutation mCRC. Mechanistically, the mutated KRAS oncoprotein hypermethylates and silences the expression of multidrug and toxic compound extrusion 1 (MATE1), a specific pump that expels metformin from the tumor cells by up-regulating DNA methyltransferase 1 (DNMT1). Our findings provide evidence that KRAS-mutation mCRC patients benefit from metformin treatment and targeting MATE1 may provide a strategy to improve the anticancer response of metformin.

Keywords: DNA methyltransferase 1 (DNMT1); KRAS mutation; metastatic colorectal cancer; metformin; multidrug and toxic compound extrusion 1 (MATE1).


Conflict of interest statement

The authors declare no competing interest.

Figures

Fig. 1.
Fig. 1.
KRAS mutation enhances the antitumor activity of metformin in CRC patients. (A) The overall survival analysis was conducted by the Kaplan–Meier method after dividing the mCRC patients into non-DM patients, T2DM metformin-use group, and other antidiabetic drug-use group. (B and C) The overall survival (B) and progression-free survival of first-line chemotherapy (C) analysis were conducted by the Kaplan–Meier method after dividing the KRAS-mutation mCRC and T2DM patients into a metformin-use group and other antidiabetic drug-use group. (D and E) The overall survival (D) and progression-free survival of first-line chemotherapy (E) analysis of the KRAS wild-type subgroup were conducted with T2DM and mCRC patients in a metformin-use group and other antidiabetic drug-use group. (F) Representative images of hematoxylin and eosin (H&E) and Ki67 immunohistochemistry on cross-sections from patients with mCRC with T2DM and metformin use (Left) and the proportion of Ki67-positive cells per 100 cells (Right) are shown. Data are shown as mean ± SEM. P = 0.005 was compared with the KRAS wild-type group. P values were determined by unpaired two-tailed Student’s t test.
Fig. 2.
Fig. 2.
KRAS mutation enhances the antitumor activity of metformin in the CRC PDX animal model and CRC cells. (A and B) The representative morphology (A, Left), tumor weight (A, Middle), mean tumor growth rate (A, Right), and representative images of Ki67 immunohistochemistry and their corresponding H&E staining (B, Left) and statistical graph (B, Right) are shown as a result of 30-d treatment with metformin in 374469 KRASWT colon adenocarcinoma and 386650 KRASG12D colon mucinous adenocarcinoma patient-derived xenograft models. Data are shown as mean ± SEM, and differences between metformin and vehicle were analyzed by two-way ANOVA. (CE) The distribution of G1, S, and G2 phases in KRASWT CRC cell lines SW48 and CaCO2, KRASG13D CRC cell lines LoVo and HCT-116 (C), KRASG13D SW48 established by the CRISPR-Cas9 system (D), and LoVo infected by shRNA lentivirus (E) were detected after treatment with 0, 2.5, 5, and 10 mM metformin for 24 h (n = 3). Data are shown as mean ± SEM. *P < 0.05, **P < 0.01 was compared with 0 mM metformin. All P values were determined by two-way ANOVA.
Fig. 3.
Fig. 3.
KRAS mutation up-regulates the intracellular accumulation of metformin in vitro and in vivo. (A and B) Forty-eight-hour growth of KRASG13D CRC cell lines HCT-116 (A) and LoVo (B) cultured with or without lansoprazole was determined after treatment with metformin (Top; n = 5), and the IC50 and 95% CI were calculated by SPSS 21.0 software (Bottom). (C and D) Levels of metformin in KRASWT SW48, KRASG13D SW48 (C), sh-KRAS LoVo, and its control cell strain sh-ctrl LoVo (D) were detected by the LC-MS method after treatment with 2.5, 5, and 10 mM metformin for 24 h (n = 3 at each time point). Data are shown as mean ± SEM. The significance of KRASG13D SW48 vs. KRASWT SW48 (C) and sh-KRAS LoVo vs. sh-ctrl LoVo (D) was determined as *P < 0.05, **P < 0.01. (E and F) Levels of metformin in the plasma (E) and tumor tissues (F) of PDX models were determined after treatment with 1 mg/mL metformin in drinking water for 30 d; n = 5 for KRASWT colon adenocarcinoma PDX analysis; n = 6 for KRASG12D colon mucinous adenocarcinoma PDX analysis. (GI) Growth curves of KRASWT SW48 cells (G) and KRASG13D SW48 (H) treated with 40 μM metformin for the indicated time points. Data are shown as mean ± SEM. The difference between metformin and vehicle at each time point was determined as *P < 0.05, **P < 0.01. (I) Levels of metformin in KRASWT SW48 and KRASG13D SW48 were detected by the LC-MS method after 40 μM metformin treatment at 21 d. Data are shown as mean ± SEM. The difference between KRASG13D and KRASWT SW48 was determined as **P < 0.01. All P values were determined by unpaired two-tailed Student’s t test.
Fig. 4.
Fig. 4.
Down-regulation of MATE1 under KRAS mutation is associated with the sensitivity of CRC cells to metformin. (AC) Transcriptional levels of SLC29A4 (PMAT), SLC22A1 (OCT1), SLC22A2 (OCT2), SLC22A3 (OCT3), SLC47A1 (MATE1), and SLC47A2 (MATE2k) in KRASWT CRC cell lines SW48 and CaCO2, KRASG13D CRC cell lines HCT-116 and LoVo (A), KRASG13D SW48 and its counterpart SW48 (B), and sh-KRAS LoVo and sh-ctrl LoVo (C) were determined by qRT-PCR (n = 3). Data are shown as mean ± SEM. P values were determined with the black bar as a control in AC as *P < 0.05, **P < 0.01. Each analysis was replicated three times. (D) Representative images of MATE1 immunohistochemistry on cross-sections from patients with mCRC with T2DM and metformin use, and the different integral optical density (IOD) of MATE1 between the KRAS wild type and mutation group is shown. The correlation between MATE1 expression and Ki67 level of 27 mCRC patients with T2DM and metformin use was determined by Pearson’s correlation analysis. (E and F) Forty-eight-hour growth of the KRASG13D CRC cell line LoVo with or without MATE1 overexpression (E) and KRASWT CRC cell line SW48 with or without MATE1 knockdown by small interfering RNA (F) was detected after treatment with 2.5, 5, 10, and 20 mM metformin (n = 5). Data are shown as mean ± SEM. The difference compared with the control group at each concentration was determined as **P < 0.01. (GL) The representative morphology (G), tumor growth rate, and tumor weight (L) are shown as a result of 30-d treatment with metformin in SW48 xenograft (H), SW48 with sh-MATE1 xenograft (I), KRASG13D SW48 (J), and KRASG13D SW48 with LV-MATE1 xenograft (K) models. Data are shown as mean ± SEM. All P values were determined by two-way ANOVA. **P < 0.01.
Fig. 5.
Fig. 5.
KRAS mutation down-regulates MATE1 through mediating the hypermethylation status on the CpG island of the MATE1 promoter. (A) The correlation between MATE1 transcriptional levels and methylation levels of CpG sites on the promoter of MATE1. Data from TCGA-COAD RNA-seq-HTseq-FPKM-521 (workflow type HTSeq-FPKM, normalized from RNA-seq of 521 samples) and methyArray 450k were conducted by Pearson’s correlation analysis. (B) Bisulfite sequencing PCR analysis showing the methylation status of CpG sites on the MATE1 promoter in CRC cell lines. (C) Immunoblot analysis of MATE1 levels and BSP analysis of the MATE1 promoter are shown between KRASG13D SW48 and its counterpart SW48. (D) Immunoblot analysis monitoring MATE1 levels and CpG-site methylation on the MATE1 promoter in KRAS shRNA-LoVo cells treated with dimethyl sulfoxide (DMSO) as a negative control or azacitidine as a positive control. (E) The MATE1 expression in 374469 KRASWT colon adenocarcinoma and 386650 KRASG12D colon mucinous adenocarcinoma was analyzed by immunoblot, and the methylation status of CpG sites on the MATE1 promoter was determined by BSP. Data are shown as mean ± SEM. All P values were determined by two-way ANOVA. *P < 0.05, **P < 0.01.
Fig. 6.
Fig. 6.
Transcriptional silencing of MATE1 by hypermethylation in KRAS-mutation CRC cells is associated with the up-regulation of DNMT1. (A) Representative images of DNMT1 immunohistochemistry on cross-sections from mCRC patients with T2DM were shown (Left); cells with high positive DNMT1 expression were counted by ImageJ software, and the proportion was presented by two-way ANOVA (Middle); the association between the IOD of MATE1 (shown in Fig. 3 D and E) and cell proportion with high positive DNMT1 expression was determined by Pearson’s correlation analysis (Right). (B and C) Expression levels of DNMT1 in 374469 KRASWT colon adenocarcinoma and 386650 KRASG12D colon mucinous adenocarcinoma (B) and in KRASG13D SW48 (C) were analyzed by immunoblot. (D and E) Immunoblot analysis of MATE1 level (Left) and 48-h cell viability (Right) in LoVo (D) or KRASG13D SW48 (E) cultured in 10 μM azacitidine for more than three generations (n = 3). Data are shown as mean ± SEM. *P < 0.05, **P < 0.01 compared with the DMSO group. All P values were determined by two-way ANOVA.
Fig. 7.
Fig. 7.
Metformin inhibits both RB and 4E-BP1 activity in cell proliferation. (A and B) Immunoblot analysis of the MEK/ERK pathway, phosphorylated ERK1/2, total ERK1/2, Cyclin D1, CDK4/6, phosphorylated RB protein, and total RB protein (A), and the AKT/mTOR pathway, phosphorylated AKT (Thr308), total AKT, phosphorylated mTOR (Ser2448), total mTOR, phosphorylated 4E-BP1, and total 4E-BP1 (B) was conducted in SW48 and LoVo cells after treatment with 2.5, 5, and 10 mM metformin for 24 h. (C) Quantification of proteins in A and B by densitometry from three independent experiments, normalized by β-actin levels (mean ± SEM). *P < 0.05, **P < 0.01. (DF) Phosphorylated RB protein, total RB protein, phosphorylated 4E-BP1, and total 4E-BP1 were detected by immunoblot analysis in KRASG13D SW48 and its control SW48 cells (D), sh-KRAS LoVo, and its control sh-ctrl LoVo cells (E) after treatment with 2.5, 5, and 10 mM metformin for 24 h and detected in 374469 KRASWT colon adenocarcinoma and 386650 KRASG12D colon mucinous adenocarcinoma patient-derived xenograft models after treatment with 1 mg/mL metformin in drinking water for 30 d (F). All P values were determined by two-way ANOVA. *P < 0.05, **P < 0.01.

References

    1. Siegel R. L., Miller K. D., Jemal A., Cancer statistics, 2018. CA Cancer J. Clin. 68, 7–30 (2018). - PubMed
    1. Cremolini C. et al. ., FOLFOXIRI plus bevacizumab versus FOLFIRI plus bevacizumab as first-line treatment of patients with metastatic colorectal cancer: Updated overall survival and molecular subgroup analyses of the open-label, phase 3 TRIBE study. Lancet Oncol. 16, 1306–1315 (2015). - PubMed
    1. Yaeger R. et al. ., Clinical sequencing defines the genomic landscape of metastatic colorectal cancer. Cancer Cell 33, 125–136.e3 (2018). - PMC - PubMed
    1. Allegra C. J. et al. ., Extended RAS gene mutation testing in metastatic colorectal carcinoma to predict response to anti-epidermal growth factor receptor monoclonal antibody therapy: American Society of Clinical Oncology Provisional Clinical Opinion update 2015. J. Clin. Oncol. 34, 179–185 (2016). - PubMed
    1. Douillard J. Y. et al. ., Panitumumab-FOLFOX4 treatment and RAS mutations in colorectal cancer. N. Engl. J. Med. 369, 1023–1034 (2013). - PubMed

Publication types

MeSH terms