

High Dietary Advanced Glycation End Products Impair Mitochondrial and Cognitive Function
- PMID: 32444539
- PMCID: PMC7581068
- DOI: 10.3233/JAD-191236
High Dietary Advanced Glycation End Products Impair Mitochondrial and Cognitive Function
Abstract
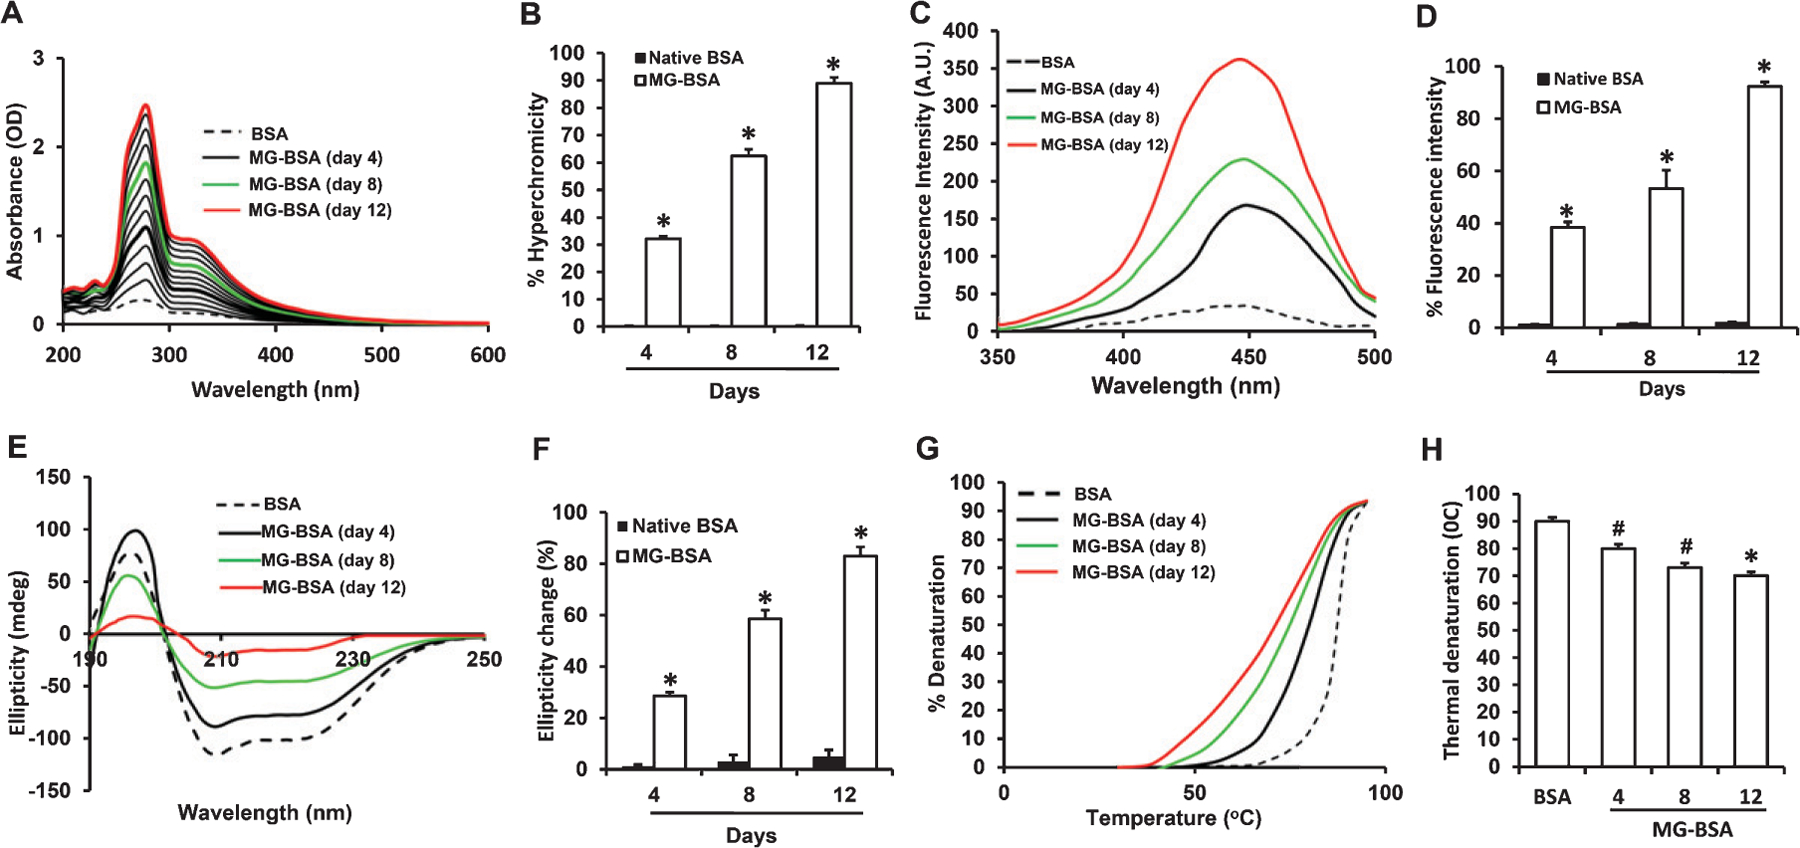
Background: Advanced glycation end products (AGEs) are an important risk factor for the development of cognitive decline in aging and late-onset neurodegenerative diseases including Alzheimer's disease. However, whether and how dietary AGEs exacerbate cognitive impairment and brain mitochondrial dysfunction in the aging process remains largely unknown.
Objective: We investigated the direct effects of dietary AGEs on AGE adducts accumulation, mitochondrial function, and cognitive performance in mice.
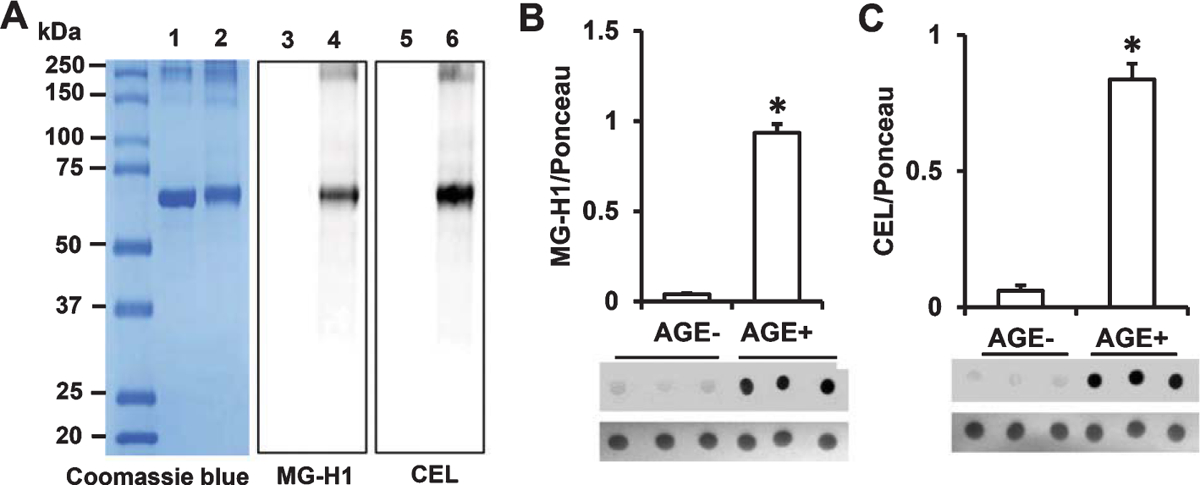
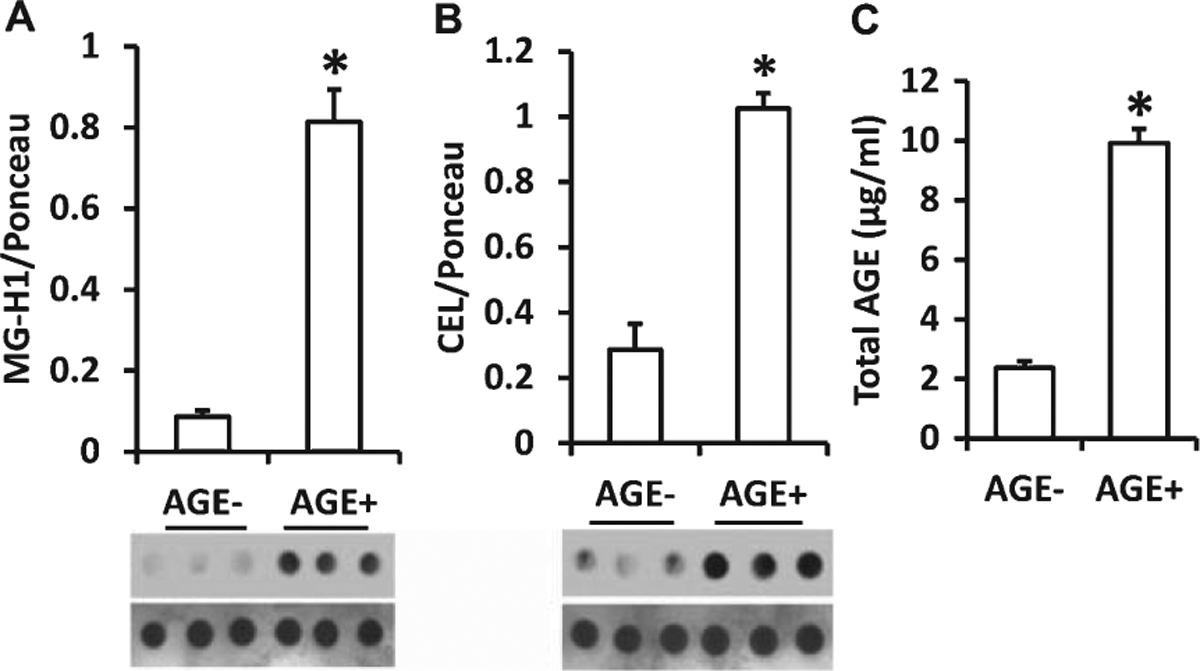
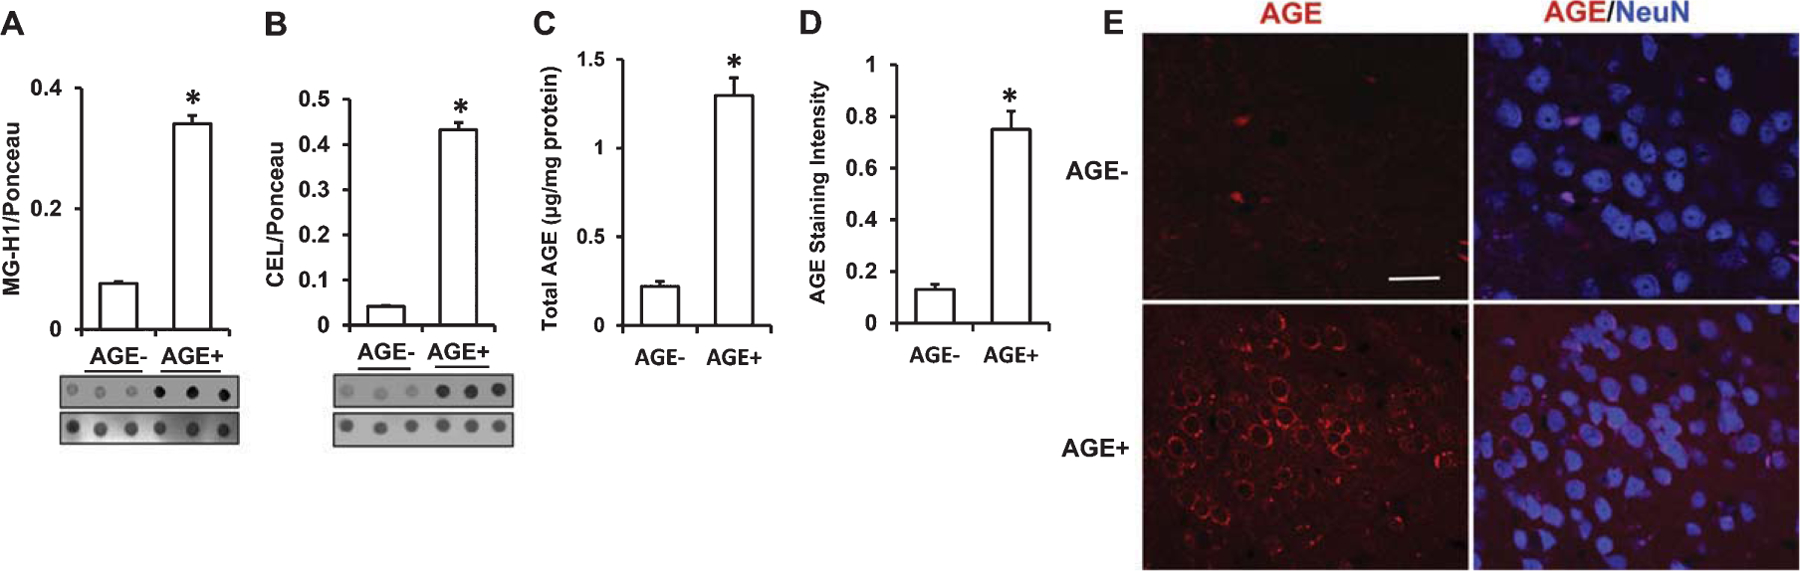
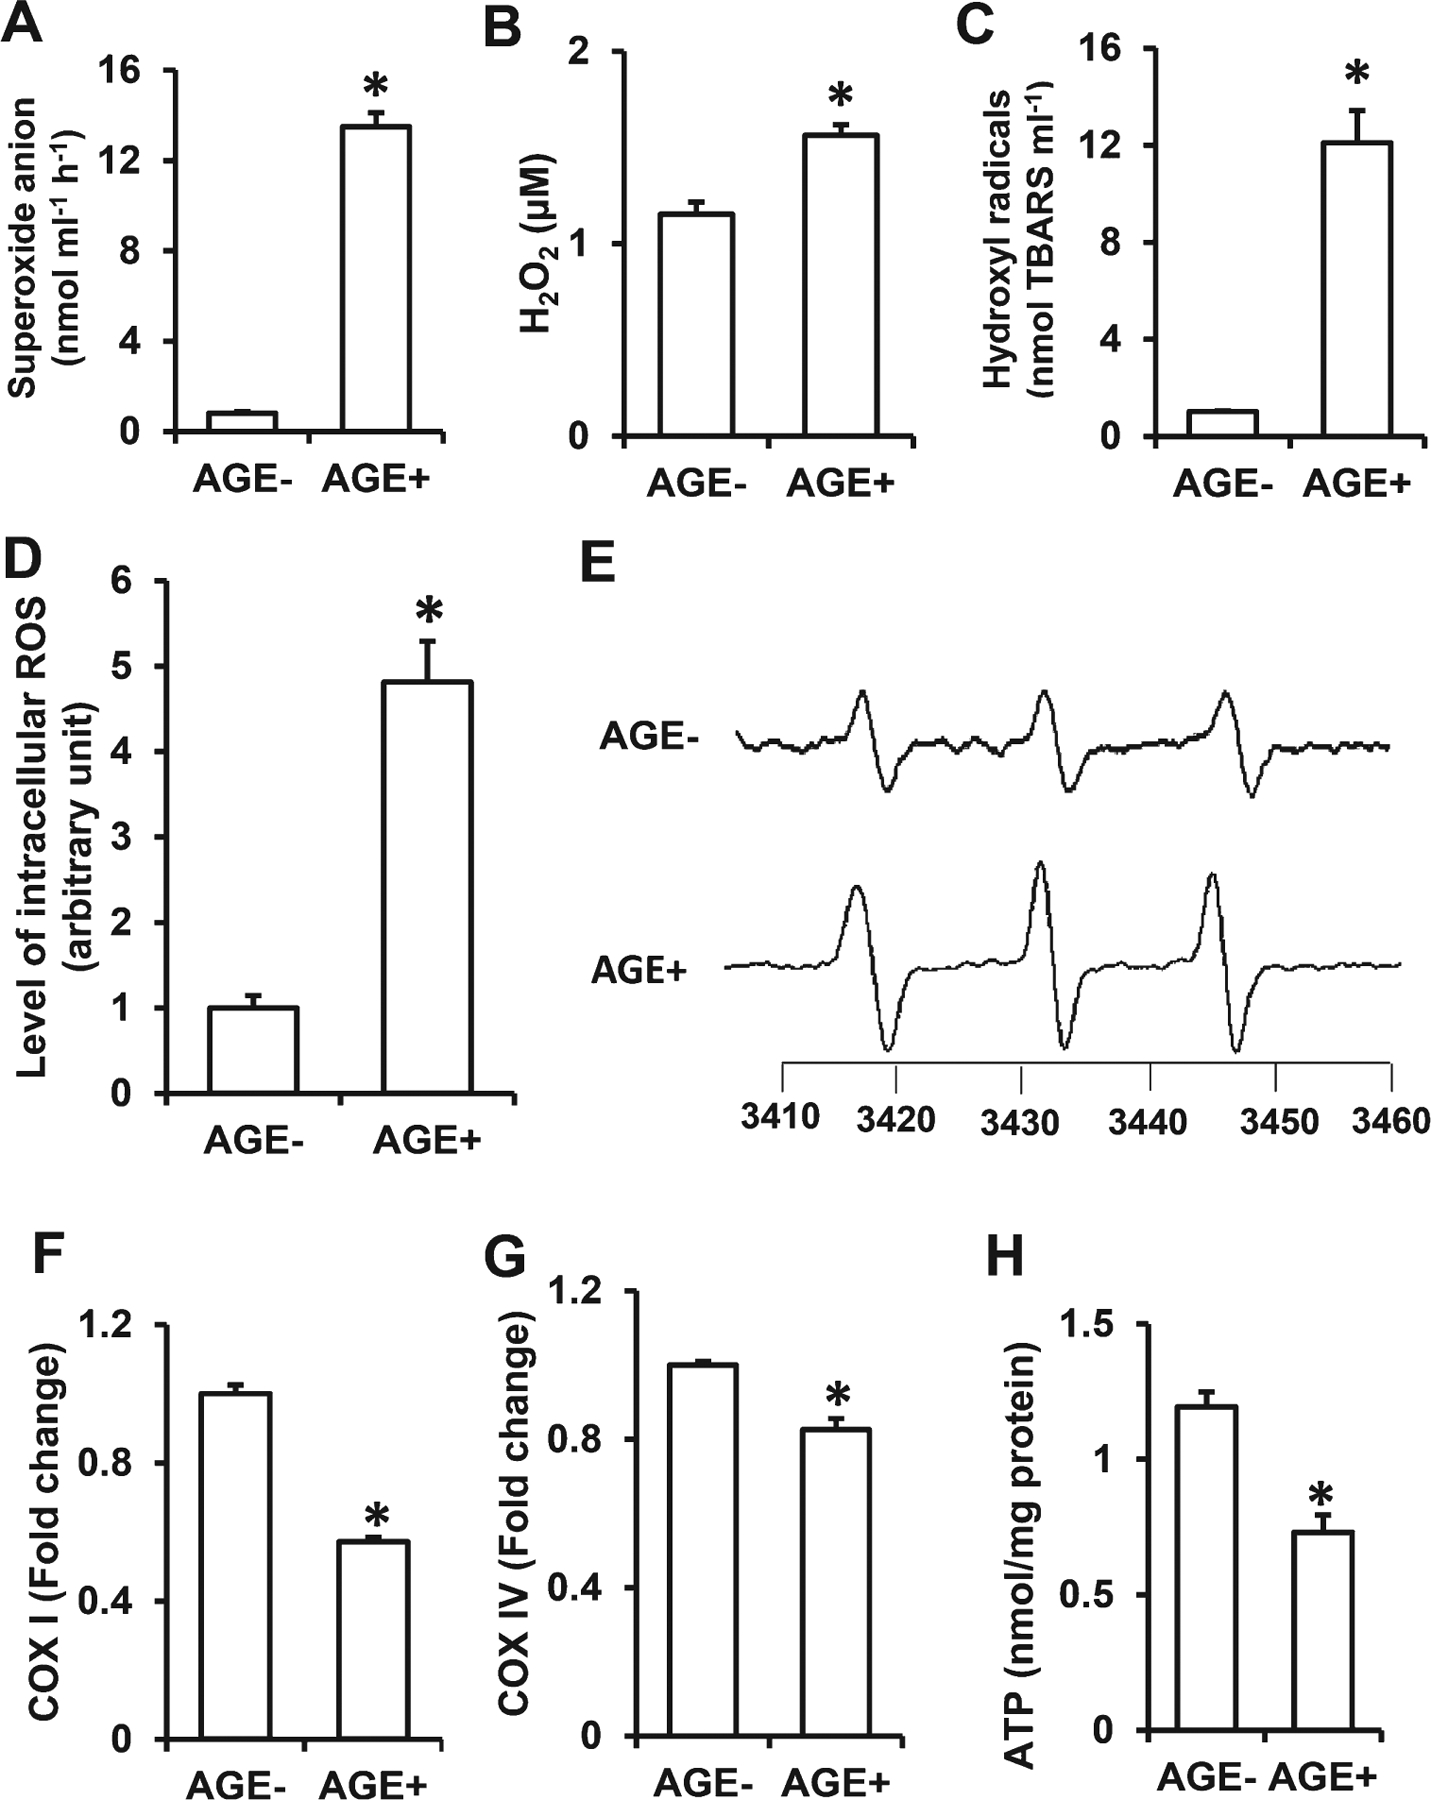
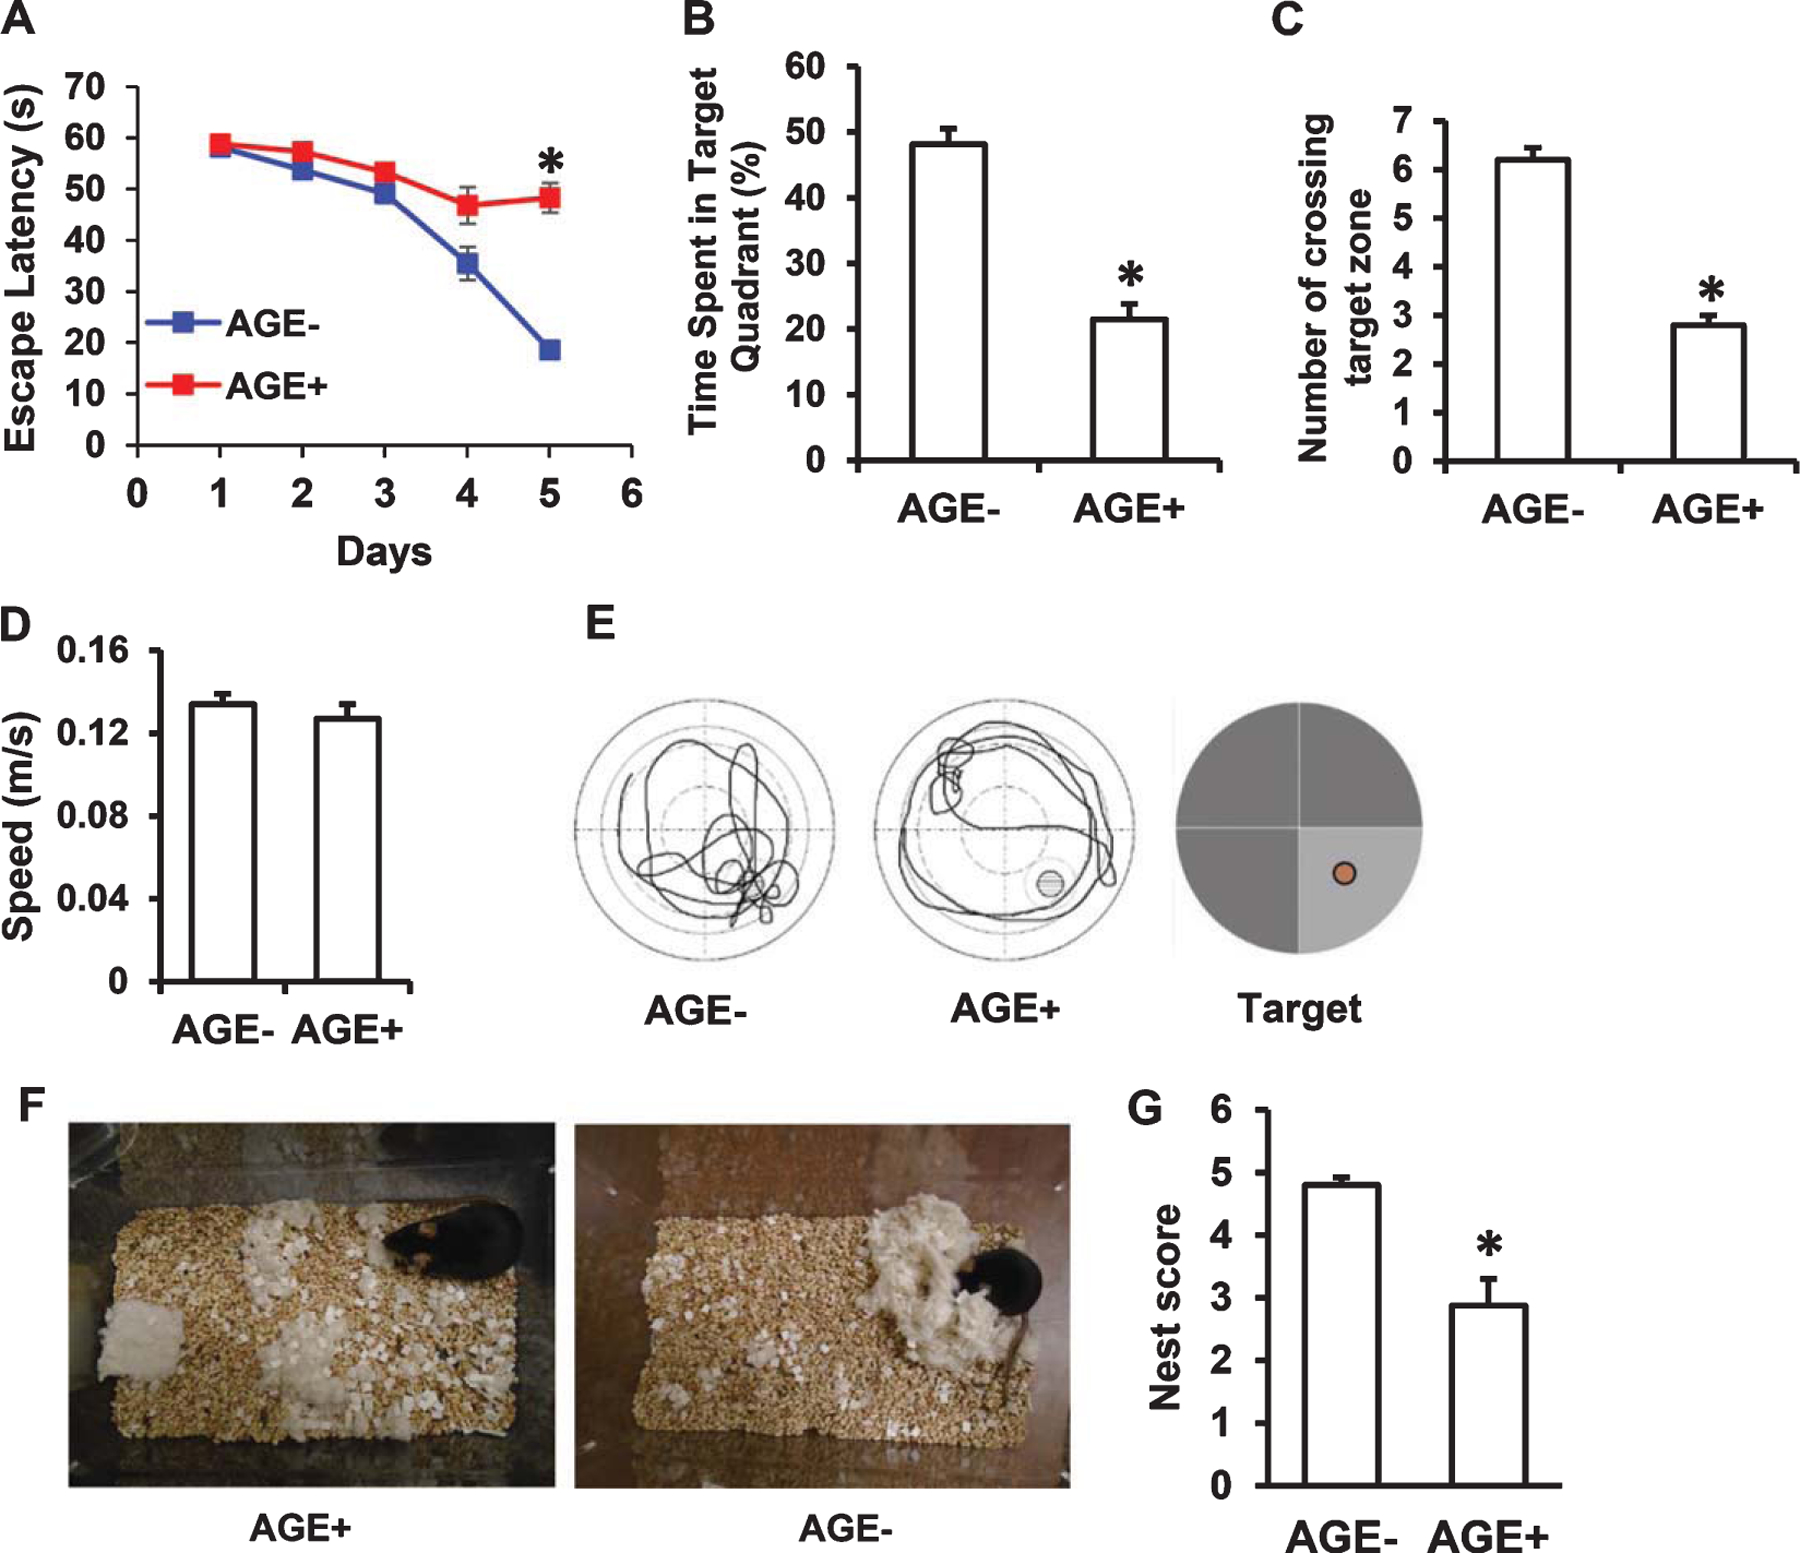
Methods: Mice were fed the AGE+ diet or AGE- diet. We examined levels of AGE adducts in serum and cerebral cortexes by immunodetection and immunohistochemistry, determined levels of reactive oxygen species by biochemical analysis, detected enzyme activity associated with mitochondrial respiratory chain complexes I & IV and ATP levels, and assessed learning and memory ability by Morris Water Maze and nesting behavior.
Results: Levels of AGE adducts (MG-H1 and CEL) were robustly increased in the serum and brain of AGE+ diet fed mice compared to the AGE- group. Furthermore, greatly elevated levels of reactive oxygen species, decreased activities of mitochondrial respiratory chain complexes I & IV, reduced ATP levels, and impaired learning and memory were evident in AGE+ diet fed mice compared to the AGE- group.
Conclusion: These results indicate that dietary AGEs are important sources of AGE accumulation in vivo, resulting in mitochondrial dysfunction, impairment of energy metabolism, and subsequent cognitive impairment. Thus, reducing AGEs intake to lower accumulation of AGEs could hold therapeutic potential for the prevention and treatment of AGEs-induced mitochondrial dysfunction linked to cognitive decline.
Keywords: Advanced glycation end products; methylglyoxal; mitochondrial and cognitive dysfunction.
Figures
Similar articles
-
Age-dependent accumulation of dicarbonyls and advanced glycation endproducts (AGEs) associates with mitochondrial stress.Free Radic Biol Med. 2021 Feb 20;164:429-438. doi: 10.1016/j.freeradbiomed.2020.12.021. Epub 2021 Jan 5. Free Radic Biol Med. 2021. PMID: 33359687 Free PMC article.
-
In vitro antiglycating effect and in vivo neuroprotective activity of Trigonelline in d-galactose induced cognitive impairment.Pharmacol Rep. 2018 Apr;70(2):372-377. doi: 10.1016/j.pharep.2017.09.006. Epub 2017 Sep 28. Pharmacol Rep. 2018. PMID: 29477946
-
Disparate Central and Peripheral Effects of Circulating IGF-1 Deficiency on Tissue Mitochondrial Function.Mol Neurobiol. 2020 Mar;57(3):1317-1331. doi: 10.1007/s12035-019-01821-4. Epub 2019 Nov 15. Mol Neurobiol. 2020. PMID: 31732912 Free PMC article.
-
Hyperglycemia-associated alterations in cellular signaling and dysregulated mitochondrial bioenergetics in human metabolic disorders.Eur J Nutr. 2016 Dec;55(8):2339-2345. doi: 10.1007/s00394-016-1212-2. Epub 2016 Apr 15. Eur J Nutr. 2016. PMID: 27084094 Free PMC article. Review.
-
Advanced Glycation End Products (AGEs) May Be a Striking Link Between Modern Diet and Health.Biomolecules. 2019 Dec 17;9(12):888. doi: 10.3390/biom9120888. Biomolecules. 2019. PMID: 31861217 Free PMC article. Review.
Cited by
-
Age-dependent accumulation of dicarbonyls and advanced glycation endproducts (AGEs) associates with mitochondrial stress.Free Radic Biol Med. 2021 Feb 20;164:429-438. doi: 10.1016/j.freeradbiomed.2020.12.021. Epub 2021 Jan 5. Free Radic Biol Med. 2021. PMID: 33359687 Free PMC article.
-
Advanced Glycation End-Products (AGEs): Formation, Chemistry, Classification, Receptors, and Diseases Related to AGEs.Cells. 2022 Apr 12;11(8):1312. doi: 10.3390/cells11081312. Cells. 2022. PMID: 35455991 Free PMC article. Review.
-
JMJD1A/NR4A1 Signaling Regulates the Procession of Renal Tubular Epithelial Interstitial Fibrosis Induced by AGEs in HK-2.Front Med (Lausanne). 2022 Feb 3;8:807694. doi: 10.3389/fmed.2021.807694. eCollection 2021. Front Med (Lausanne). 2022. PMID: 35186975 Free PMC article.
-
Diabetes and Cognitive Impairment: A Role for Glucotoxicity and Dopaminergic Dysfunction.Int J Mol Sci. 2021 Nov 16;22(22):12366. doi: 10.3390/ijms222212366. Int J Mol Sci. 2021. PMID: 34830246 Free PMC article. Review.
-
Advanced glycation end products and cognitive impairment in schizophrenia.PLoS One. 2021 May 26;16(5):e0251283. doi: 10.1371/journal.pone.0251283. eCollection 2021. PLoS One. 2021. PMID: 34038433 Free PMC article.
References
-
- Yan SD, Schmidt AM, Anderson GM, Zhang J, Brett J, Zou YS, Pinsky D, Stern D (1994) Enhanced cellular oxidant stress by the interaction of advanced glycation end products with their receptors/binding proteins. J Biol Chem 269, 9889–9897. - PubMed
-
- Henning C, Glomb MA (2016) Pathways of the Maillard reaction under physiological conditions. Glycoconj J 33, 499–512. - PubMed
Publication types
MeSH terms
Substances
Grants and funding
LinkOut - more resources
Full Text Sources
