. 2020 May 22;11(1):2588.
doi: 10.1038/s41467-020-16246-0.

KAT3-dependent acetylation of cell type-specific genes maintains neuronal identity in the adult mouse brain

Affiliations

KAT3-dependent acetylation of cell type-specific genes maintains neuronal identity in the adult mouse brain

Michal Lipinski et al. Nat Commun. .

Abstract

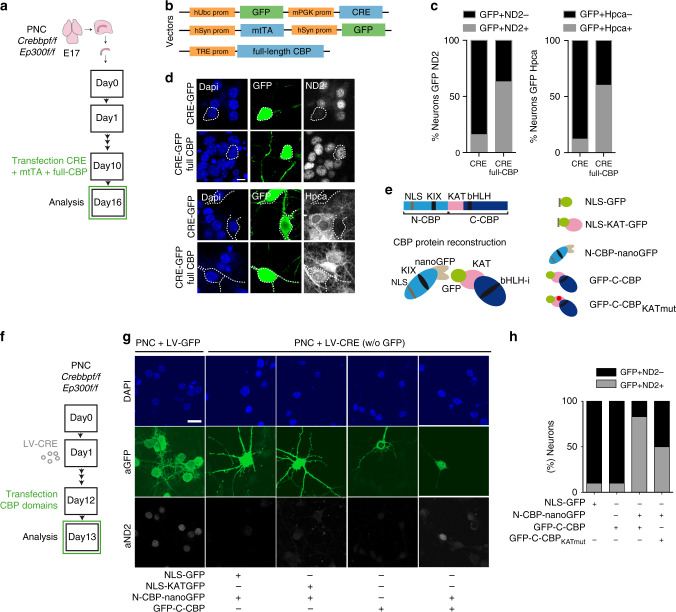
The lysine acetyltransferases type 3 (KAT3) family members CBP and p300 are important transcriptional co-activators, but their specific functions in adult post-mitotic neurons remain unclear. Here, we show that the combined elimination of both proteins in forebrain excitatory neurons of adult mice resulted in a rapidly progressing neurological phenotype associated with severe ataxia, dendritic retraction and reduced electrical activity. At the molecular level, we observed the downregulation of neuronal genes, as well as decreased H3K27 acetylation and pro-neural transcription factor binding at the promoters and enhancers of canonical neuronal genes. The combined deletion of CBP and p300 in hippocampal neurons resulted in the rapid loss of neuronal molecular identity without de- or transdifferentiation. Restoring CBP expression or lysine acetylation rescued neuronal-specific transcription in cultured neurons. Together, these experiments show that KAT3 proteins maintain the excitatory neuron identity through the regulation of histone acetylation at cell type-specific promoter and enhancer regions.


Conflict of interest statement

The authors declare no competing interests.

Figures

Fig. 1
Fig. 1. Loss of both KAT3 proteins causes severe neurological alterations.
a Genetic strategy for the production of inducible, forebrain-specific CBP, p300, and double KAT3 knockouts. b Double immunostaining against CBP and p300 in the CA1 region. The analysis was performed twice with different sets of animals. Scale: 10 μm. c Survival of the three ifKO lines after TMX administration (control, n = 14; dKAT3-ifKO, n = 20). d Left: representative images of control and dKAT3-ifKO brains 2 months after TMX. Scale: 5 mm. Right: quantification of cortical and cerebellar sizes (control, black bars, n = 3; dKAT3-ifKO, red bars, n = 2). Two-tailed t-test: *p-value = 0.024. e Left: Nissl staining of hippocampi 2 months after TMX. Right: quantification of the thickness of the strata pyramidale and radiatum of control (1 m, n = 3; 2 m, n = 3; 7 m, n = 2) and dKAT3-ifKO mice (1 m, n = 6; 2 m, n = 2; 7 m, n = 1) at different time points after TMX. Points show separate observations. Two-way ANOVA; st. radiatum: ***p-valgenot = 1.09e−09, p-valtime = 2.26e−05, **p-valgenot:time = 0.006; st.pyramidale: *p-valgenot = 0.036. Post-hoc Tukey HSD comparison st. radiatum 1 month control—1 month dKAT3-ifKO; ***p-value = 1.7e–06. f Representative images of Golgi staining in the dentate gyrus 1 month after TMX (n = 4). Scale: 100 μm. g Sholl analysis of DG neurons 1 month after TMX (32 neurons from 4 control mice; 38 neurons from 4 dKAT3-ifKOs). The right inset shows representative Neurolucida-reconstructed neurons. Scale: 50 μm. h Electron microscopy images showing the stratum radiatum 1 month after TMX. Arrowheads indicate positions of the synapses (n = 3). Scale: 1 μm. i Number of synapses per μm2 in the stratum radiatum (average of 30 areas from 3 mice per condition). Two-tailed t-test; ***p-val1 month < 0.0001; **p-val2 months < 0.001. j Representative in vivo electrophysiological recordings of spontaneous activity across cortical and hippocampal layers. k Firing frequency (spikes per minute) recorded in CA1 and DG. SUA: single unit analysis (n = 5). Gray lines represent the mean values. Two-tailed t-test: *p-valCA1 = 0.022, p-valDG = 0.028. l Population spike (PS) amplitude in DG after the application of increasing intensities in the perforant pathway (n = 5). Lighter-colored elements show the results for each animal separately. Two-tailed t-test. m Representative evoked potentials waveforms (PS) to 1 mA stimulation. n Immunohistochemistry for cleaved Cas3 shows no sign of apoptosis in the CA1 subfield 1 month after TMX. The analysis was performed twice with different sets of animals. Scale: 30 μm. In panels (d), (e), (g), (i), and (l), data are presented as mean values ± SEM. Source data for graphs in panels (c), (d), (e), (g), (I), (k), and (l) are provided as a Source data file.
Fig. 2
Fig. 2. Hippocampal cells lacking KAT3 fail to express neuronal-specific genes.
a Cumulative graph showing the log2 fold-change value of DEGs in dKAT3-ifKOs (mRNA-seq, 1 month after TMX, n = 3 per genotype). Upregulated genes are presented in red and downregulated genes in blue (p.adj < 0.05 and |log2FC| ≥ 1). The bottom bar graph compares the area in each set. b Volcano plots of RNA-seq analysis. From left to right, we present all genes (left) and the subset of housekeeping genes listed in ref. (right). Gray: genes that are not significantly deregulated; red: upregulated genes; blue: downregulated genes; purple: housekeeping genes. c The 10 most enriched categories identified by Gene Ontology (GO) analysis on up- (red) and downregulated (blue) genes with a p.adj < 0.05 and |log2FC| ≥ 1. The upregulated gene set only retrieved three categories. d RNA-seq profiles for three representative neuronal-specific genes: Rbfox3 (NeuN), Hpca, and Camk4. Scale: 2 kb. e Immunohistochemistry against the neuronal protein encoded by Camk4, Rbfox3 (NeuN), and Hpca. Dashed line labels the position of the stratum pyramidale based on DAPI images (n = 3). Scale: 60 μm. f Loss of NeuN immunoreactivity in DG neurons infected with a cre recombinase-expressing AAV (GFP+). The experiment was performed 3 times with different sets of mice. The virus was injected unilaterally into the DG of adult Crebbpf/f::Ep300f/f mice and the mice were perfused 1 month later (Supplementary Fig. 3e). See Supplementary Fig. 3f for immunostaining against CBP in the same brain slide. Scale: 200 μm. g Scheme representing the strategy to eliminate both KAT3 proteins in hippocampal PNCs from E17 dKAT3f/f embryos. h Representative images showing morphological changes in Crebbpf/f::Ep300f/f hippocampal neurons infected with LV-CRE compared with LV-GFP control (n = 6 in both groups). i RT-PCR demonstrates decreased levels of Neurod2 (ND2), Hpca (hippocalcin), and Rbfox3 (NeuN) transcripts in dKAT3-KO PNCs. In contrast, several housekeeping genes (Ppl1, Pgk1, Rpl23) are unaffected (n = 5–6 in both groups). Data are presented as mean values ± SEM. Two-tailed t-test: ****p < 0.0001, ***p < 0.001, **p < 0.01. Source data for graphs in panel (i) are provided as a Source data file.
Fig. 3
Fig. 3. Cells lacking KAT3 proteins do not die or dedifferentiate, but acquire a novel, molecularly undefined fate.
a Violin plots show the change in expression of gene sets associated with stemness and different neuronal differentiation stages during development (purple bar) or with different cell types in the adult mouse cortex (green bar). Each dot represents a single gene. Number of genes tested per cell type: stem cell = 195, neural stem cell = 365, neuroprogenitor = 200, neuroblast = 109, immature neuron = 353, CA1_pyr mature = 371, S1_pyr mature = 251, interneuron = 337, endothelial = 337, mural = 141, ependymal = 420, microglia = 387, astrocyte = 223, oligodendrocyte = 418. Bar sizes are proportional to the percentage of up- or downregulated genes in each gene set as indicated by the number in each bar. Bar colors indicate the significance of the enrichment (−log10) in a hypergeometric test for the number of regulated genes. Enrichments with p-values < 5e–10 are labeled with an asterisk (p-valInmature_neuron = 4.82e–17; p-valCA1_Pyramidal = 2.59e–101; p-valS1_Pyramidal = 4.69e–25; p-valMicroglia = 3.49e–15). b Scheme of the single-nucleus RNA-seq experiment. c UMAP plot of integrated analysis of snRNA-seq datasets from the dorsal hippocampus of dKAT3-fKOs and control littermates. d UMAP plots showing identified populations in the hippocampus of control littermates (left) and dKAT3-ifKO mice 2 (center) and 4 (right) weeks after TMX treatment. Nuclei are colored by their classification label as indicated. e Boxplots showing the expression of the top 20 markers for the 10 cell types detected in the hippocampus of control mice and the two new clusters detected in dKAT3-ifKO mice 1 month after TMX (Supplementary Data 2). Whiskers lengths are 1.5 the interquartile range from the box. Abbreviations: Pyr, pyramidal; Oligodendr, oligodendrocyte. f, g Single-nucleus trajectory analysis of hippocampal excitatory neurons reveals cell state-transitions toward a non-functional interstate deadlock. Nuclei are colored by experimental condition (f) or cluster subpopulation (g) as indicated in the legends. Loss of dKAT3s caused the progressive relocation of the cells from the root in the branches A, B, and C (expressing markers for different types of excitatory neurons) towards the outcome in branches D and E that are populated by the type of cells described in (e) that do not express distinctive markers. Source data for graphs in panels (a) and (e) are provided as a Source data file.
Fig. 4
Fig. 4. CBP and p300 bind to the same genomic sites.
a Heat maps showing the control CBP/P300 KAT3 ChIP-seq peaks and the signal in the corresponding locations of CBP-, p300-, and KAT3-ifKO. Intensity ranges from strong (black) to weak (white). S: peak start, E: peak end, ±1 kb. b Circos plots of the entire genome (left) and chromosome 9 (right). Below: a snapshot of a gene-rich region in chromosome 9. Colors indicate CBP and p300 binding in hippocampal chromatin and their overlap. Refseq genes in black. c Left: scheme of the FANS/ATAC-seq experiment. Right: flow cytometry sorting plots for control and dKAT3-fKO samples. Boxes indicate the gates used for sorting NeuN+ nuclei (blue). APC-A is the signal of anti-NeuN staining. d Snapshot illustrating the classification of KAT3 peaks in neuronal (green), non-neuronal (red), and pancellular (orange). Representative peaks classified as neuronal, non-neuronal, and pancellular are marked with a green, red, and orange dashed rectangle, respectively. e Classification of KAT3 peaks according to cell specificity (neuronal, pancellular, and non-neuronal) and genomic features (promoter, exon, intron, intergenic). The numbers within each sector represent percentages. f GO enrichment analysis performed on the gene sets associated with neuronal (green), non-neuronal (red), and pancellular (orange) KAT3 peaks. g Volcano plots of RNA-seq analysis for the subset of genes classified as neuronal. Red: upregulated genes; blue: downregulated genes. h BETA analysis of the association between all, neuronal, non-neuronal, and pancellular KAT3 peaks, and transcriptome changes. Neuronal peaks show the strongest association with gene downregulation. p-Values in Kolmogorov–Smirnov test using BETA-cistrome software: p-valAll = 6.24e−17; p-valNeuro = 3.34e−72; p-valNoNeuro = 0.3; p-valPancell = 0.3.
Fig. 5
Fig. 5. H3K27ac is strongly decreased in neuro-specific locations and correlates with gene downregulation.
a Immunostaining against H3K27ac in the CA1 subfield of single and dKAT3 ifKOs (IF signal control: 21.62 ± 2.24, dKAT3-ifKOs: 4.94 ± 1.03, p < 0.0001, unpaired t-test); the single ifKOs show non-significant difference compared to controls. The experiment was repeated 3 times. Scale: 10 μm. b Genome-wide analysis of H3K27ac changes in dKAT3-ifKOs. Volcano plots show the fold change and significance values for all peaks (Global) and for the subsets of neuron-specific (Neuro) and pancellular peaks. c Classification of regulatory regions categorized by genomic features. d Metaplots of ATAC-seq, KAT3, and H3K27ac ChIP-seq signals in neuronal and pancellular enhancers in controls and dKAT3-ifKOs. Plots are centered in the peak center and expanded ±1 kb. e Correlation between length of the enhancer and expression level of the proximal gene. f Number of downregulated genes that contain enhancers or super-enhancers in control mice and percentage that lose acetylation in dKAT3-ifKOs. g Barplot showing the top 10 enriched categories from the Phenotype analysis for genes harboring neuronal enhancers. h TFBS analysis of neuronal (green), non-neuronal (red), and pancellular (orange) KAT3 peaks. Each motif family name is a user-curated approximation to the results provided by the MEME-suite algorithm. The most enriched de novo-identified binding motif in neuronal KAT3 (upper right motif) is very similar to the NeuroD2 motif (bottom right). Log E-values obtained with the expectation maximization algorithm (MEME-ChIP suite): Neuro: bHLH = 1130, GLI = 258, SOX = 257; Pancell: FOX = 130, ETS = 67, SP = 57; NoNeuro: ETV = 157, FOX = 105, SOX = 49. i TFBS analysis of neuronal regions with a reduced ATAC-seq signal in dKAT3-ifKOs. j RNA-seq profiles for Neurod2 and NeuroD6. Scale: 1 kb. k Digital footprinting of NeuroD2 at neuronal and pancellular KAT3-bound regions. Values correspond to normalized Tn5 insertions. l Representative snapshots of KAT3, ATAC, and H3K27ac depletion with bHLH footprint and NeuroD2 overlaps, at two genes that are strongly downregulated in dKAT3-ifKOs. Source data for graphs in panels (e) and (h) are provided as a Source data file.
Fig. 6
Fig. 6. CBP and p300 are needed to maintain the fate of other cellular types.
a Generation of dKAT3-KO astrocytes. Cortical astrocytes from Crebbpf/f::Ep300f/f pups were infected with a cre recombinase-expressing LV. b Cultured dKAT3f/f astrocytes show a downregulation of astrocyte marker GFAP 2 weeks after infection with a cre recombinase-expressing LV (n = 3 for both groups). Scale bar: 20 μm. c The loss of astrocyte morphology is more evident 4 weeks after infection (n = 3 for both groups). Scale bar: 50 μm. d RT-PCR quantification of the Gfap (GFAP), Crebbp (CBP), and Ep300 (p300) transcript levels in cultured dKAT3f/f astrocytes (n = 3). Data are presented as mean values ± SEM. Two-tailed t-test: ****p < 0.0001, ***p < 0.001, **p < 0.01; *p < 0.05. Source data are provided as a Source data file.
Fig. 7
Fig. 7. Full-length CBP is required to restore neuronal-specific transcription.
a Hippocampal PNCs from E17 Crebbpf/f::Ep300f/f embryos were co-transfected with constructs that drive the expression of the Cre recombinase and full-length CBP. b Plasmid combination to express recombinant CBP simultaneously to endogenous CBP and p300 ablation. c Representative images of NeuroD2 and hippocalcin staining in PNC transfected with the constructs shown in (b). Note the reduced expression in the GFP+ cells in the absence of heterologous full-length CBP (experiments in two independent PNCs). Scale: 10 μm. d Quantification of the percentage of NeuroD2-positive or -negative cells and hippocalcin-positive or -negative cells among all GFP-positive cells (n = 60 neurons per condition). e Scheme of the CBP fragments used for rescuing NeuroD2 expression (see Methods for additional details). NLS: nuclear localization domain; KAT: acetyltransferase domain; KIX: kinase-inducible domain interacting domain; bHLH-i: region of interaction with bHLH transcription factors. f Hippocampal PNCs from E17 Crebbpf/f::Ep300f/f embryos were transfected with constructs that drive the expression of the Cre recombinase and the different CBP fragments and the KAT domain shown in panel (e). g Representative images of NeuroD2 staining in PNCs infected with LV-CREw/oGFP and transfected with the different domains of CBP shown in panel (e). PNCs infected with LV-GFP (i.e. with wild type phenotype) were used as a control for baseline NeuroD2 level (2 independent PNCs). Scale: 20 μm. h Quantification of the percentage of NeuroD2-positive or -negative cells among all GFP-positive neurons (n = 30–80 neurons per condition). Source data for graphs in panels (d) and (h) are provided as a Source data file.
Fig. 8
Fig. 8. Locus-specific acetylation restores NeuroD2 transcription.
a Snap view of the Neurod2 locus. The profiles for CBP and p300 binding, H3K27 acetylation and ATAC-seq signal are shown. The bottom orange track corresponds to the NeuroD2 ChIP-seq data generated in ref. . A scheme presenting the strategy used to drive the KAT activity of p300 to the Neurod2 promoter using a fusion protein with dCas9 is also shown. The positions targeted by the gRNAs (red lines, gND2 A-D) are indicated. Note that the target regions are in the proximity of bHLH sites. b Scheme of the co-infection of LVs expressing cre recombinase, dCas9-KAT, and the Neurod2 gRNAs (A-D mix). c Representative image of NeuroD2 protein levels in the cells co-infected with LV-CRE-GFP and the lentiviruses LV-gRNA-mCherry specific for Neurod2 (white arrows). As a specificity control, we conducted the same experiment using a gRNA targeted to Hpca (blue arrows) (n = 4 wells per condition in 2 PNCs). As a comparison, cells infected with LV-CRE-GFP alone (yellow arrows) show strongly diminished NeuroD2 levels as well. Scale bar: 50 μm. d Quantification of different cell subpopulations observed in the experiment shown in panel (c) (n = 4 wells per condition in 2 PNCs). Two-tailed t-test: ****p < 0.0001, ***p < 0.001, **p < 0.01; *p < 0.05. Data are presented as mean values ± SEM. e Scheme of rescue experiment with plasmids carrying dCas9-KAT and the Neurod2 gRNA in dKAT3-KO cells that had already lost Neurod2 expression. f Representative image of NeuroD2 expression in control (PNC + LV-GFP) and dKAT3-depleted (PNC + LV-CRE-GFP) neurons after transfection with dCas9-KAT and gND2-C targeting the NeuroD2 promoter. Arrows indicate LV-CRE-GFP infected cells transfected with the gRNA-carrying vector. A gRNA targeting the hippocalcin promoter was used as a specificity control. Scale: 20 μm. g Quantification of the percentage of transfected cells showing normal NeuroD2 expression after transfection with gND2-C alone and dCas9-KAT co-transfected with gND2-C, gND2-A, gND2-B, or gRNA control independently (experiments in three independent PNCs; n = 30–40 neurons per condition). Source data for graphs in panels (d) and (g) are provided as a Source data file.

References

    1. Hobert O. Regulation of terminal differentiation programs in the nervous system. Annu. Rev. Cell Dev. Biol. 2011;27:681–696. - PubMed
    1. Vierbuchen T, et al. Direct conversion of fibroblasts to functional neurons by defined factors. Nature. 2010;463:1035–1041. - PMC - PubMed
    1. O’Meara MM, Zhang F, Hobert O. Maintenance of neuronal laterality in Caenorhabditis elegans through MYST histone acetyltransferase complex components LSY-12, LSY-13 and LIN-49. Genetics. 2010;186:1497–1502. - PMC - PubMed
    1. Deneris ES, Hobert O. Maintenance of postmitotic neuronal cell identity. Nat. Neurosci. 2014;17:899–907. - PMC - PubMed
    1. Gallegos DA, Chan U, Chen LF, West AE. Chromatin regulation of neuronal maturation and plasticity. Trends Neurosci. 2018;41:311–324. - PMC - PubMed

Publication types

MeSH terms