. 2020 May 22;11(1):2570.
doi: 10.1038/s41467-020-16464-6.

Discrete populations of isotype-switched memory B lymphocytes are maintained in murine spleen and bone marrow

Affiliations

Discrete populations of isotype-switched memory B lymphocytes are maintained in murine spleen and bone marrow

René Riedel et al. Nat Commun. .

Abstract

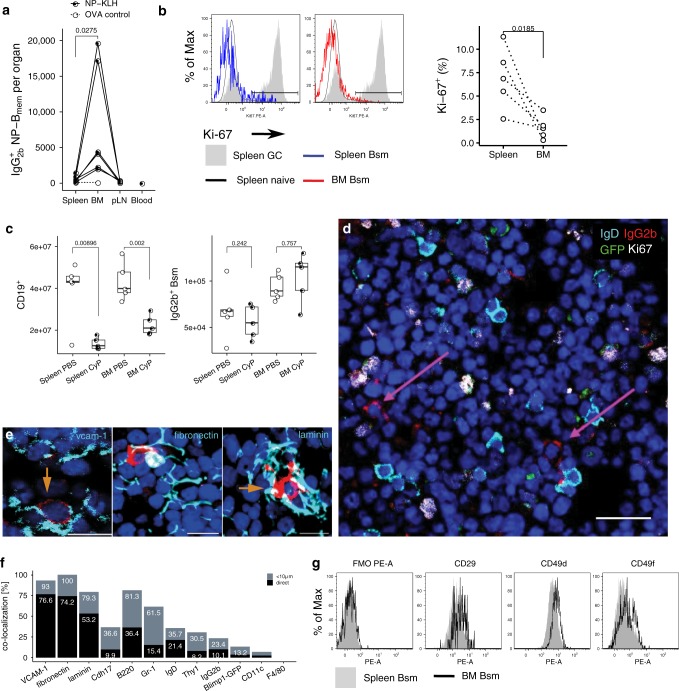
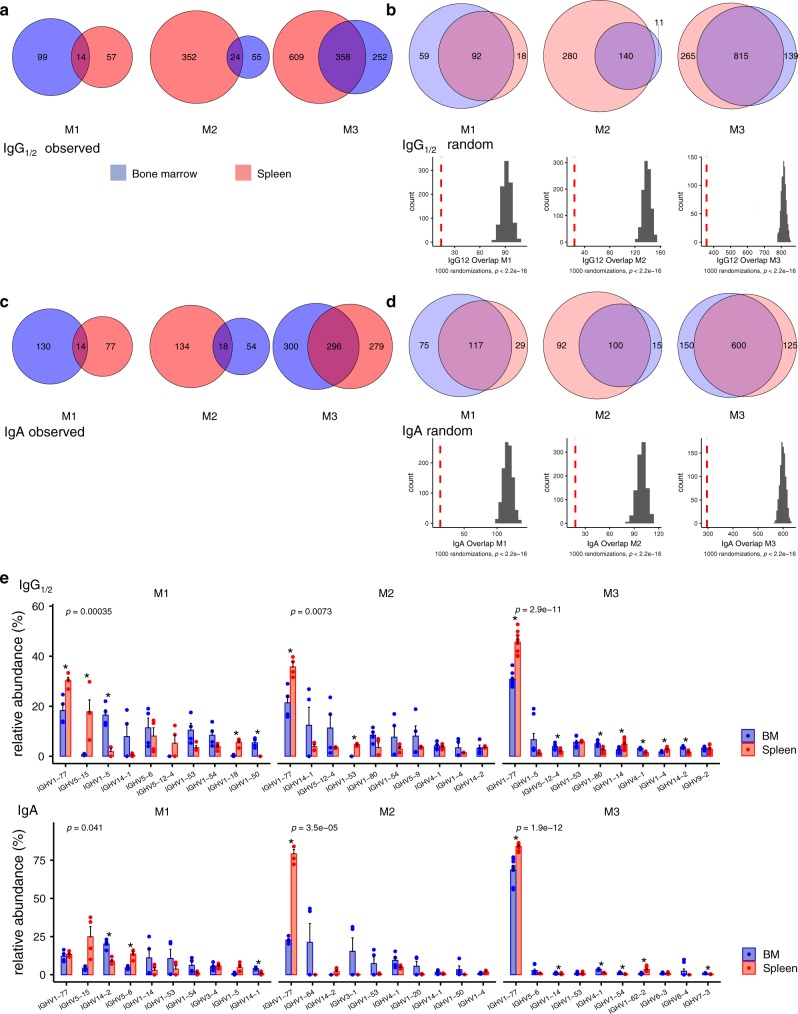
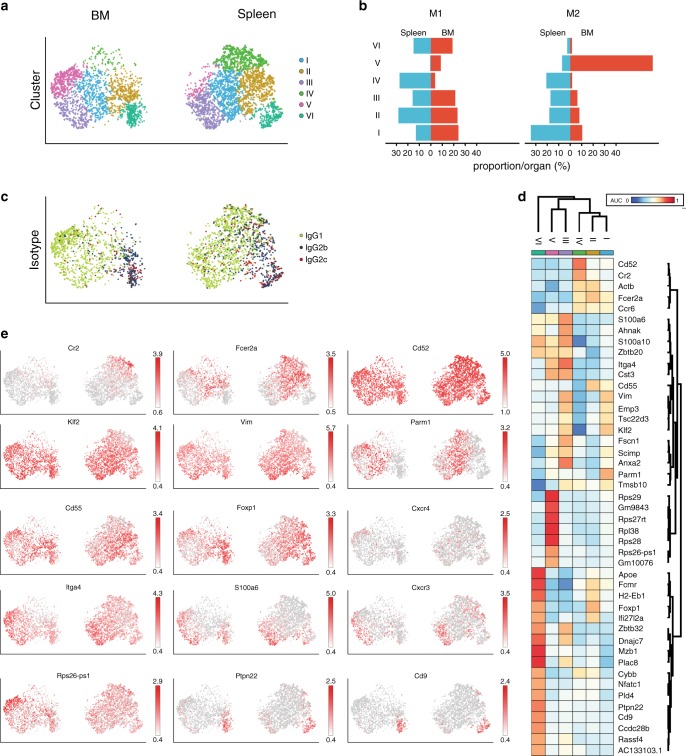
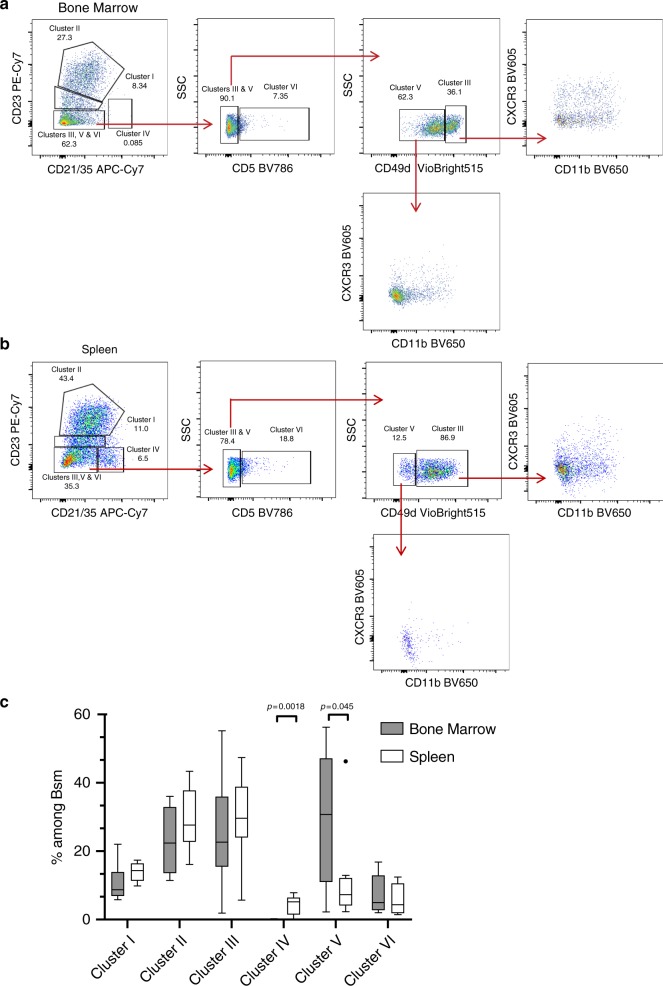
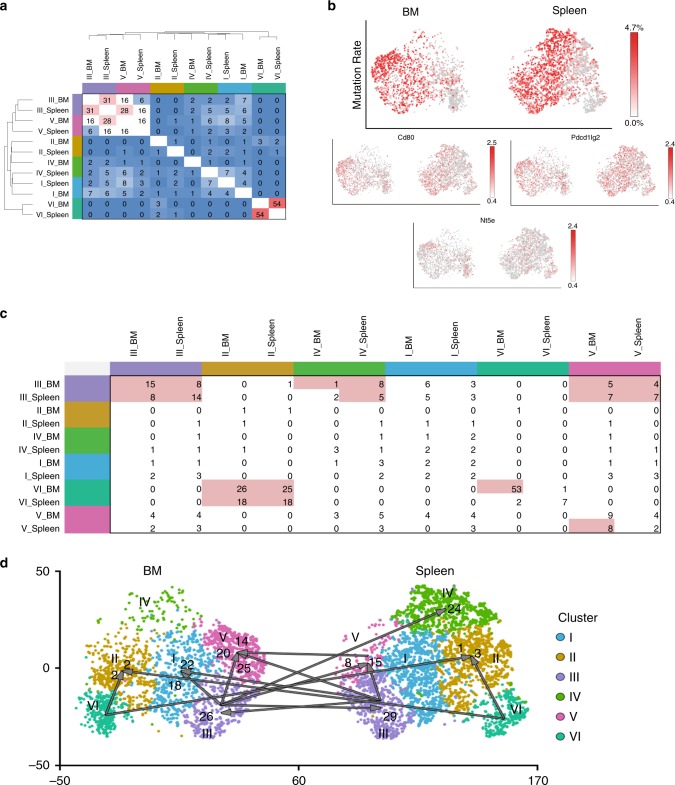
At present, it is not clear how memory B lymphocytes are maintained over time, and whether only as circulating cells or also residing in particular tissues. Here we describe distinct populations of isotype-switched memory B lymphocytes (Bsm) of murine spleen and bone marrow, identified according to individual transcriptional signature and B cell receptor repertoire. A population of marginal zone-like cells is located exclusively in the spleen, while a population of quiescent Bsm is found only in the bone marrow. Three further resident populations, present in spleen and bone marrow, represent transitional and follicular B cells and B1 cells, respectively. A population representing 10-20% of spleen and bone marrow memory B cells is the only one qualifying as circulating. In the bone marrow, all cells individually dock onto VCAM1+ stromal cells and, reminiscent of resident memory T and plasma cells, are void of activation, proliferation and mobility.


Conflict of interest statement

The authors declare no competing interests.

Figures

Fig. 1
Fig. 1. The bone marrow contains a major population of isotype-switched non-proliferating memory B cells.
a Quantification of NP-specific IgG2a/b+ spleen, peripheral lymph nodes, blood and bone marrow (BM) memory B cells. Female C57BL/6 mice immunized with NP-KLH/LPS SC. Numbers of NP-binding IgG2b+ cells in Spleen, BM, blood, and peripheral lymph nodes (pLN) determined by flow-cytometry on d421 or d426 post immunization; pooled from two independent experiments. OVA ctrl: staining controls from mice immunized with the irrelevant antigen ovalbumin (OVA). Gated for IgG2b+CD19+CD38+CD138GL7CD11cIgMIgDPI small lymphocytes (cf. Supplementary Fig. 5). Lines connect samples from one individual, paired one-sided t-test for spleen and BM samples. b Flow-cytometric quantification of Ki-67 expression in IgG2b+ Bsm (IgG2b+CD19+CD38+CD138GL7CD11cIgMIgDPI small lymphocytes) splenic naïve (IgM+IgD+IgG2bCD19+CD38+CD138GL7CD11c PI small lymphocytes) and germinal center (GC) (CD19+CD38loGL7+CD11cPI lymphocytes) B cells. Frequencies of Ki-67+ cells within the subset, data in right graph from two independent experiments using pooled cells from 4 to 20 C57BL/6 mice, paired one-sided t-test. c Flow-cytometric quantification of CD19+ B cells and IgG2b+ memory B cells in female C57BL/6J mice treated with Cyclophosphamide (CyP) or untreated controls (PBS) after immunization with 3× NP-CGG/IFA. Analysis performed after 7 days of CyP. IgG2b+ B cells quantified as IgG2b+CD19+CD38+CD138GL7CD11cIgMIgDPI small lymphocytes, CD19+ B cells as CD19+CD138PI lymphocytes (Welch’s test, one-sided). Representative data for one of two independent experiments (n = 5 per group). Boxplot indicates median, first and third quartiles, whiskers: 1.5 IQR. d IgG2b+ B memory cells (Ki-67 IgD Blimp1GFP) are dispersed as single cells throughout the BM. Arrows indicate IgG2b+DAPI+ cells. Scale bar: 20 µm. Micrograph representative of five slides from two female C57BL/6 mice. e Co-localization of IgG2b+GFPIgDIgG2b+ cells (arrows) with mesenchymal stromal cells. Arrows indicate IgG2b+DAPI+ cells. Representative micrograph. Scale bars: 10 µm. f Co-localization of IgG2b+ cells to mesenchymal stromal cells. Graph shows frequency of IgG2b+ cells in direct contact (black) or within 10 μm (gray) of a cell stained for the respective molecule. g Flow cytometric quantification of surface expression of the VLA-4 and VLA-6 components CD29, CD49d, CD49f in spleen and BM IgG2b+ Bsm. Gated for IgG2b+CD19+CD38+CD138GL7CD11cIgMIgDPI small lymphocytes, histogram plots representative of three biological replicates from C57BL/6 females. Source data for Fig. 1a–c, f are provided as a Source Data file.
Fig. 2
Fig. 2. Spleen and bone marrow isotype-switched memory B cells are distinct in Ig heavy chain repertoire.
a, c Observed overlap between the IgG1/2+ or IgA+ heavy chain CDR3 repertoire of switched memory B cells from spleen and bone marrow (BM) or b, d random distribution (upper panels). Venn diagrams represent clonotype presence in a given sample: numbers indicate clonotypes present in one organ exclusively or in both (overlap). Random distributions (b, d) show median values for 1000 random distributions drawn while retaining the number of clones initially observed in the sample. Histograms (b, d, lower panels) represent number of clonotypes in spleen and BM in 1000 randomized distributions of observed clonotypes to spleen and BM, dashed red line indicates experimentally observed number of clonotypes present in both spleen and BM. P value of one-sided t-test for difference of randomized overlap against observed. e VH gene recruitment to spleen and BM IgG1/2+ (upper panel) and IgA+ (lower panel) memory B cells, represented as frequency of a particular VH gene among total CDR3s per organ. Bars show relative abundance of the ten most abundant VH genes, error bars indicate SEM. Significance of difference in VH gene distribution to Spleen and BM assessed by MANOVA, P values corrected for multiple testing (Benjamini-Hochberg), * indicates significant difference in means for a particular VH gene (Welch’s test, two-sided). M1–M3: replicate samples of three female C57BL/6 mice immunized 3× NP-CGG/IFA. Only clones consistently found in technical replicates were considered. Source data for Fig. 2a–e are provided as a Source Data file.
Fig. 3
Fig. 3. Heterogeneity of switched memory B cells is differentially represented in spleen and bone marrow.
Cells for single cell sequencing were FACSorted as IgG-expressing CD19+CD38+CD138-GL7 small lymphocytes. a Six transcriptionally defined clusters were identified by shared nearest neighbor (SNN) modularity optimization based clustering algorithm mapped to tSNE representation of spleen and bone marrow (BM) cells. tSNE coordinates and clustering was computed for 4754 from spleen and 2947 from BM cells, presentation is separated by organ. b Percentage of cells per cluster in each organ by mouse. c Distribution of IgG subclass mapped on tSNE. d Signature genes for each cluster, area under curve (AUC) of receiver-operator characteristics (ROC) of >0.7. e Distribution of transcription levels for representative genes mapped on tSNE. Cells for single cell sequencing were FACSorted as IgG-expressing CD19+CD38+CD138GL7 small lymphocytes from female C57BL/6 mice. Source data are provided as a Source Data file.
Fig. 4
Fig. 4. Surface staining of CD21/35, CD23, CD5, and CD49d resolves six distinct populations of switched memory B cells in spleen and bone marrow.
a, b Flow-cytometric identification of distinct populations among IgG+ memory B cells gated as IgG1+/IgG2b+ CD19+IgMIgDCD138GL7CD93 live small lymphocytes (cf. Supplementary Fig. 5) in bone marrow (BM) (a) and spleen (b) of female C57BL/6 mice. CD21/35 and CD23 resolve three subsets resembling clusters I, II, and IV as identified by transcriptional profiles. Expression of CD5 separates the CD21/35CD23 population to a subset resembling cluster VI while CD5− cells are divided by high and intermediate staining of CD49d into two subsets, which differ in expression of CXCR3 and CD11b and resemble clusters III and V. Dotplots represent one of eight mice immunized 3× with NP-CGG/IFA. c Boxplots represent the frequency of subsets by cytometry according to expression of CD21/35, CD23, CD5, and CD49d among IgG+ Bsm. A non-parametric ANOVA (Friedman test) was performed (Two-stage linear step-up procedure of Benjamini, Krieger, and Ykutieli) P < 0.0001, followed by a one-sided paired t-test between spleen and BM cluster IV and V, respectively, n = 8. Boxplot indicates median, first and third quartiles, whiskers: 1.5 IQR. Source data for Fig. 4c is provided as a Source Data file.
Fig. 5
Fig. 5. Clonal trajectories connect predominantly clusters III and V of spleen and bone marrow.
a Percentage of shared clones between clusters of spleen and bone marrow. Clones were defined according to IgG heavy and light chain genes. Clones were randomly redistributed to clusters. Overlap significantly higher than random (P < 0.05, randomization test) indicated by red shading, white represents expected random overlap, and blue shading overlap lower than random, i.e., exclusive repertoires. b Mutation rates (percent of nucleotide sequence; upper panel) and CD80 (Cd80), CD73 (Nt5e), and PD-Ligand 2 (Pdcd1lg2) gene expression of individual cells. Cells for single cell sequencing were isolated by FACS as IgG+CD19+CD38+CD138GL7 small lymphocytes. c Frequencies of Bsm clones represented with higher mutation rates in clusters listed in rows, as compared to clusters listed in columns. Significant presence of clone members with additional mutations as compared to random distribution (P < 0.01, randomization test) is shaded in red. d Trajectories are based on accumulation of mutations within clones. Represented are significant trajectories (P < 0.01, randomization test). Arabic numerals indicate numbers of clones with additional mutations. Randomized redistribution of clones was performed 1000 times (a, c, d). Source data is provided as a Source Data file.

References

    1. Park CO, Kupper TS. The emerging role of resident memory T cells in protective immunity and inflammatory disease. Nat. Med. 2015;21:688–697. - PMC - PubMed
    1. Manz RA, Thiel A, Radbruch A. Lifetime of plasma cells in the bone marrow. Nature. 1997;388:133–134. - PubMed
    1. Chang HD, Tokoyoda K, Radbruch A. Immunological memories of the bone marrow. Immunol. Rev. 2018;283:86–98. - PMC - PubMed
    1. Giesecke C, et al. Tissue distribution and dependence of responsiveness of human antigen-specific memory B cells. J. Immunol. 2014;192:3091–3100. - PubMed
    1. Mamani-Matsuda M, et al. The human spleen is a major reservoir for long-lived vaccinia virus-specific memory B cells. Blood. 2008;111:4653–4659. - PubMed

Publication types

MeSH terms

Substances