. 2020 May 22;11(1):2584.
doi: 10.1038/s41467-020-16327-0.

An integrated multi-omics approach identifies the landscape of interferon-α-mediated responses of human pancreatic beta cells

Affiliations

An integrated multi-omics approach identifies the landscape of interferon-α-mediated responses of human pancreatic beta cells

Maikel L Colli et al. Nat Commun. .

Abstract

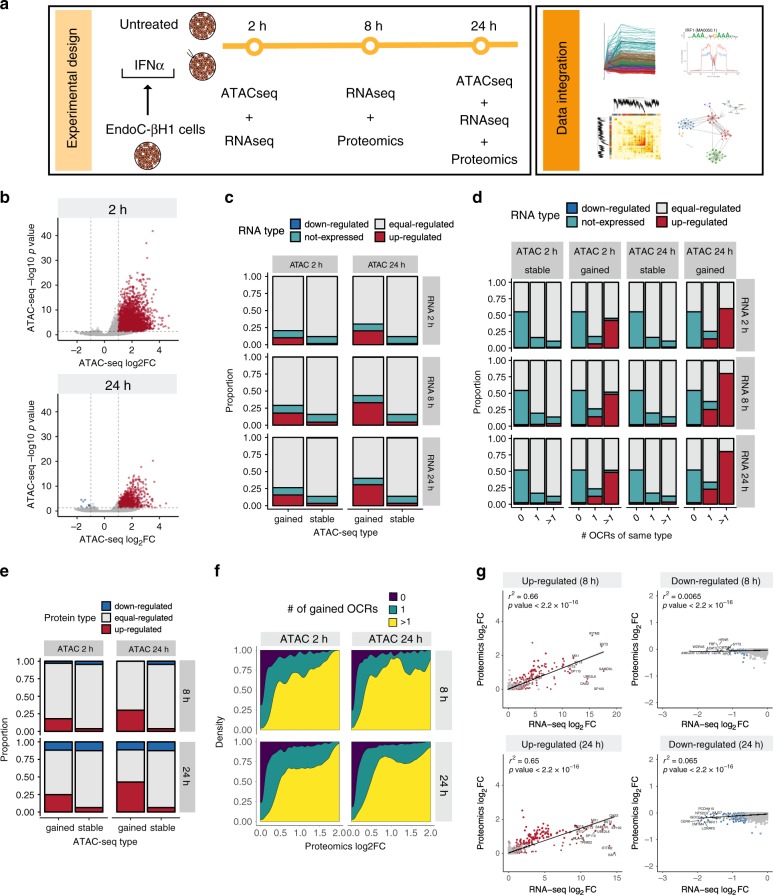
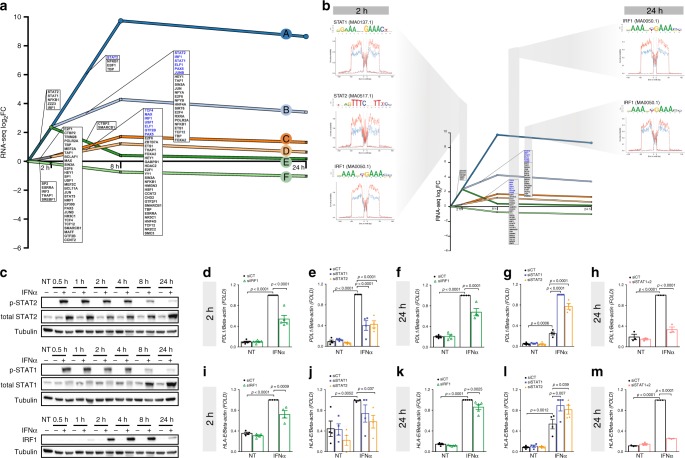
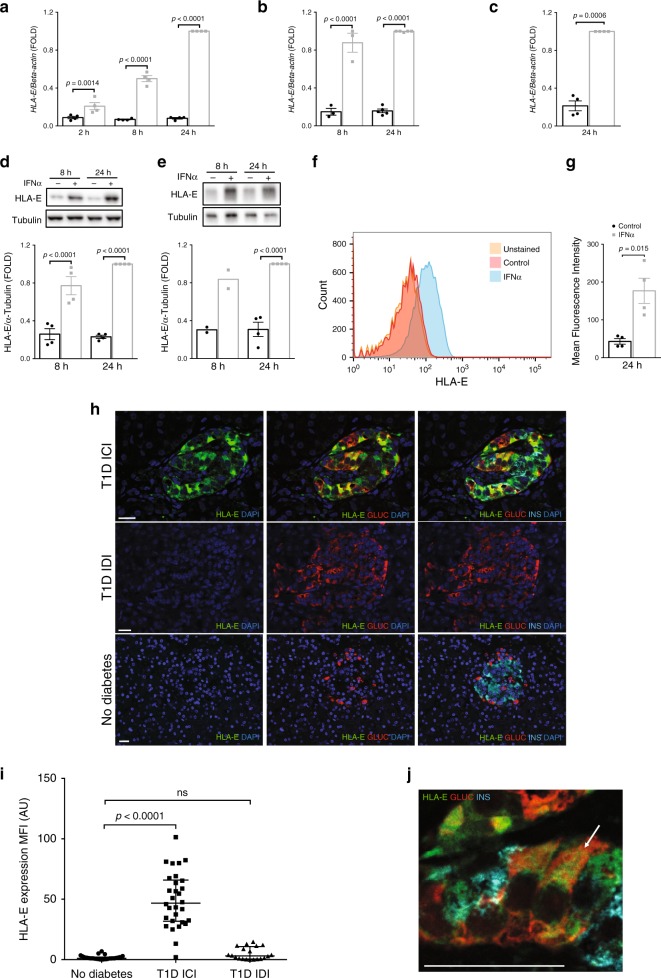
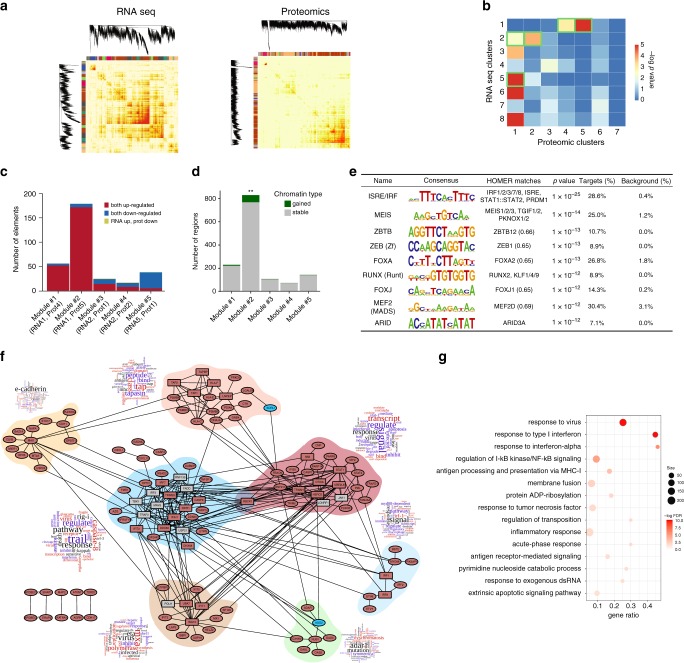
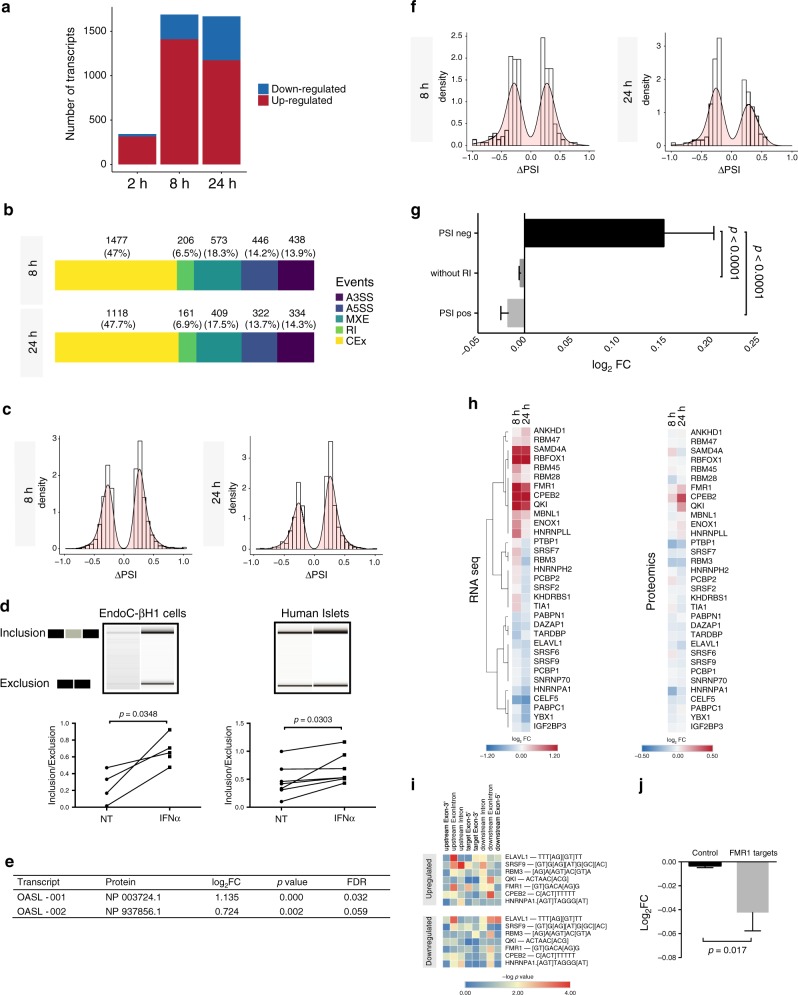
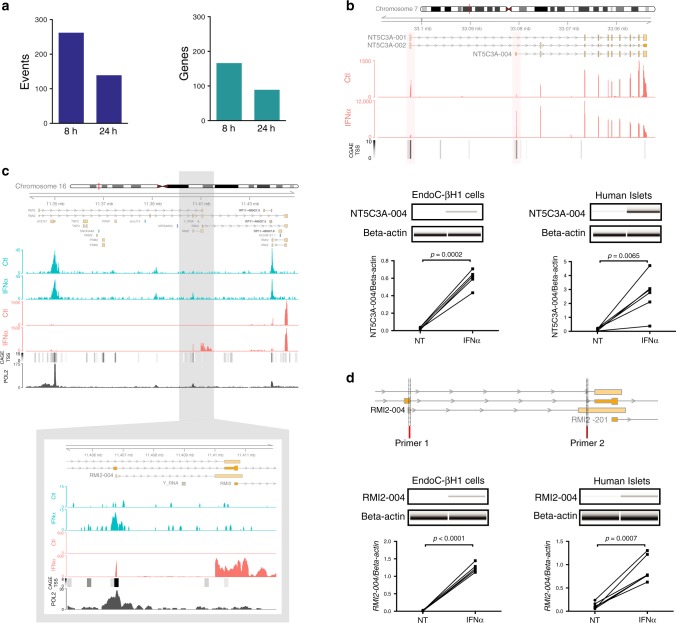
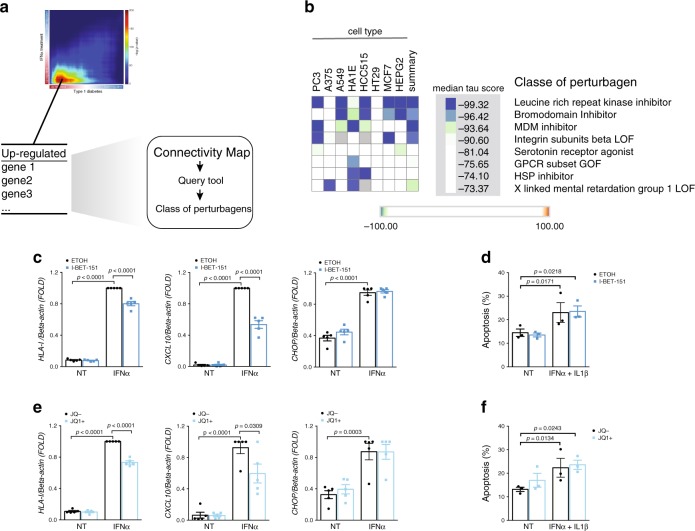
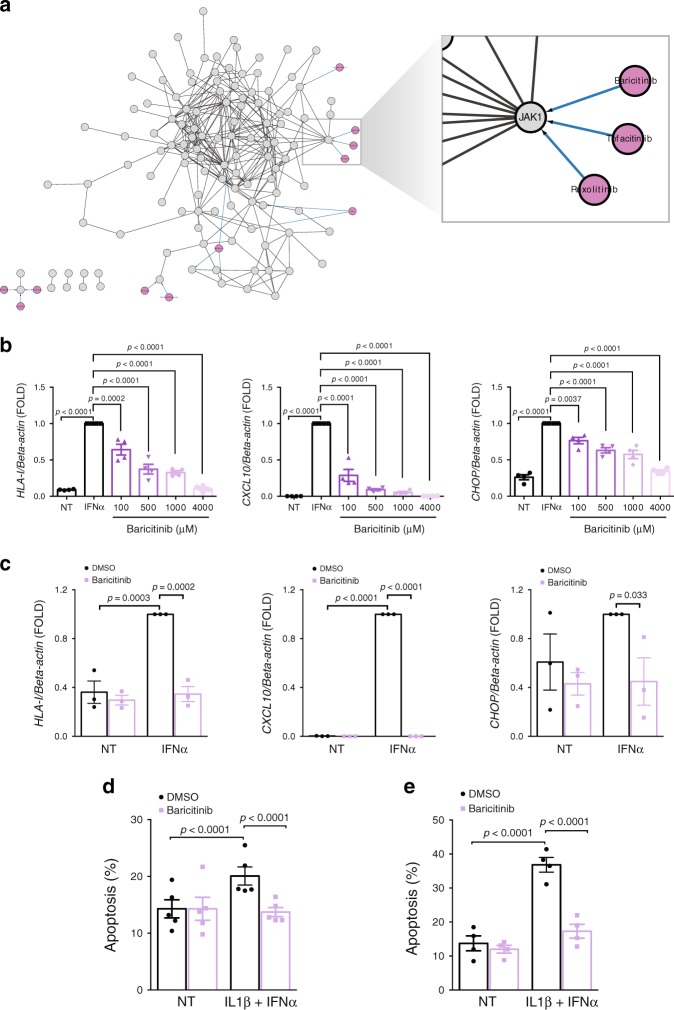
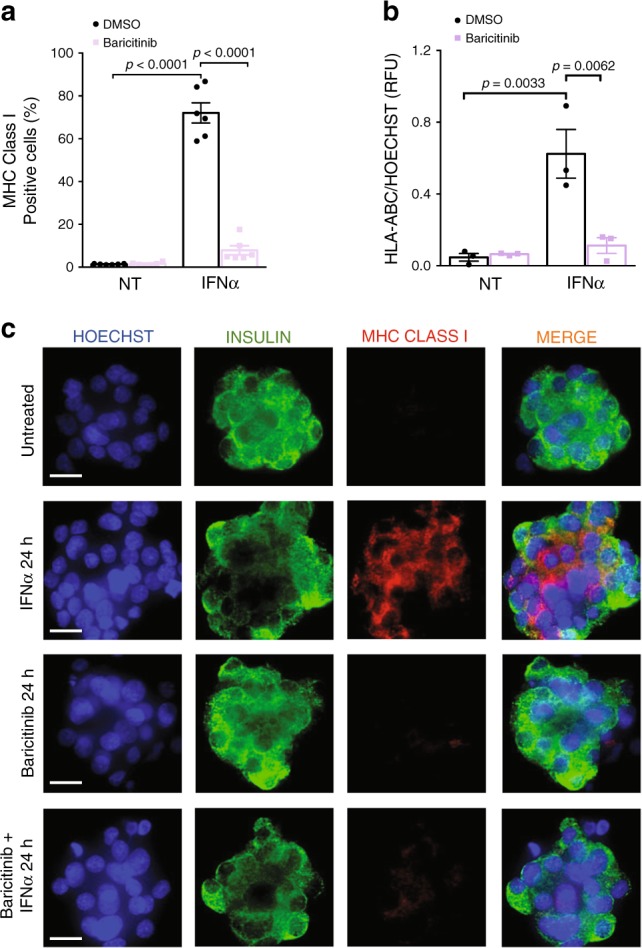
Interferon-α (IFNα), a type I interferon, is expressed in the islets of type 1 diabetic individuals, and its expression and signaling are regulated by T1D genetic risk variants and viral infections associated with T1D. We presently characterize human beta cell responses to IFNα by combining ATAC-seq, RNA-seq and proteomics assays. The initial response to IFNα is characterized by chromatin remodeling, followed by changes in transcriptional and translational regulation. IFNα induces changes in alternative splicing (AS) and first exon usage, increasing the diversity of transcripts expressed by the beta cells. This, combined with changes observed on protein modification/degradation, ER stress and MHC class I, may expand antigens presented by beta cells to the immune system. Beta cells also up-regulate the checkpoint proteins PDL1 and HLA-E that may exert a protective role against the autoimmune assault. Data mining of the present multi-omics analysis identifies two compound classes that antagonize IFNα effects on human beta cells.


Conflict of interest statement

The authors declare no competing interests.

Figures

Fig. 1
Fig. 1. Exposure of EndoC-βH1 cells to interferon-α promotes changes in chromatin accessibility, which are correlated with gene transcription and translation.
a EndoC-βH1 cells were exposed or not to IFNα (2000 U/ml) for the indicated time points and different high-throughput techniques were performed to study chromatin accessibility (ATAC-seq, n = 4), transcription (RNA-seq, n = 5) and translation (Proteomics, n = 4). b Volcano plot showing changes in chromatin accessibility measured by ATAC-seq. Open chromatin regions indicated as gained (red) or lost (blue) had an absolute log2 fold-change (|log2FC|) > 1, and a false discovery rate (FDR) < 0.05. The regions that did not reach such threshold were considered “stable” (gray). c, d Frequency of upregulated, downregulated or stable transcripts in the vicinity (<20 kb transcription start site (TSS) distance) of one or multiple open chromatin regions (OCRs) as classified in b. e Frequency of differentially abundant proteins in the vicinity (<20 kb TSS distance) of gained or stable open chromatin regions. f Distribution of IFNα-induced changes in protein abundance among upregulated proteins based on the number of linked gained OCRs. g Correlation between RNA-seq and proteomics of EndoC-βH1 cells exposed to INFα. The x axis represents the mRNA log2FC. The most upregulated (log2FC > 0.58, FDR < 0.05) and downregulated (log2FC < −0.58, FDR < 0.05) mRNAs are filled in red and blue, respectively. The y axis indicates the proteomics log2FC. The proteins most upregulated (log2FC > 0.58, FDR < 0.15) or downregulated (log2FC < −0.58, FDR < 0.15) are represented by red and blue borders, respectively. mRNAs and proteins not meeting these criteria were considered equal-regulated (gray fill and border, respectively).
Fig. 2
Fig. 2. IRF1, STAT1 and STAT2 regulate IFNα-induced transcription and the expression of checkpoint proteins.
a The regulatory paths summarize the temporal patterns of the differentially expressed genes (DEG) detected by RNA-seq (|log2FC|> 0.58 and FDR < 0.05, n = 5) (evaluated by DREM). The x axis represents the time and the y axis the mRNA log2FC. Each path corresponds to a set of co-expressed genes. Split nodes (circles) represent a temporal event where co-expressed genes diverge in expression. In blue are the TFs upregulated at the respective time points of the RNA-seq that may regulate the pathways. b IFNα promoted TFs footprint deepening in open chromatin regions (OCR) associated to genes from the indicated DREM pathways. OCRs were associated to the nearest gene TSS with a maximum distance of 1 Mb. Previously annotated TF matrices were used to identify differential DNA-footprints induced by IFNα (blue lines = untreated cells, red lines = IFNα (24 h), dashed lines = reverse strand, continuous line = forward strand, Methods, n = 4). c Time course profile of STAT1, STAT2 and IRF1 protein activation in EndoC-βH1 cells exposed to IFNα (representative of four independent experiments). dm EndoC-βH1 cells were transfected with an inactive control siRNA (siCT) or previously validated, siRNAs targeting IRF1 (siIRF1), STAT1 (siSTAT1), STAT2 (siSTAT2) or STAT1 plus STAT2 (siSTAT1 + 2). After 48 h the cells were exposed to IFNα The values were normalized by the housekeeping gene β-actin (mRNA) and then by the highest value of each experiment considered as 1 (for h and m (n = 3); for eg, i, j and l (n = 4); for d, k (n = 5)), ANOVA with Bonferroni correction for multiple comparisons (dm). Values are mean ± SEM (dm). Source data are provided as Source Data file.
Fig. 3
Fig. 3. HLA-E is overexpressed in pancreatic islets of T1D individuals.
EndoC-βH1 cells (a, d), human islets (b, e) or FACS-purified human beta cells (c) were exposed (gray bars) or not (black bars) to IFNα for the indicated time points and HLA-E mRNA (ac) and protein (d, e) evaluated. The values were normalized by the housekeeping gene β-actin (mRNA) or α-tubulin (protein) and then by the highest value of each experiment considered as 1 (for a (n = 4); b (n = 3 (8 h), n = 5 (24 h)); c (n = 4); d (n = 4) and e (n = 2 (8 h), n = 4 (24 h)), ANOVA with Bonferroni correction for multiple comparisons (ae)). f, g HLA-E cell surface expression was quantified in EndoC-βH1 cells by flow cytometry. Histograms (f) represent changes in mean fluorescence intensity (MFI). The MFI values (g) were quantified at baseline and after 24 h exposure to IFNα (n = 4, two-sided paired t-test). Values are mean ± SEM (ag). h Immunostaining of HLA-E (green), glucagon (red) and insulin (light blue) in representative islets from individuals with or without diabetes. The top and middle panels represent an insulin-containing islet (ICI) and insulin-deficient islet (IDI) from T1D sample DiViD 3, and the lower panel represents an islet from a control donor (EADB sample 333/66). DAPI (dark blue). Scale bar 20 μm. i The MFI analysis of HLA-E expression. 30 ICIs from 6 independent individuals with T1D (5 islets per individual), 20 IDIs from 4 independent individuals with T1D (5 islets per individual), and 30 ICIs from 6 independent individuals without diabetes (5 islets per individual) were analyzed. Values are median ± interquartile range; ANOVA with Bonferroni correction for multiple comparisons, AU (arbitrary units), ns = (non-significant). j Higher magnification image demonstrating that HLA-E (green) localizes predominantly to alpha cells in a T1D donor islet (glucagon (red); insulin (light blue)) but is also expressed in beta cells, as indicated in h and j. Scale bar 30 μm. Source data are provided as Source Data file.
Fig. 4
Fig. 4. Weighted correlation network analysis (WGCNA) identifies IFNα-regulated mRNA and protein modules.
a Heatmap representation of the topological overlap matrix. Rows and columns correspond to single genes/proteins, light colors represent low topological overlap, and progressively darker colors represent higher topological overlap. The corresponding gene dendrograms and initial module assignment are also displayed. b Identification of modules presenting significant overlap (FDR < 0.05 and a minimum of 10 members in common) (green border) between differentially expressed genes (DEG) and their translated differentially abundant proteins (DAP). c Composition, number of elements and type of DEG and DAP present in each of the significantly overlapping modules. d ATAC-seq-identified open chromatin regions at 2 h were linked to gene transcription start sites (TSSs) in a 40 kb window. These genes and their open chromatin regions were associated to the modules of DEG and DAP. The enrichment for gained open chromatin regions was then evaluated in each module. (** represents a p-value = 0.002343, one-sided χ2 test). e De novo HOMER motifs present in the ATAC-seq regions overlapping module #2 as described in Methods. The unadjusted p-values were obtained using the hypergeometric test from the HOMER package. f The protein–protein interaction (PPI) network of module #2 was done using the InWeb InBio Map database. Enriched proteins (FDR < 0.05 and minimum number of connections = 5, represented as squares) were identified and added to the network if they were not already present. Red fill identifies upregulated proteins, blue fills downregulated proteins and gray fill equal-regulated. Colored regions delimitate communities of proteins, as described in Methods. The wordcloud next to each community presents their enriched geneRIFs terms. g The biological processes (GO) overrepresented in module #2 summarize the main findings observed in IFNα-treated human beta cells. The present results were based on RNA-seq (n = 5) and proteomics (n = 4) data of EndoC-βH1 cells.
Fig. 5
Fig. 5. Interferon-α changes the alternative splicing landscape.
a EndoC-βH1 cells were exposed to IFNα for the indicated time points. The significantly upregulated (red) and downregulated (blue) transcripts were identified using Flux Capacitor (n = 5, |log2FC| > 0.58 and FDR < 0.05). b Frequency of individual alternative splicing events regulated by IFNα (n = 5, |ΔPSI| > 0.2, minimum 5 reads, FDR < 0.05). c Frequency distribution of alternative cassette exon (CEx) events altered by IFNα ((n = 5, ΔPSI) > |0.2| and FDR < 0.05). d Confirmation of the increased exon 4 inclusion in the antiviral gene OASL by IFNα (24 h). cDNA was amplified by RT-PCR using primers located in the upstream and downstream exons of the splicing event and the product evaluated using a Bioanalyzer 2100 (n = 4 (EndoC) and n = 7 (human islets), two-sided paired t-test). e The log2FCs of the proteins coding for OASL-001 and −002 isoforms from IFNα-treated EndoC-βH1 cells proteomics (24 h) (n = 4). f Frequency distribution of retained intron (RI) events altered by IFNα (n = 5, |ΔPSI| > 0.2 and FDR < 0.05). g The protein log2FC values obtained by proteomics analysis of EndoC-βH1 cells exposed to IFNα for 24 h were classified in three categories according to the levels of retained intron ΔPSI (n = 5, mean ± SEM, ANOVA with Bonferroni correction). h Expression of RNA-binding proteins (left) that are significantly modified at mRNA level (FDR < 0.05) after exposure to IFNα and their respective proteins (right) in the indicated time points (n = 4–5). i Positional enrichment of motifs from significantly modified RBPs among regions involved in the regulation of modified cassette exons (CEx) after exposure to IFNα for 24 h. (n = 5, |ΔPSI| > 0.2, FDR < 0.05). j Comparison between the log2FC of a curated list (Supplementary Table 1) of known FMR1 target proteins against the log2FC of the remaining proteins detected by the proteomics of EndoC-βH1 cells exposed to IFNα for 24 h (n = 4, mean ± SEM; two-sided unpaired t-test). Source data are provided as a Source Data file.
Fig. 6
Fig. 6. Changes in the alternative transcription start site (TSS) initiation increase the repertoire of IFNα-regulated transcripts.
a The tool SEASTAR was used to estimate the frequency of differential alternative first exon (AFE) usage induced by IFNα in human beta cells. The total number of IFNα-dependent AFEs events (left) and number of genes with AFEs (right) in the indicated time point are shown (n = 5, ΔPSI > |0.2|, FDR < 0.05). b View of the NT5C3A locus showing the transcripts with AFE usage, the RNA-seq (red) signals of EndoC-βH1 cells exposed or not to IFNα and the CAGE TSSs information (black scale) (upper panel). Confirmation of the AFE usage identified by SEASTAR in the gene NT5C3A (lower panel). cDNA was amplified by RT-PCR using primers located in the AFE and in its downstream exon. The PCR products were analyzed by automated electrophoresis using a Bioanalyzer 2100 and quantified by comparison with a loading control. The values were then corrected by the housekeeping gene β-actin. (n = 4 (EndoC) and n = 6 (human islets), two-sided paired t-test). c View of the RMI2 locus showing all the transcripts in this region, the ATAC-seq (blue) and the RNA-seq (red) signals of EndoC-βH1 cells exposed or not to IFNα for 24 h, the CAGE TSSs information (black scale) and RNA polymerase II ChIP-seq signal of human K562 cells exposed to IFNα (black). A higher magnification of the RMI2-004 locus is presented below (image representative of 4–5 independent experiments). d Confirmation of the AFE usage in the gene RMI2. Genome mapping (upper part) showing the genomic regions used to design-specific primers located in the AFE of the transcript RMI2-004 and in its downstream exon. The PCR product was analyzed by automated electrophoresis using a Bioanalyzer 2100 and quantified by comparison with a loading control. The values were then corrected by the housekeeping gene β-actin. (n = 4 (EndoC) and n = 6 (human islets), two-sided paired t-test). Source data are provided as a Source Data file.
Fig. 7
Fig. 7. Mining the type I interferon signature of pancreatic beta cells for identification of potentially T1D therapeutic targets.
a The top 150 upregulated genes identified in Supplementary Fig. 2d were used to query the Connectivity MAP database of cellular signatures. b Connectivity map classes of perturbagens that promote an opposite signature to the one shared between beta cells of T1D individuals and EndoC-βH1 cells exposed to IFNα (Supplementary Fig. 2d). c, e EndoC-βH1 cells were pretreated for 2 h with the bromodomain inhibitors I-BET-151 (1 μM) (c) or JQ1 + (0.4 μM) (e) and then exposed to IFNα for 24 h. Cells were collected and the mRNA expression for HLA class I (ABC), the chemokine CXCL10 and the ER stress marker CHOP (DDIT3) evaluated. Ethanol (vehicle) and an inactive enantiomer (JQ1−) were used as respective controls for I-BET-151 and JQ1+. (n = 5, mean ± SEM, ANOVA with Bonferroni correction for multiple comparisons). d, f Cell viability after exposure to the combination of cytokines IFNα (2000 U/ml) + IL1β (50 U/ml) in the presence or not of the bromodomain inhibitors (n = 3, mean ± SEM, ANOVA with Bonferroni correction for multiple comparisons).
Fig. 8
Fig. 8. Establishing JAK1 inhibition as protective mechanism against IFNα-mediated inflammation and apoptosis.
a The PPI network of module #2 was integrated with the DrugBank repository using the CyTargetLinker app in Cytoscape. A higher magnification on JAK1 is shown. b EndoC-βH1 cells were pretreated with DMSO (NT) or baricitinib at the indicated concentrations for 2 h. Cells were then left untreated (black bars), or treated with IFNα alone (white bars) without or with the presence of different concentrations of baricitinib (purple scale bars) for 24 h and mRNA expression of HLA class I (ABC), CXCL10 and CHOP (DDIT3) analyzed. The values were normalized by the housekeeping gene β-actin and then by the highest value of each experiment considered as 1 (n = 4, mean ± SEM, ANOVA with Bonferroni correction for multiple comparisons). c Human islets were pretreated with baricitinib (4 μM) or DMSO (vehicle) and then exposed or not to IFNα for 24 h in the presence or not of baricitinib. mRNA expression of HLA class I (ABC), CXCL10 and CHOP (DDIT3) was analyzed and values normalized by the housekeeping gene β-actin and then by the highest value of each experiment considered as 1. (n = 3, mean ± SEM, ANOVA with Bonferroni correction for multiple comparisons). d, e EndoC-βH1 cells (d) and human islets (e) were pretreated with DMSO or baricitinib (4 µM) for 2 h. Subsequently, cells were left untreated or treated with IFNα (2000 U/ml) + IL1β (50 U/ml) in the absence or presence of baricitinib for 24 h. Cell viability was evaluated using nuclear dyes by two independent observers. (d (n = 5), e (n = 4), mean ± SEM, ANOVA with Bonferroni correction for multiple comparisons). Source data are provided as a Source Data file.
Fig. 9
Fig. 9. Baricitinib decreases IFNα-mediated MHC class I protein expression in beta cells.
a EndoC-βH1 cells were pretreated with baricitinib (4 μM) or DMSO and then exposed or not to IFNα for 24 h in the presence or not of baricitinib. MHC class I (ABC) protein expression was measured by flow cytometry. The percentage of positive cells was quantified. (n = 6, mean ± SEM, ANOVA with Bonferroni correction for multiple comparisons). b, c Dispersed human islets were pretreated with baricitinib (4 μM) or DMSO (vehicle). Next, cells were left untreated, treated with IFNα alone or with IFNα in the presence of baricitinib for 24 h. MHC class I intensity was quantified in each condition (b) using Fiji software and normalized by the HOECHST intensity to correct for the number of cell per area (n = 3, ANOVA with Bonferroni correction for multiple comparisons, RFU (relative fluorescence units)). Immunocytochemistry (ICC) analysis (c) of MHC class I (ABC) (red), insulin (green) and HO (blue) was performed to confirm MHC class I expression in three independent human islet preparations. Scale bar 10 μm.

References

    1. Eizirik DL, Colli ML, Ortis F. The role of inflammation in insulitis and beta-cell loss in type 1 diabetes. Nat. Rev. Endocrinol. 2009;5:219–226. - PubMed
    1. Crow MK, Olferiev M, Kirou KA. Type I interferons in autoimmune disease. Annu Rev. Pathol. 2019;14:369–393. - PubMed
    1. Eizirik DL, Op de Beeck A. Coxsackievirus and type 1 diabetes mellitus: the Wolf’s footprints. Trends Endocrinol. Metab. 2018;29:137–139. - PubMed
    1. Ferreira RC, et al. A type I interferon transcriptional signature precedes autoimmunity in children genetically at risk for type 1 diabetes. Diabetes. 2014;63:2538–2550. - PMC - PubMed
    1. Foulis AK, Farquharson MA, Meager A. Immunoreactive alpha-interferon in insulin-secreting beta cells in type 1 diabetes mellitus. Lancet. 1987;2:1423–1427. - PubMed

Publication types

MeSH terms