. 2020 May 22;11(1):2577.
doi: 10.1038/s41467-020-16431-1.

Intestinal fungi are causally implicated in microbiome assembly and immune development in mice

Affiliations

Intestinal fungi are causally implicated in microbiome assembly and immune development in mice

Erik van Tilburg Bernardes et al. Nat Commun. .

Abstract

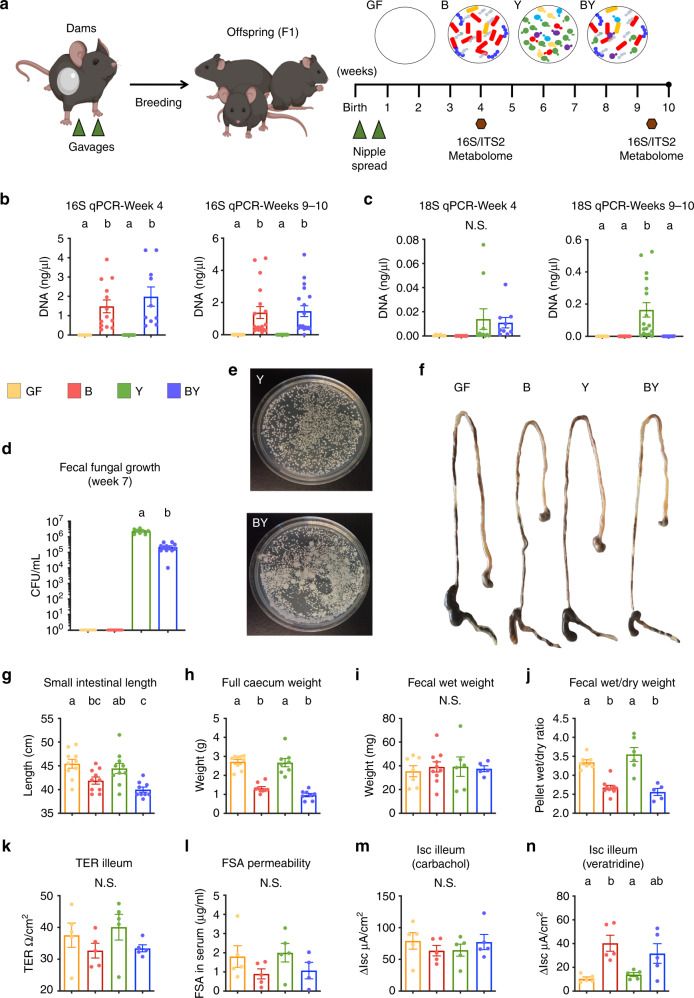
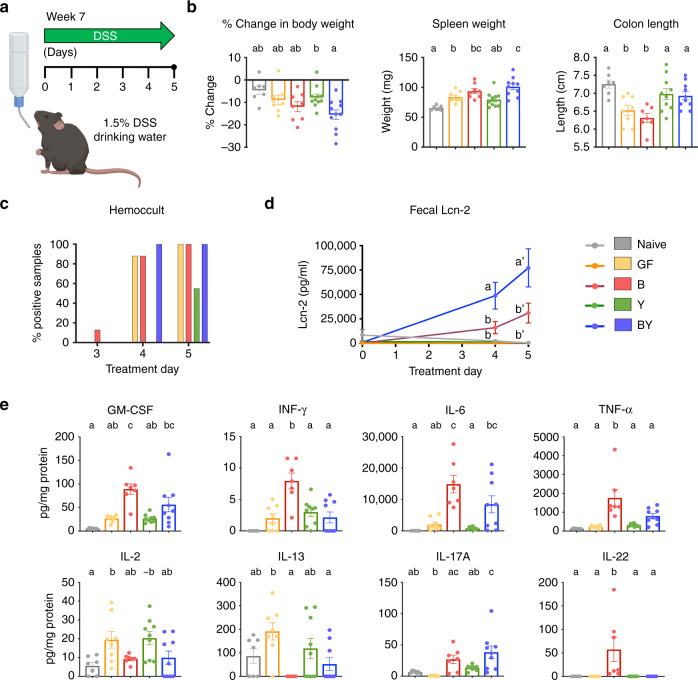
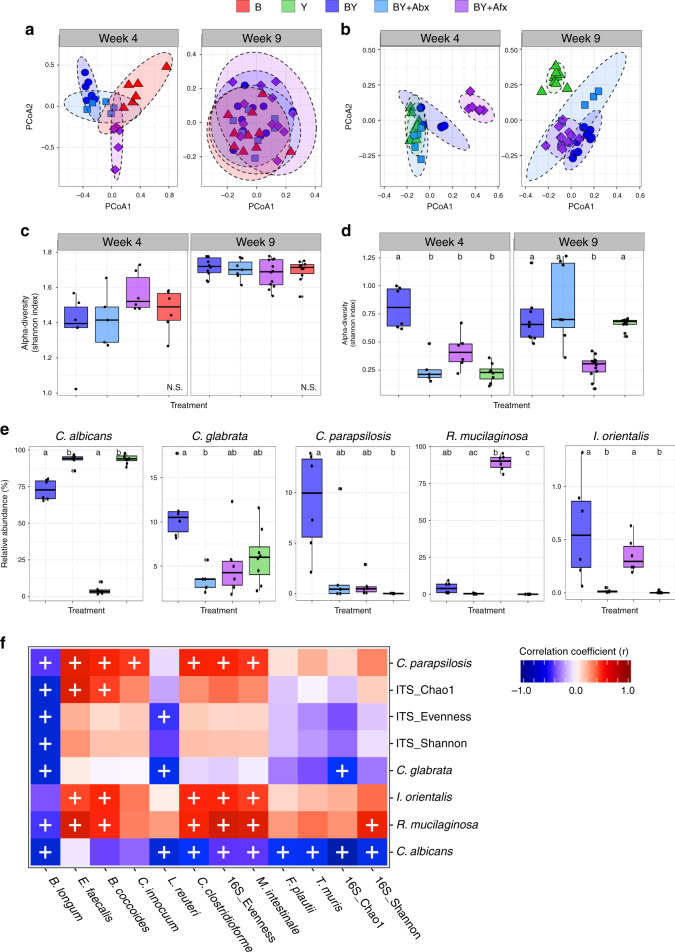
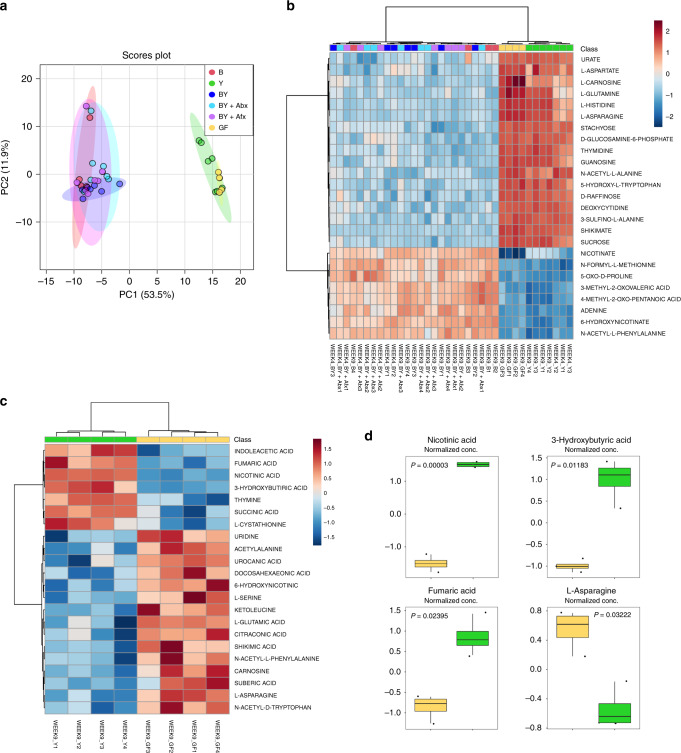
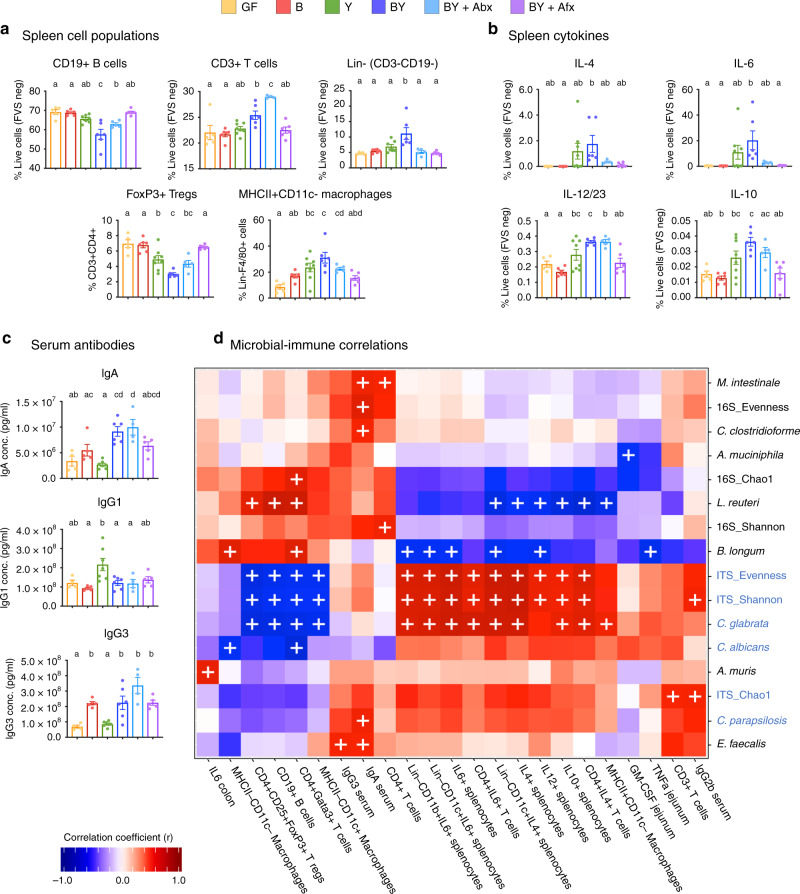
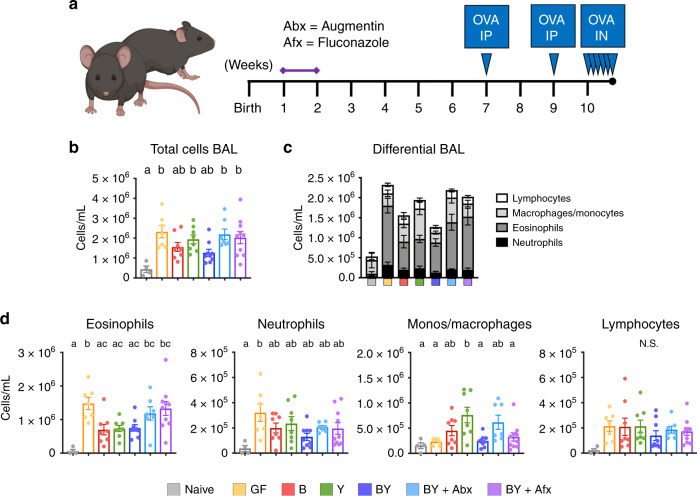
The gut microbiome consists of a multi-kingdom microbial community. Whilst the role of bacteria as causal contributors governing host physiological development is well established, the role of fungi remains to be determined. Here, we use germ-free mice colonized with defined species of bacteria, fungi, or both to differentiate the causal role of fungi on microbiome assembly, immune development, susceptibility to colitis, and airway inflammation. Fungal colonization promotes major shifts in bacterial microbiome ecology, and has an independent effect on innate and adaptive immune development in young mice. While exclusive fungal colonization is insufficient to elicit overt dextran sulfate sodium-induced colitis, bacterial and fungal co-colonization increase colonic inflammation. Ovalbumin-induced airway inflammation reveals that bacterial, but not fungal colonization is necessary to decrease airway inflammation, yet fungi selectively promotes macrophage infiltration in the airway. Together, our findings demonstrate a causal role for fungi in microbial ecology and host immune functionality, and therefore prompt the inclusion of fungi in therapeutic approaches aimed at modulating early life microbiomes.


Conflict of interest statement

The authors declare no competing interests.

Figures

Fig. 1
Fig. 1. Bacterial colonization is essential to induce intestinal anatomical and functional changes of colonized mice.
a Experimental layout for gnotobiotic study. Germ-free dams were orally gavaged twice with a consortium of 12 bacteria (B), 5 yeasts (Y), a combination of both (BY), or kept germ-free (GF). F1 mice were further colonized during the first week of life (see Methods and Supplementary Table 1). Fecal samples (hexagons) were obtained at 4 and 9–10 weeks of age for microbiota quantification (qPCR), taxonomic analysis (16S and ITS2 sequencing), and functional characterization (metabolome). qPCR quantification (standard curve method) of b bacterial and c fungal DNA in fecal samples by amplification of the 16S and 18S rRNA genes, respectively. d Fecal fungal colony counts in YM agar media supplemented with antibiotics (gentamycin + chloramphenicol). e Fecal fungal growth in selective medium from representative Y and BY mice. f Representation of gross anatomic changes of dissected gastrointestinal tracts across groups (stomach to distal colon). g Small intestine length and h full cecum weight of gnotobiotic dams at around 20 (17–25) weeks of age. i Water content in fecal samples measured by total fecal weight and j wet/dry ratio in dams. Gut barrier function measured by k ileal transepithelial resistance (TER) and l clearance of fluorescein-5(6)-sulfonic acid (FSA) over 4 h. Ileal short-circuit current (ΔIsc) upon stimulation with m epithelial stimulator carbachol or n neurostimulator veratridine. Data expressed as mean ± S.E.M. bd, gj Color denotes colonization treatment (GF = yellow, B = red, Y = green, BY = royal blue); b, c Data combined from two different experiments, Week 4: NGF = 5, NB = 13, NY = 13, NBY = 11; Week 9: NGF = 13, NB = 18, NY = 19, NBY = 19; d NGF = 5, NB = 6, NY = 8, NBY = 12; g NGF = 10, NB = 10, NY = 10, NBY = 9; h NGF = 10, NB = 9, NY = 8, NBY = 8; i, j NGF = 7, NB = 10, NY = 6, NBY = 5; k, m, n NGF = 5, NB = 5, NY = 5, NBY = 5; l NGF = 5, NB = 5, NY = 5, NBY = 4; different letters above bars indicate statistically significant differences defined by one-way ANOVA and Tukey post hoc tests (ac, gj) or two-sided t-test (d); P < 0.05; N.S. no significant differences. Source data are provided as a Source data file.
Fig. 2
Fig. 2. Fungal immune modulation of DSS-induced colitis.
a Experimental layout for DSS study. Seven-week-old gnotobiotic F1 mice were treated with 1.5% DSS for 5 days and colonic inflammation was assessed at end of treatment. A group of colonized animals were not treated with DSS and denoted naive (see Methods). b Percentage weight change between days 1 and 5, spleen weight, and colon length after 5 days of DSS treatment. Measurements of c stool occult blood and d stool Lcn-2 throughout DSS treatment. e Pro-inflammatory cytokines detected in inflamed colon lysates by electrochemiluminescence (MSD). be Data expressed as mean ± S.E.M.; color denotes colonization and DSS treatment (Naive = gray, GF = yellow, B = red, Y = green, BY = royal blue); NNAIVE = 7, NGF = 8, NB = 8, NY = 11, NBY = 11; different letters above bars indicate statistically significant differences defined by one-way ANOVA and Tukey post hoc tests; P < 0.05. Source data are provided as a Source data file.
Fig. 3
Fig. 3. Fungal colonization and antimicrobial treatments influence gut microbiome ecology.
Ecological community analyses of 16S and ITS2 sequences. PCA ordination of variation of a bacterial or b fungal beta-diversity of mice gut microbial communities based on Bray–Curtis dissimilarities among samples across treatments and experimental time points. Plots of c bacterial or d fungal alpha-diversity (Shannon index) across groups. e Relative abundances of fungal species at 4 weeks. ae Color denotes colonization treatment (B = red, Y = green, BY = royal blue, BY + Abx = cyan blue, BY + Afx = purple); Week 4: NB = 6, NY = 8, NBY = 6, NAbx = 5, NAfx = 6; Week 9: NB = 10, NY = 11, NBY = 10, NAbx = 7, NAfx = 12; ce Boxplots indicate median (inside line) and 25th and 75th percentile as the lower and upper hinges, respectively; different letters above bars indicate statistically significant differences defined by Kruskal–Wallis with post hoc Dunn tests and FDR corrected; P < 0.05; N.S. no significant differences. f Heat map of biweight correlations between bacterial (y-axis) and fungal species (x-axis) in feces collected at 4 weeks of age. Color denotes positive (red) and negative (blue) correlation values. Significant correlations are denoted with a cross and defined by the BiCOR method with FDR correction; P < 0.05. Source data are provided as a Source data file.
Fig. 4
Fig. 4. Bacteria colonization is the main driver of changes in the fecal metabolome.
a Principal component analysis score plot of 150 metabolites detected in fecal samples of gnotobiotic mice at 4 and 9 weeks of age. b Heat map of top 25 differentially expressed metabolites detected in 4- and 9-week fecal samples. c Heat map of 22 metabolites differentially expressed between GF and Y groups at 9 weeks. d Strongest metabolic differences detected between GF and Y groups at 9 weeks. ad Color denotes colonization treatment (GF = yellow, B = red, Y = green, BY = royal blue, BY + Abx = cyan blue, BY + Afx = purple); Nweek4 = 3 per group; Nweek9 = 4 per group. a, b Statistically significant differences between groups determined by one-way ANOVA with Fisher’s post hoc FDR correction; P < 0.05 (refer to Supplementary Table 4). c, d Statistically significant differences defined by two-tailed t-test with FDR correction; P < 0.05 (refer to Supplementary Table 5). d Boxplots indicate median (inside line) and 25th and 75th percentile as the lower and upper hinges, respectively. Source data are provided as a Source data file.
Fig. 5
Fig. 5. Fungal colonization alters early-life systemic immunity in mice.
Percentage of a unstimulated splenic cell populations, and b cytokine-producing unstimulated splenocytes from 4-week-old gnotobiotic mice. Cells were stained with intra- and extracellular marker-specific antibodies and quantified by flow cytometry. c Serum antibody concentrations detected by electrochemiluminescence (MSD). ac Data expressed as mean ± S.E.M. Color denotes colonization treatment (GF = yellow, B = red, Y = green, BY = royal blue, BY + Abx = cyan blue, BY + Afx = purple); NGF = 5, NB = 6, NY = 8, NBY = 6, NAbx = 5, NAfx = 6; different letters above bars indicate statistically significant differences defined by one-way ANOVA and Tukey post hoc tests; P < 0.05. d Heat map of biweight correlations between merged 16S (black) and ITS (blue) ASVs of the same species (x-axis) and reported immune features (y-axis) at week 4. Color denotes positive (red) and negative (blue) correlation values. Significant correlations are denoted with a cross and defined by the BiCOR method with FDR correction; P < 0.05. Source data are provided as a Source data file.
Fig. 6
Fig. 6. Fungal colonization modulates OVA-induced airway inflammation phenotype.
a Experimental layout for OVA-induced airway inflammation. Two groups of BY animals were additionally treated with antimicrobials Augmentin (Abx) or Fluconazole (Afx) during the second week of life. F1 mice were systemically sensitized with two intraperitoneal (IP) injections of OVA+Alum at weeks 7 and 9. Afterward, F1 mice were challenged intranasally (IN) with OVA, for 5 consecutive days at week 10. A group of mice were kept unchallenged and denoted naive (see Methods). b Total cellular count in BAL fluid following OVA challenge. c Compiled differential counts of cellular infiltrate in gnotobiotic groups. d Differential leukocyte counts in challenged mice. bd Data expressed as mean ± S.E.M.; color denotes colonization and OVA challenge (Naive = gray, GF = yellow, B = red, Y = green, BY = royal blue, BY + Abx = cyan blue, BY + Afx = purple); NNAIVE = 5, NGF = 7, NB = 8, NY = 8, NBY = 9, NAbx = 7, NAfx = 10; b, d different letters above bars indicate statistically significant differences defined by one-way ANOVA and Tukey post hoc tests; P < 0.05. Source data are provided as a Source data file.

References

    1. Parfrey LW, Walters WA, Knight R. Microbial eukaryotes in the human microbiome: ecology, evolution, and future directions. Front. Microbiol. 2011;2:153. - PMC - PubMed
    1. Rajilic-Stojanovic M, Smidt H, de Vos WM. Diversity of the human gastrointestinal tract microbiota revisited. Environ. Microbiol. 2007;9:2125–2136. - PubMed
    1. Yinda, C. K. et al. Gut virome analysis of Cameroonians reveals high diversity of enteric viruses, including potential interspecies transmitted viruses. mSphere4, e00585-18 (2019). - PMC - PubMed
    1. Arrieta MC, Stiemsma LT, Amenyogbe N, Brown EM, Finlay B. The intestinal microbiome in early life: health and disease. Front. Immunol. 2014;5:427. - PMC - PubMed
    1. Carding S, Verbeke K, Vipond DT, Corfe BM, Owen LJ. Dysbiosis of the gut microbiota in disease. Micro. Ecol. Health Dis. 2015;26:26191. - PMC - PubMed

Publication types

MeSH terms

Grants and funding