. 2020 May 22;10(1):8534.
doi: 10.1038/s41598-020-65416-z.

Pore-scale mechanisms of CO2 storage in oilfields

Affiliations

Pore-scale mechanisms of CO2 storage in oilfields

Abdulla Alhosani et al. Sci Rep. .

Abstract

Rapid implementation of global scale carbon capture and storage is required to limit temperature rises to 1.5 °C this century. Depleted oilfields provide an immediate option for storage, since injection infrastructure is in place and there is an economic benefit from enhanced oil recovery. To design secure storage, we need to understand how the fluids are configured in the microscopic pore spaces of the reservoir rock. We use high-resolution X-ray imaging to study the flow of oil, water and CO2 in an oil-wet rock at subsurface conditions of high temperature and pressure. We show that contrary to conventional understanding, CO2 does not reside in the largest pores, which would facilitate its escape, but instead occupies smaller pores or is present in layers in the corners of the pore space. The CO2 flow is restricted by a factor of ten, compared to if it occupied the larger pores. This shows that CO2 injection in oilfields provides secure storage with limited recycling of gas; the injection of large amounts of water to capillary trap the CO2 is unnecessary.


Conflict of interest statement

The authors declare no competing interests.

Figures

Figure 1
Figure 1
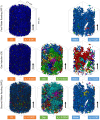
Diagram showing carbon capture and storage coupled with enhanced oil recovery. (A) A schematic of CO2 storage in depleted oil reservoirs. The behaviour of CO2 underground is controlled by pore-scale processes. (BD) show real images of reservoir fluids trapped in a single pore of carbonate rocks at elevated temperatures and pressures. CO2 is shown in green, water in blue, oil in red, while the rock is rendered transparent. (B) In a saline aquifer, CO2 is the non-wetting phase and occupies the larger pores. To restrict its flow, it must be capillary trapped through displacement with water. (C) In an oilfield under immiscible conditions, gas (CO2) is also the most non-wetting phase: to restrict its flow it must be capillary trapped by either oil (top) or water (bottom). (D) However, we normally encounter near-miscible conditions, where CO2 exists in layers surrounding the water phase, which is now most non-wetting. CO2 flow is restricted in these layers. Here, only CO2 and water are shown for clarity. The 3D pore-scale images were acquired by X-ray micro-tomography with a voxel size of approximately 2 µm, and visualized using Avizo 9.5 software (https://www.fei.com/software/amira-avizo/).
Figure 2
Figure 2
Bar charts showing the fraction of the pores occupied by each phase as a function of pore diameter after each injection step. Pore occupancy is defined as the phase in the centre of the pore – this phase will also have the largest volume in the pore. (A) Initial reservoir conditions (there is an initial water saturation of ~1% which is not evident from the bar chart) [IC], (B) first water flooding [WF1], (C) gas injection [GI], and (D) second water flooding [WF2]. Oil is shown in red, water in blue and gas, CO2, in green.
Figure 3
Figure 3
Three-dimensional maps showing the connectivity of the phases during the displacement sequence. The colours indicate discrete clusters of each phase. The relative permeability, kr, is shown in the boxes. The oil, gas and water phase distributions were obtained by imaging at a high-resolution, 1.82 µm/voxel, the rock pore space during the experiment, while the relative permeability values were computed from flow field simulations. The connectivity maps were plotted using Avizo 9.5 software (https://www.fei.com/software/amira-avizo/).
Figure 4
Figure 4
A three-phase ternary diagram showing the end-point saturations during the flooding sequence. Saturation is defined as the volume of a phase divided by the total pore volume. At first (black point on the diagram), the rock is restored to its initial reservoir conditions (water saturation: 0.01 and oil saturation: 0.99). The coloured arrows point to the chronological order of injection events: (i) first water flooding [WF1]; (ii) gas injection [GI], and (iii) second water flooding [WF2]. The error in the saturation measurement is within ± 2%.
Figure 5
Figure 5
Three-dimensional maps of the local thickness of gas layers computed after (left) gas injection (GI) and (right) second water flooding (WF2). The thickness maps were quantified on images of voxel size of 1.82 µm with 746 × 491 × 600 voxels. The gas layers have an average thickness of approximately 15–20 µm. The layers were visualized using Avizo 9.5 software (https://www.fei.com/software/amira-avizo/).

References

    1. Allen, M. et al. Global warming of 1.5 °C. An IPCC Special Report on the impacts of global warming of 1.5 °C above pre-industrial levels and related global greenhouse gas emission pathways, in the context of strengthening the global response to the threat of climate change, sustainable development, and efforts to eradicate poverty. IPCC Special Report, https://www.ipcc.ch/sr15/ (2019).
    1. BP Statistical Review of World Energy. BP Statistical Review of World Energy, https://www.bp.com/en/global/corporate/energy-economics/statistical-revi... (2019).
    1. Metz, B., Davidson, O., De Coninck, H., Loos, M. & Meyer, L. Carbon dioxide capture and storage: special report of the intergovermental panel on climate change. (Cambridge University Press, 2005).
    1. Bickle MJ. Geological carbon storage. Nature Geoscience. 2009;2:815–818. doi: 10.1038/ngeo687. - DOI
    1. Scott, V., Haszeldine, R. S., Tett, S. F. B. & Oschlies, A. Fossil fuels in a trillion tonne world. Nature Climate Change5, 419, 10.1038/nclimate2578, https://www.nature.com/articles/nclimate2578#supplementary-information (2015).