. 2020 May 22;10(1):8554.
doi: 10.1038/s41598-020-65482-3.

Macular impairment in mitochondrial diseases: a potential biomarker of disease severity

Affiliations

Macular impairment in mitochondrial diseases: a potential biomarker of disease severity

Guido Primiano et al. Sci Rep. .

Abstract

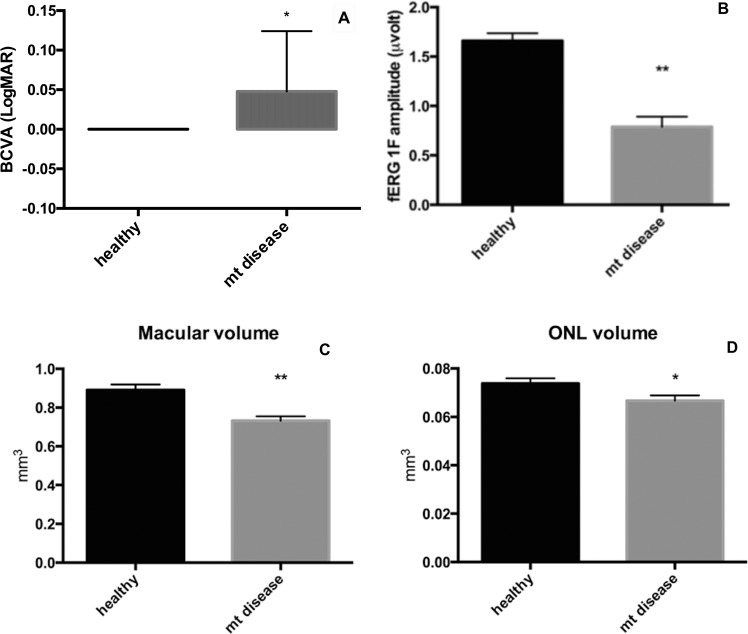
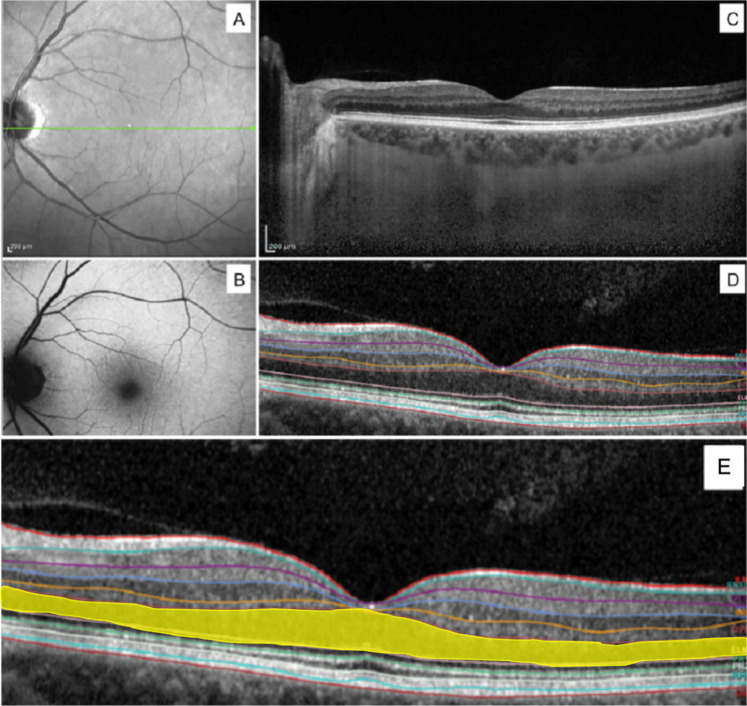
The high-energy demands of the retina are thought to contribute to its particular vulnerability to mitochondrial dysfunction. Photoreceptors are the cells with the higher oxygen consumption within the retina, and among these, the cones contain more mitochondria and have a higher energy demand than rods. A cohort of twenty-two patients with genetically-defined mitochondrial diseases (MDs) were enrolled to determine if the macula is functionally and anatomically impaired in these metabolic disorders. Visual acuity and fERG amplitude of patients with primary mitochondrial dysfunction were reduced compared to controls. Furthermore, SD-OCT layer segmentation showed a reduction of retinal and outer nuclear layer (ONL) volume in the macula of the patients. fERG amplitude showed a positive correlation with both ONL volume and thickness. A negative relationship was noted between fERG amplitude and disease severity assessed with Newcastle Mitochondrial Disease Adult Scale. In conclusion, MDs are associated with functional and anatomical alteration of macular cone system, characterized by its strong correlation with clinical disease severity suggesting a role as a potential biomarker of primary mitochondrial disorders.


Conflict of interest statement

The authors declare no competing interests.

Figures

Figure 1
Figure 1
Box plot comparing mean ± SE BCVA (A) and fERG 1F amplitude (B) in patients with mitochondrial disease and control group *p < 0.01, **p < 0.0001; Box plot comparing mean ± SE macular (C) and ONL (D) volume in patients with mitochondrial diseases (mt disease) and control group *p < 0.05, **p < 0.001.
Figure 2
Figure 2
Scatterplot showing the positive correlation between fERG 1F amplitude and ONL volume (A) and thickness (B); scatterplot showing the inverse correlation between fERG 1F amplitude and Newcastle scale score in patients with mitochondrial disease (mt disease) (C).
Figure 3
Figure 3
Representative example of the left eye of a patient with MELAS. Infrared (A), Autofluorescence (B), SD-OCT B-scan centered at the fovea with EDI mode (C); automated segmentation details of Spectralis (D). ONL highlighted in yellow for better visualization; IR and AF did not show changes; full macular volume and ONL volume decreased in SD-OCT analysis for eye’s MELAS patient (E). Inner limiting membrane (ILM), retinal nervous fiber layer (RNFL), ganglion cell layer (GCL), inner plexiform layer (IPL), inner nuclear layer (INL), outer plexiform layer (OPL), external limiting membrane (ELM), photoreceptor inner layer (PR1), photoreceptor outer layer (PR2), retinal pigment epithelium (RPE), Bruchs membrane (BM).

References

    1. Barot M, Gokulgandhi MR, Mitra AK. Mitochondrial dysfunction in retinal diseases. Curr Eye Res. 2011;36:1069–1077. doi: 10.3109/02713683.2011.607536. - DOI - PMC - PubMed
    1. Jarrett SG, Lin H, Godley BF, Boulton ME. Mitochondrial DNA damage and its potential role in retinal degeneration. Prog Retin Eye Res. 2008;27:596–607. doi: 10.1016/j.preteyeres.2008.09.001. - DOI - PubMed
    1. Nag TC, Wadhwa S, Chaudhury S. The occurrence of cone inclusions in the ageing human retina and their possible effect upon vision: an electron microscope study. Brain Res Bull. 2006;71:224–232. doi: 10.1016/j.brainresbull.2006.09.007. - DOI - PubMed
    1. Kenney MC, et al. Mitochondrial DNA haplogroups confer differences in risk for age-related macular degeneration: a case control study. BMC Med Genet. 2013;14:4. doi: 10.1186/1471-2350-14-4. - DOI - PMC - PubMed
    1. Nordgaard CL, Karunadharma PP, Feng X, Olsen TW, Ferrington DA. Mitochondrial proteomics of the retinal pigment epithelium at progressive stages of age-related macular degeneration. Invest Ophthalmol Vis Sci. 2008;49:2848–2855. doi: 10.1167/iovs.07-1352. - DOI - PMC - PubMed

Publication types