. 2020 May 22;3(1):253.
doi: 10.1038/s42003-020-0982-5.

Phosphoproteomics identifies dual-site phosphorylation in an extended basophilic motif regulating FILIP1-mediated degradation of filamin-C

Affiliations

Phosphoproteomics identifies dual-site phosphorylation in an extended basophilic motif regulating FILIP1-mediated degradation of filamin-C

Lena Reimann et al. Commun Biol. .

Abstract

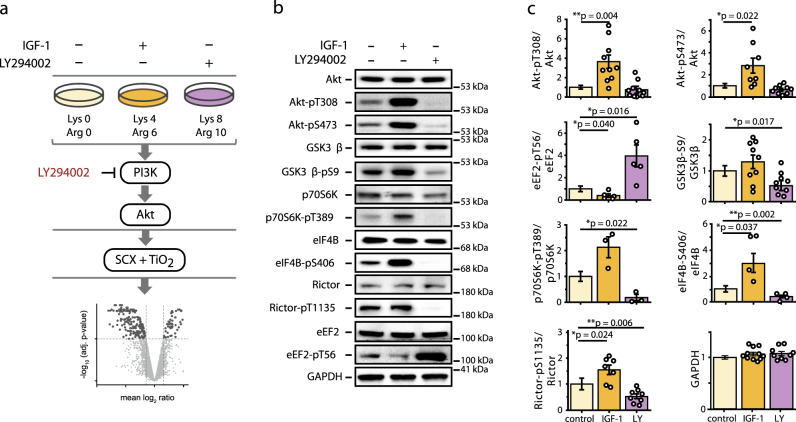
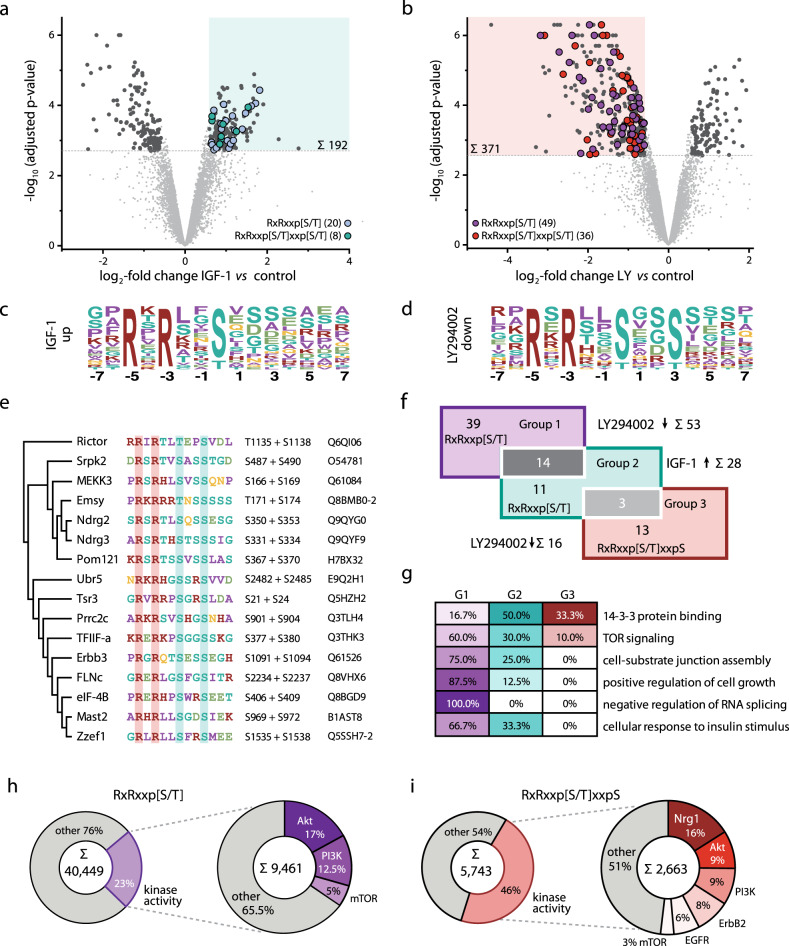
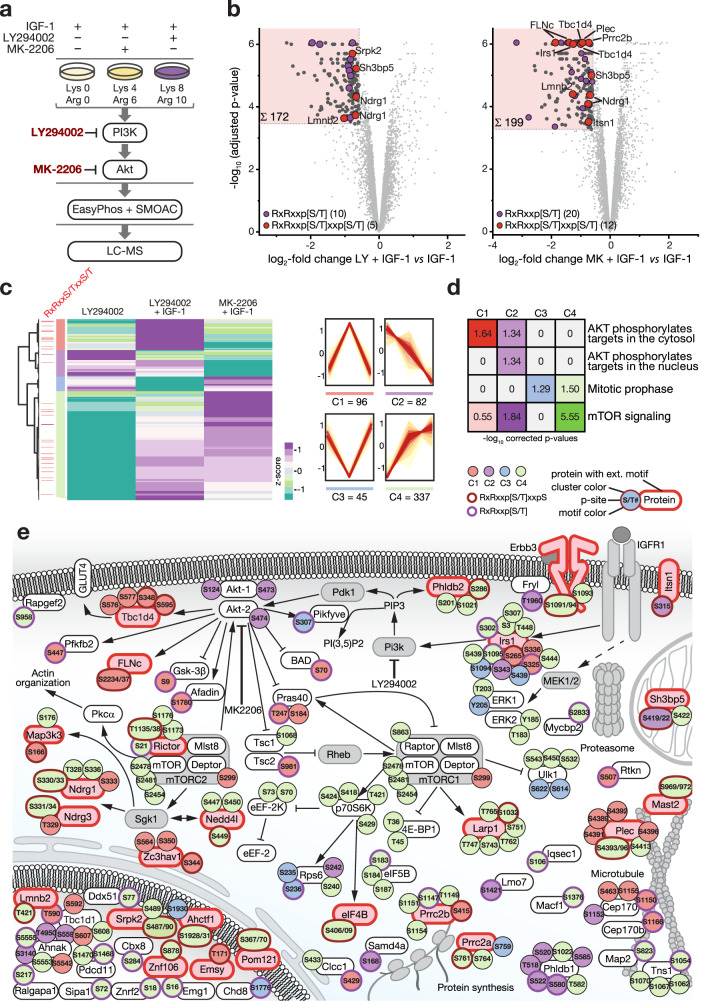
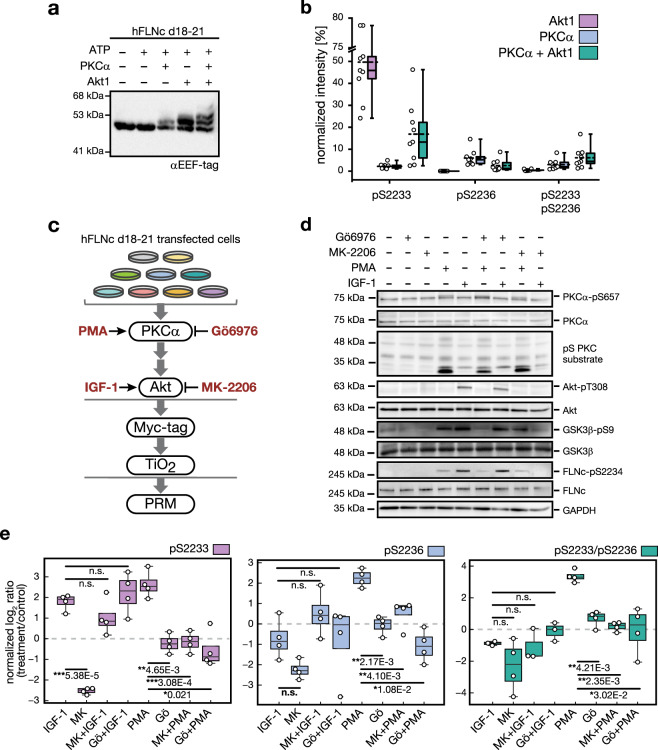
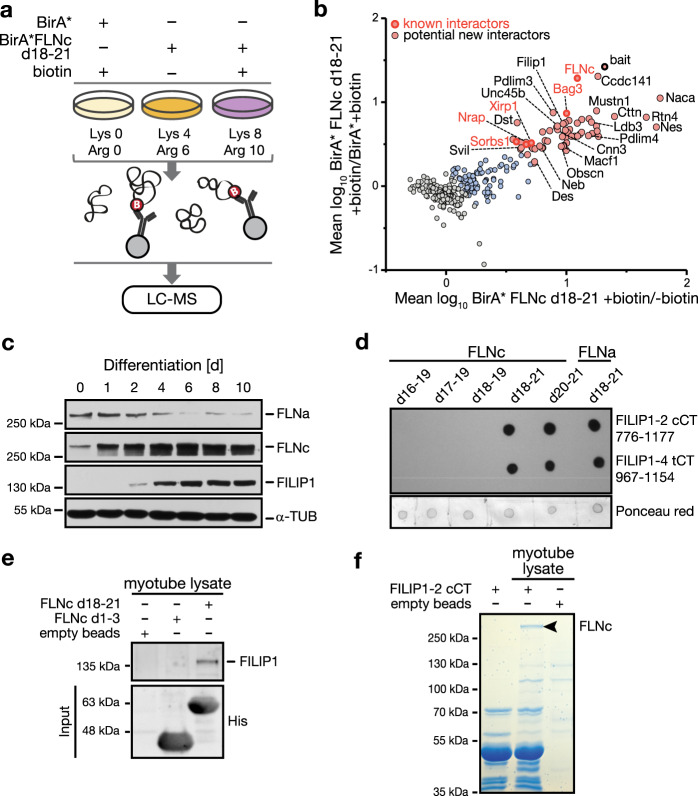
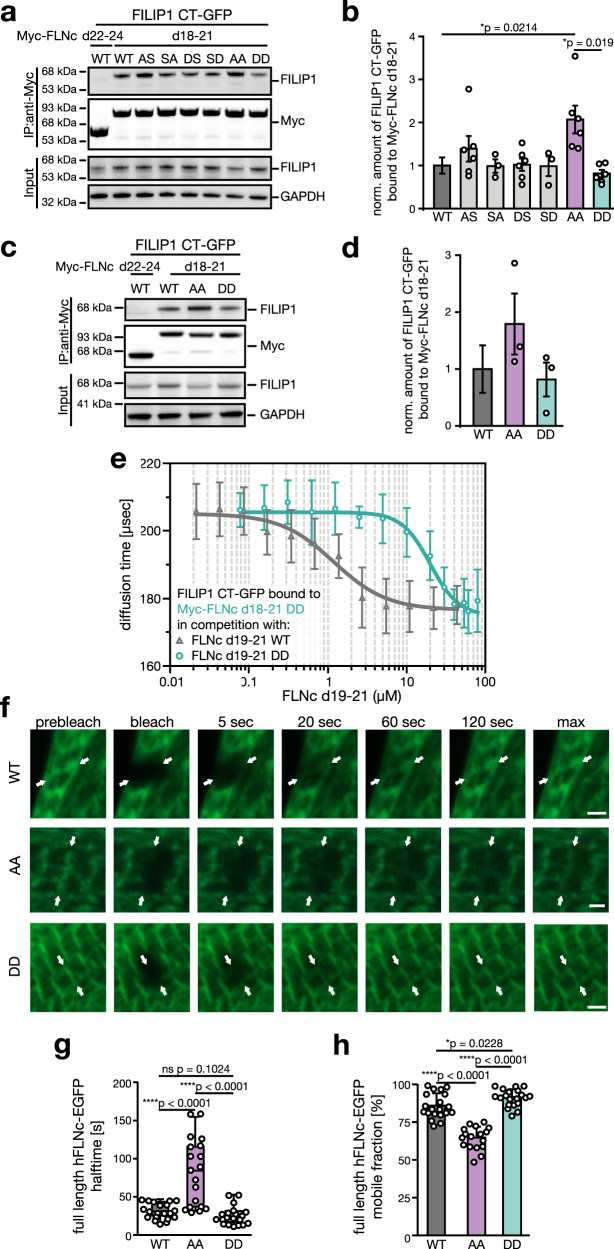
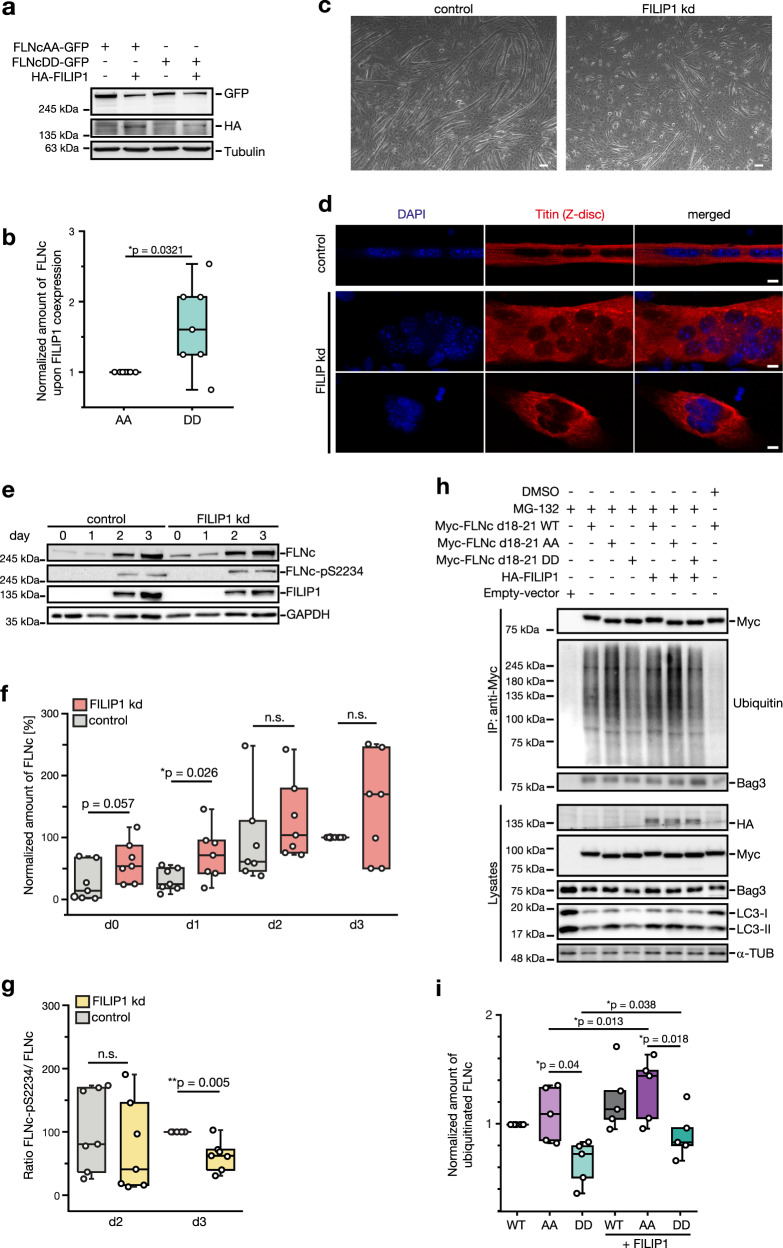
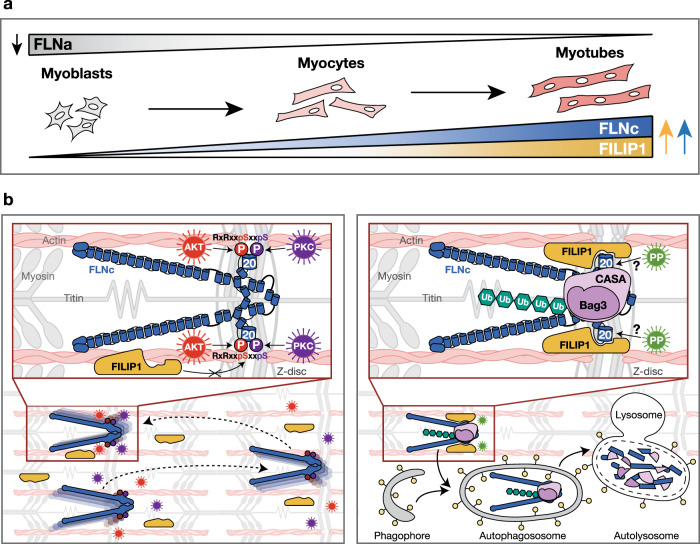
The PI3K/Akt pathway promotes skeletal muscle growth and myogenic differentiation. Although its importance in skeletal muscle biology is well documented, many of its substrates remain to be identified. We here studied PI3K/Akt signaling in contracting skeletal muscle cells by quantitative phosphoproteomics. We identified the extended basophilic phosphosite motif RxRxxp[S/T]xxp[S/T] in various proteins including filamin-C (FLNc). Importantly, this extended motif, located in a unique insert in Ig-like domain 20 of FLNc, is doubly phosphorylated. The protein kinases responsible for this dual-site phosphorylation are Akt and PKCα. Proximity proteomics and interaction analysis identified filamin A-interacting protein 1 (FILIP1) as direct FLNc binding partner. FILIP1 binding induces filamin degradation, thereby negatively regulating its function. Here, dual-site phosphorylation of FLNc not only reduces FILIP1 binding, providing a mechanism to shield FLNc from FILIP1-mediated degradation, but also enables fast dynamics of FLNc necessary for its function as signaling adaptor in cross-striated muscle cells.


Conflict of interest statement

The authors declare no competing interests.

Figures

Fig. 1
Fig. 1. Experimental setup to analyze PI3K/Akt signaling in contracting C2 myotubes.
a Contracting C2 myotubes, differentially labeled by stable isotopes using a triple stable isotope labeling with amino acids in cell culture (SILAC) approach and subjected to mild electrical pulse stimulation, were treated for 1 h with IGF-1 or LY294002 to stimulate or inhibit PI3K/Akt signaling as indicated. Cell lysates from triple SILAC experiments (n = 3 independent experiments) were individually subjected to SDS-PAGE and immunoblot analysis or mixed in equal amount for quantitative phosphoproteome analysis. Phosphopeptides were enriched using strong cation exchange chromatography and titanium dioxide chromatography (SCX-TiO2) and measured by LC-MS followed by computational data analysis. b Immunoblot analysis of PI3K/Akt/mTOR pathway activity using total and phospho-specific antibodies against established substrates of the canonical PI3K/Akt/mTOR pathway. c Quantification of immunoblot data from (b). Calculated signal intensities were normalized to the control and a two-tailed paired student’s t-test was performed. Error bars represent the SEM, n = 3-11 independent experiments.
Fig. 2
Fig. 2. Identification of an extended basophilic motif by quantitative phosphoproteomics.
a, b Volcano plots of quantified phosphopeptides with localized phosphosites from fully differentiated contracting skeletal myotubes following treatment with IGF-1 (left) or LY294002 (right). Log2-transformed mean SILAC ratios (control/treatment) were plotted against −log10 adjusted p values. Phosphopeptides with a minimum fold change of 1.5 and an adjusted p value lower than 0.05 (n = 3 independent experiments; two-tailed moderated student’s t-test) are shown as dark gray circles. Among these, phosphopeptides are labeled according to their phosphorylation sequence motif as indicated and regions of interest are highlighted in each plot. c, d Motif-X analysis of regulated phosphopeptides. The basophilic motif RxRxxS (c) was 30-fold enriched upon IGF-1 treatment, whereas the extended sequence motif RxRxxSxxS (d) was found to be 123-fold enriched following LY294002 treatment. x, any amino acid. e Clustal Omega analysis of the 16 amino acid sequence window from the proteins comprising regulated peptides with the extended basophilic RxRxxp[S/T]xxpS. f Overlap of unique phosphopeptides comprising the classical basophilic motif RxRxxp[S/T] (Group 1, LY294002 downregulated), RxRxxp[S/T] (Group 2, IGF-1 upregulated), or the extended basophilic motif RxRxxp[S/T]xxpS (Group 3, LY294002 downregulated). g Combined GO enrichment analysis of phosphopeptides of group 1, 2 and 3 (G1–3) shown in (e). Shown are overrepresented pathways with a Benjamini-Hochberg corrected p value ≤ 0.05. h, i Text mining results for interaction partners of proteins comprising the RxRxxp[S/T] (h) or the extended RxRxxp[S/T]xxpS motif (i). Analysis resulted in 40,449 (h) and 5,743 matches (i) of which 9,461 (23%) and 2,663 (46%) were annotated with the term “kinase activity”.
Fig. 3
Fig. 3. FLNc is a component of the PI3K/Akt/mTOR signaling network and differentially phosphorylated within the extended motif RxRxxpSxxpS.
a Contracting C2 myotubes differentially labeled using SILAC amino acids were treated for 30 min with IGF-1 or IGF-1 together with MK-2206 (MK) or LY294002 (LY) to stimulate or inhibit PI3K/Akt signaling as indicated. Cell lysates were mixed in equal amount for phosphopeptide enrichment employing the EasyPhos method in combination with sequential enrichment using metal oxide affinity chromatography (SMOAC) and LC-MS analysis. b Volcano plots of phosphopeptides with localized phosphosites quantified in skeletal myotubes treated with IGF-1 + LY (left) or IGF-1 + MK (right) in comparison to IGF-1. Log2-transformed mean SILAC ratios were plotted against -log10 adjusted p values. Phosphopeptides with a minimum fold change of 1.5 and a FDR lower than 0.01 (n = 6 independent experiments; two-tailed moderated student’s t-test) are shown as dark gray circles or color-coded according to their phosphorylation sequence motif as indicated. Regions of interest are highlighted in each plot. c. Hierarchical cluster analysis of cluster 2 shown in Supplementary Fig. 4f and the respective phosphopeptide profiles in each subcluster. Phosphopeptides with dual-site phosphorylation in the extended basophilic motif are indicated (light red lines, left side). d Reactome analysis of phosphopeptides of the cluster 1–4 depicted in (c). Shown are overrepresented pathways with a corrected p value ≤ 0.05. e Excerpt from the canonical IGF-1 activated signaling pathway, comprising the downstream signaling branch of the PI3K/Akt signaling cascade. Interactions were curated from the literature and the KEGG database. Phosphorylation sites are color-coded according to their cluster affiliation shown in (c) and the presence of the short or extended basophilic motif. Proteins comprising the extended basophilic motif are further highlighted in red; proteins not identified are shown in light gray. Proteins are represented by their gene name or UniProt shortname.
Fig. 4
Fig. 4. Phosphorylations within the extended motif located in the insert of hFLNc domain 20 are mediated by Akt and PKCα.
a In vitro kinase assay coupled to phosphorylation-dependent mobility shift analysis. Reactions were performed using recombinant hFLNc d18–21 in the presence (+) or absence (−) of ATP and the two basophilic kinases Akt and PKCα. Immunoblot analysis was performed with an antibody directed against the EEF-tag that was fused to the carboxy-terminus of hFLNc d18–21. A specific phosphorylation-dependent mobility shift was detected following incubation with PKCα. Akt-mediated phosphorylation led to band shift of approximately 50% of the protein. Incubation with both kinases resulted in two shifted bands, indicating dual-site phosphorylation of the protein. d, domain. b In vitro kinase assay coupled to quantitative MS analysis for site determination. Reactions were performed as described in (a). MS data for each kinase were quantified using Skyline. Intensities of phosphopeptides distinctive for a specific phosphorylation site in hFLNc d18–21 were added up per experiment and represented as normalized mean ± SEM (n = 3 independent experiments, each with 3 technical replicates). c Cell-based kinase assay. PKC activator PMA, PKCα inhibitor Gö6976 and Akt activator IGF-1 and Akt inhibitor MK-2206 were used to activate or block signaling pathways in C2 cells. For targeted MS analysis, phosphopeptides were enriched by Myc-tag and TiO2-based enrichment. d Immunoblot analysis for monitoring the activity levels of PKCα and Akt in C2 cells following pharmacologic interventions as indicated in (c). Specific antibodies were used to detect total protein amounts and phosphoisoforms. GSK3β-pS9 is a direct substrate of Akt and pS PKC substrate is an antibody directed against PKC substrates. GAPDH was used as loading control. e Targeted MS data showing changes in phosphorylation of hFLNc at S2233 and S2236. For parallel reaction monitoring, the phosphopeptides LGpSFGSITR, LGSFGpSITR, LGpSFGpSITR, ERLGpSFGSITR and ERLGpSFGpSITR were selected. MS data were quantified using Skyline and normalized to an internal phosphopeptide standard and a two-tailed paired student’s t-test was performed. Shown are the normalized mean log2 ratios (treatment/control) ± SEM, n = 4 independent experiments.
Fig. 5
Fig. 5. Identification of FILIP1 as binding partner of hFLNc d18–21 in skeletal myocytes.
a SILAC-based proximity proteomic approach. Differentially stable isotope labeled contracting C2 myotubes (n = 3 independent experiments) transiently expressing the promiscuous biotin ligase BirA* or BirA*hFLNc d18–21 were incubated with biotin as indicated. Cell lysates were mixed, biotinylated proteins were enriched via streptavidin and tryptic digests thereof were quantitatively analyzed by LC-MS. b Scatterplot of proteins grouped in clusters 1–3 shown in Supplementary Fig. 8a. Components of cluster 1 (pink) were enriched in relation to both controls (BirA* + biotin; BirA*hFLNc d18–21—biotin). Shown are the mean log10 SILAC ratios from 3 independent experiments. Proteins are represented by their gene name. c Immunoblot analysis of the levels of FLNa, FLNc and FILIP1 during differentiation of C2C12 cells to myotubes. α-Tubulin (α-TUB) was used as loading control. d Dot-blot overlays showing binding of different EEF-tagged fragments of FLNc and FLNa to the complete carboxy-terminus (cCT) of FILIP1-2 (amino acids 776–1177) and the truncated carboxy-terminus (tCT) FILIP1-4 (amino acids 967–1154) immobilized on nitrocellulose. Staining with anti-EEF-tag antibody shows binding of the filamin fragments. Staining with Ponceau red indicates loading of equal protein amounts. e Pull-down experiments confirming the binding of endogenous FILIP1 from skeletal myotube lysates to His6-FLNc d18–21 bound to Ni2+-NTA agarose beads by immunoblot analysis. No FILIP1 binding was observed for empty beads or His6-FLNc d1–3. f Pull-down experiments verifying the binding of endogenous FLNc from skeletal myotube lysates to the carboxy-terminus of FILIP1-2 bound to Ni2+-NTA agarose beads. Bound proteins were analyzed by SDS-PAGE and Coomassie staining. This revealed a specific protein band not present in control lanes at an approximate molecular mass of 290 kDa, which was identified as FLNc by LC-MS analysis shown in Supplementary Fig. 8h.
Fig. 6
Fig. 6. Dual-site phosphorylation at S2233/S2236 modulates binding of hFLNc to FILIP1 and increases hFLNc dynamics and mobility.
a Co-immunopurification experiments in HEK293 cells transiently expressing FILIP1 CT-GFP and hFLNc d18–21 or single and double phosphosite mutants as indicated. FLNc d22–24, negative control. b Quantification of immunoblot data shown in (a) normalized to FLNc d18–21. SEM was calculated and a two-tailed student’s t-test was performed (n = 3–6 independent experiments). c Co-immunopurification experiments in C2 cells transiently expressing FILIP1 CT-GFP and hFLNc d18–21 or double phosphosite mutants as indicated. d Quantification of immunoblot data shown in (c) normalized to hFLNc d18–21. SEM was calculated and a two-tailed student’s t-test was performed (n = 3 independent experiments). e Fluorescence correlation spectroscopy analysis of co-expressed wild-type FILIP1 CT-GFP and Myc-hFLNc d18–21 DD mutant in competition with recombinantly expressed wildtype hFLNc d19–21 (Kd = 1.17 + 0.28 μM) and hFLNc d19–21 DD mutant (Kd = 20.03 + 2.33 μM), respectively. n = 3 independent experiments. f Immortalized mouse myoblasts transiently expressing EGFP-tagged full-length wild-type hFLNc (WT) or S2233/22236 phosphosite mutants (AA, DD) were differentiated for 6 days. Shown are representative FRAP experiments photographed before bleaching (prebleach), immediately (bleach) or 5, 20, 60 and 120 s after bleaching, and after full recovery (max). Arrows indicate the bleached Z-disc. Scale bar: 2 µm. g Quantification of FRAP data shown in (a). Statistical data are depicted in box and whisker plots with median halftimes of 33 (WT), 82 (AA) and 27 s (DD). Each median halftime is shown as a line surrounded by a box, which represents the interquartile range comprising the median 25% of the data. Whiskers extend at most two standard deviations from the median. Unpaired t-test with Welch correction was performed for n = 19–20 independent experiments. h Percentage of mobile fractions calculated from FRAP experiments in (a). The AA variant shows a significantly decreased mobility (65%) compared to WT FLNc (86%). The DD variant (91%) is significantly more mobile than WT FLNc. Shown is the mean ± S.D. Unpaired t-test with Welch correction was performed for n = 19–20 independent experiments. hFLNc d22–24 negative control; WT wild-type.
Fig. 7
Fig. 7. Dual-site phosphorylated FLNc is protected from FILIP1-mediated degradation during myocyte differentiation.
a Immunoblot analysis of co-expression experiments in C2 skeletal muscle cells transiently expressing GFP fusion proteins of full-length FLNc AA and DD mutants in the presence or absence of HA-tagged FILIP1. b Quantification of immunoblot data shown in (a). GFP signal intensities were normalized to tubulin signals. Ratios of HA-FILIP1 co-expression to control were normalized to FLNc AA mutant. Data are presented as box and whisker plots; n = 7 independent experiments, paired two-tailed student’s t-test. c Bright-field microscopy images of C2 cells after transfection with FILIP1 siRNA (FILIP1 kd) or scrambled siRNA (control). Images of cells were taken after 4 days of differentiation. Scale bar: 100 µm; kd, knockdown. d Fluorescence microscopy images of C2C12 cells after transfection with FILIP1 siRNA (FILIP1 kd) or scrambled siRNA (control). Cells were differentiated for 5 days and fixed cells were stained using antibody against the Z-disc associated part of titin. DAPI was used for nuclei staining. Scale bar: 10 µm. e. Immunoblot analysis of FILIP1 kd and control cells. Cells were differentiated 24 h after siRNA transfection and lysed at different time points during differentiation (d0-d3). d, day. f, g Quantification of immunoblot data shown in (e), shown as box and whisker plots; n = 7 independent experiments, paired two-tailed student’s t-test. f FLNc signals in control and FILIP1 kd cells at d0-d3 normalized to the control at d3. g Intensity ratios FLNc-pS2233/FLNc at d2 and d3 normalized to the control at d3. h Immunoblot analysis of C2 cells transfected with Myc-tagged FLNc d18–21 WT or AA, DD mutants with or without co-expression of HA-FILIP1. Cells were treated 6 hours with 10 µM MG-132 inhibitor or DMSO before lysis. FLNc WT and phosphosite mutants were immunoprecipitated using anti-Myc beads and ubiquitinated species were detected using anti-ubiquitin antibody. i Quantification of immunoblot data shown in (h). Ubiquitin signal intensities of immunoprecipitated FLNc d18–21 mutants were normalized to Myc signal intensities after immunoprepcipitation. Data normalized to WT are presented as box and whisker plots; n = 5 independent experiments, paired two-tailed student’s t-test.
Fig. 8
Fig. 8. Model of the regulation of FILIP1-mediated FLNc degradation.
a Differentiation-dependent expression of FILIP1, FLNc and FLNa in skeletal muscle cells. b Akt- and PKCα-dependent dual-site phosphorylation occurs in the extended basophilic motif located in the unique insert in domain 20 of FLNc. Dual-site phosphorylation reduces binding to FILIP1 and ensures stability and high dynamics of FLNc in muscle cells. Activation of protein phosphatases (PP) may result in the dephosphorylation of FLNc and thus, FILIP binding promoting the removal of nonphosphorylated FLNc of low mobility and dynamics by the Bag3-machinery and chaperone-assisted selective autophagy (CASA). Ub, ubiquitin.

References

    1. Manning BD, Cantley LC. AKT/PKB signaling: navigating downstream. Cell. 2007;129:1261–1274. - PMC - PubMed
    1. Jiang B-H, Aoki M, Zheng JZ, Li J, Vogt PK. Myogenic signaling of phosphatidylinositol 3-kinase requires the serine-threonine kinase Akt/protein kinase B. Proc. Natl Acad. Sci. USA. 1999;96:2077–2081. - PMC - PubMed
    1. Rommel C, et al. Differentiation stage-specific inhibition of the Raf-MEK-ERK pathway by Akt. Science. 1999;286:1738–1741. - PubMed
    1. Yang G, Murashige DS, Humphrey SJ, James DE. A positive feedback loop between Akt and mTORC2 via SIN1 phosphorylation. Cell Rep. 2015;12:937–943. - PubMed
    1. Laplante M, Sabatini DM. mTOR signaling in growth control and disease. Cell. 2012;149:274–293. - PMC - PubMed

Publication types