. 2020 May;52(5):815-831.
doi: 10.1038/s12276-020-0436-7. Epub 2020 May 22.

The FBW7-MCL-1 axis is key in M1 and M2 macrophage-related colon cancer cell progression: validating the immunotherapeutic value of targeting PI3Kγ

Affiliations

The FBW7-MCL-1 axis is key in M1 and M2 macrophage-related colon cancer cell progression: validating the immunotherapeutic value of targeting PI3Kγ

Yeo Song Lee et al. Exp Mol Med. 2020 May.

Abstract

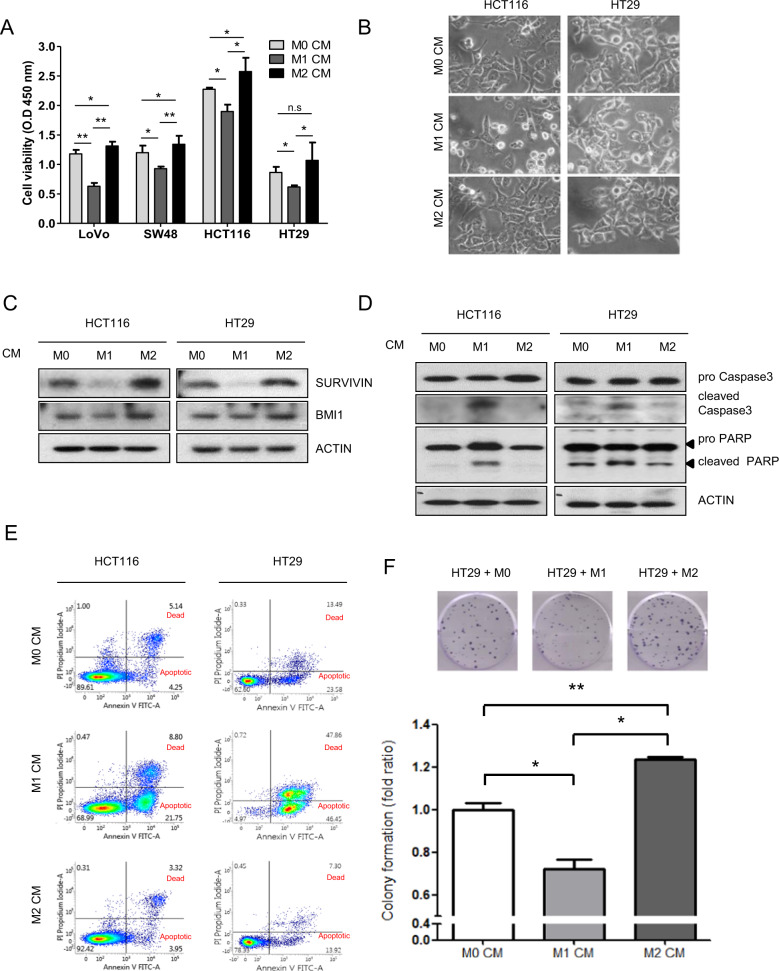
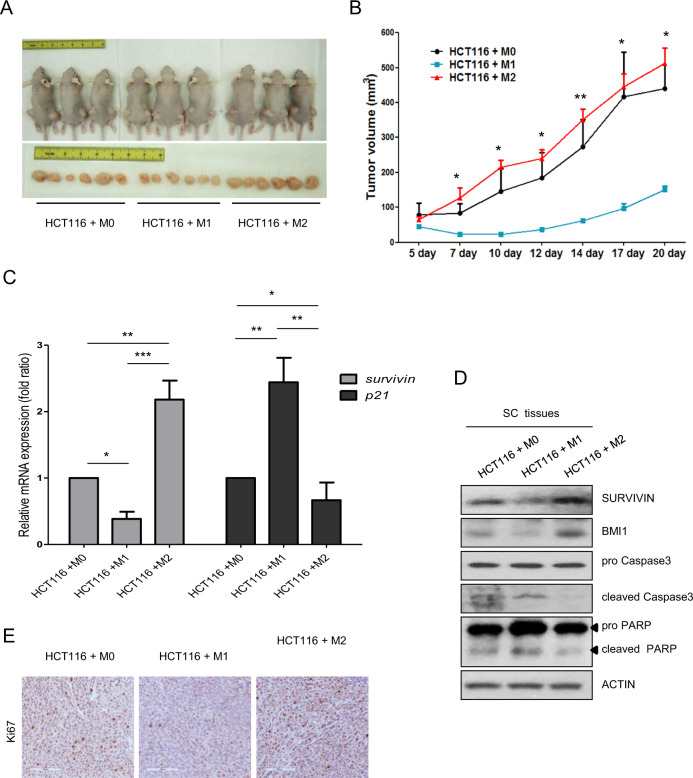
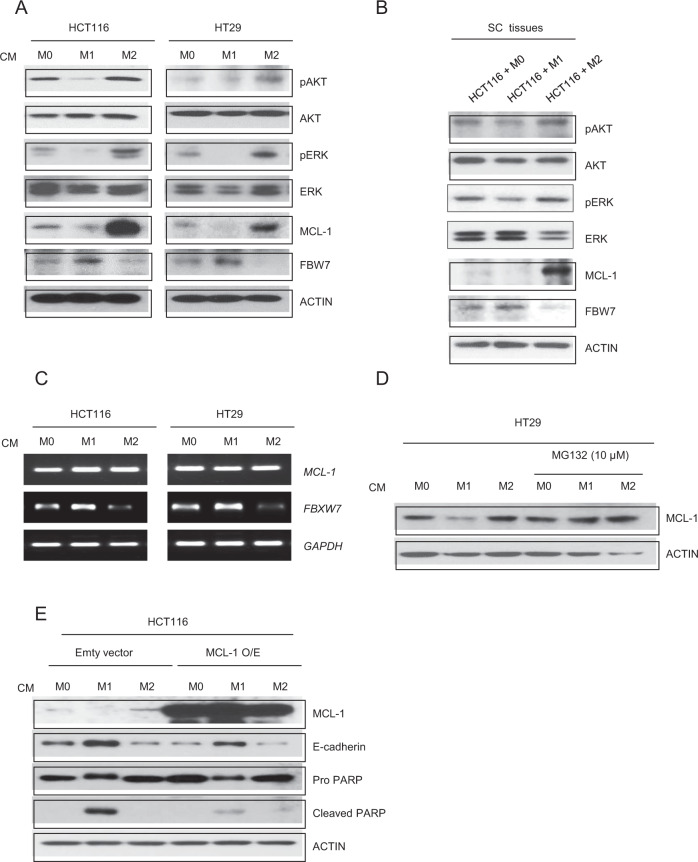
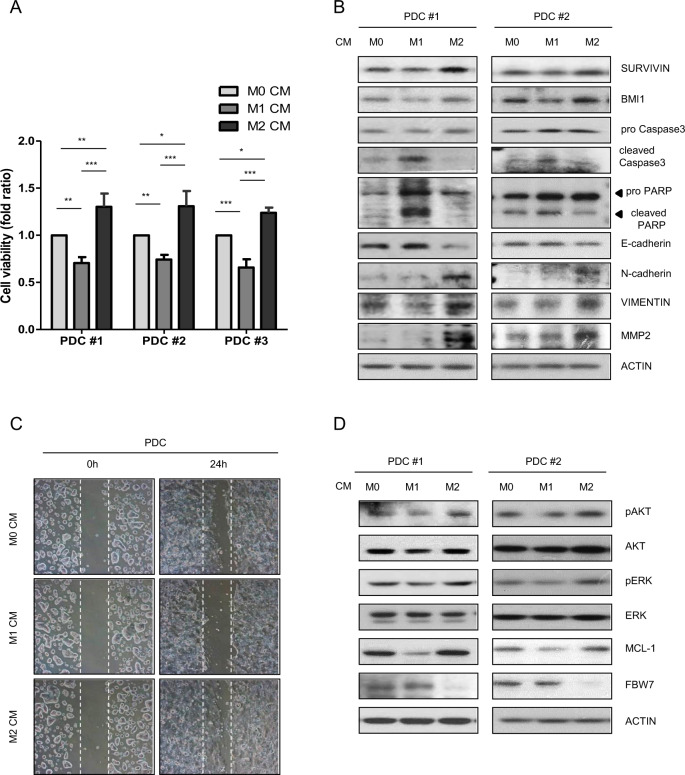
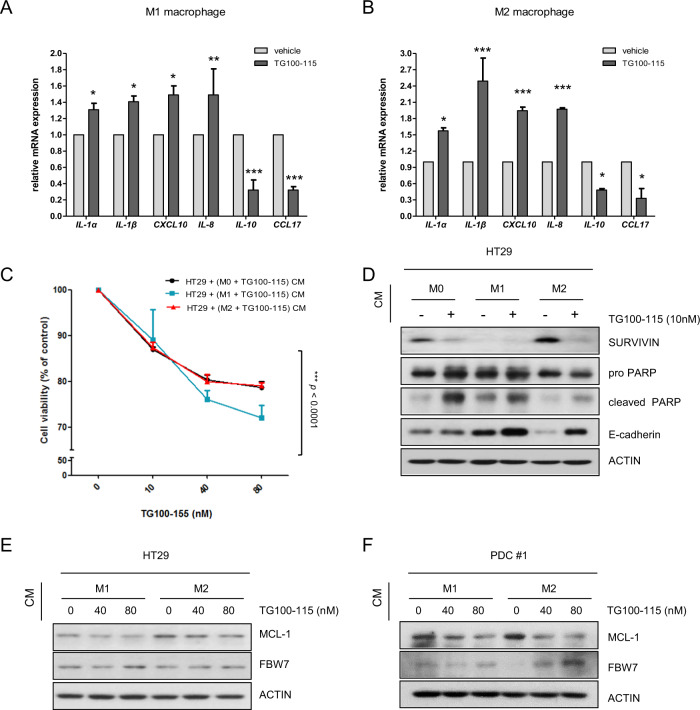
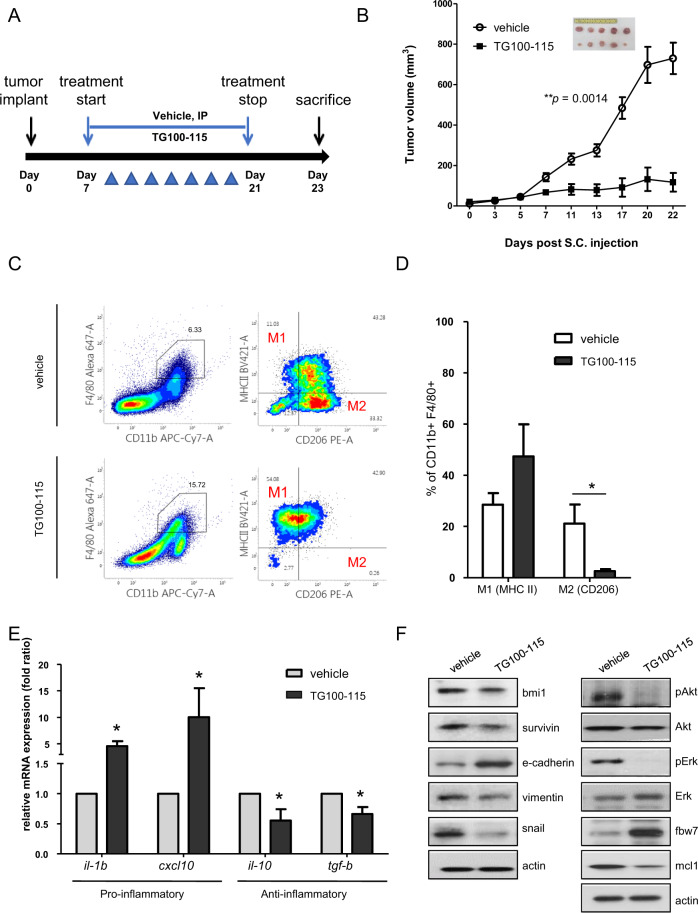
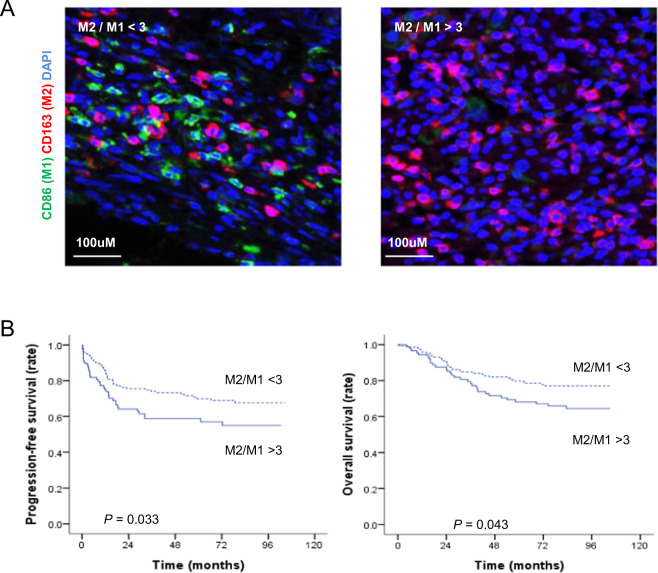
Colorectal cancer is a devastating disease with a low 5-year survival rate. Recently, many researchers have studied the mechanisms of tumor progression related to the tumor microenvironment. Here, we addressed the prognostic value of tumor-associated macrophages (TAMs) using a total of 232 CRC patient tissue samples and investigated the mechanisms underlying TAM-related colon cancer progression with respect to PI3Kγ regulation using in vitro, in vivo, and ex vivo approaches. Patients with M2/M1 < 3 had significantly improved progression-free survival and overall survival compared with patients with M2/M1 > 3. M1 and M2 macrophages elicited opposite effects on colon cancer progression via the FBW7-MCL-1 axis. Blocking macrophage PI3Kγ had cytotoxic effects on colon cancer cells and inhibited epithelial-mesenchymal transition features by regulating the FBW7-MCL-1 axis. The results of this study suggest that macrophage PI3Kγ may be a promising target for immunotherapy in colon cancer.


Conflict of interest statement

The authors declare that they have no conflict of interest.

Figures

Fig. 1
Fig. 1. Opposite effects of M1 and M2 macrophages on the viability of colon cancer cells.
a Viability of four colon cancer cell lines after coculture with macrophage CM for 24 h based on the WST-1 assay. Error bars are derived from three independent experiments. b Phase contrast microscopy observation (×400) of HCT116 and HT29 cells treated with macrophage CM for 24 h. c Expression levels of SURVIVIN and BMI-1 in macrophage CM-treated HCT116 and HT29 cells based on western blotting. d Extent of caspase-3 activation and cleavage of PARP in cell lysates, as measured by western blotting. e Apoptotic cells were determined by FACS using annexin V/PI double staining after 24 h of incubation with each macrophage CM with HCT116 and HT29 cells. f The colony formation effect of each macrophage CM on HT29 cells. Representative images of the colony-forming assay (upper panel) and analysis of colony formation rates (lower panel) are shown. The results are presented as the mean value ± SE. *P < 0.05; **P < 0.01; ***P < 0.001.
Fig. 2
Fig. 2. Opposite effects of M1 and M2 macrophages on tumor growth.
a Tumor images and b tumor growth 3 weeks after transplantation of HCT116 cells after long-term coculture with differentiated M0, M1, or M2 macrophages (see Materials and Methods). Tumor size was measured 2–3 times a week with a caliper. Tumor volume was calculated using the following formula: tumor volume = (short length × long length × width)/2. The expression of SURVIVIN or p21 c) and proliferation markers d in mouse subcutaneous tissues was evaluated by real-time PCR and western blotting, respectively. e Ki67 staining (1:200) of mouse subcutaneous tissues three weeks after subcutaneous injection. Scale bar: 100 μm. The results shown are presented as the mean ± SD from three mice per group. Actin was used as a loading control. *P < 0.05; **P < 0.01; ***P < 0.001.
Fig. 3
Fig. 3. Effects of macrophage CM on EMT in colon cancer cells.
a Transwell Matrigel invasion assays of HT29 and HCT116 cells after coculture with macrophage CM for 24 h. b HT29 cells were subjected to immunofluorescence staining with an antibody against E-cadherin, were mounted with DAPI-containing mounting solution and observed at ×200 and ×400 magnification. A wound-healing assay was performed by creating a wound on a confluent monolayer of HT29 c and HCT116 d cells during incubation with macrophage CM for 16 h. Expression levels of EMT markers in HCT116 and HT29 cells treated with macrophage CM for 24 h e and in mouse subcutaneous tissues f were evaluated by western blotting. Actin was used as a loading control.
Fig. 4
Fig. 4. Opposite effects of M1 macrophage CM and M2 macrophage CM on FBW7-mediated MCL-1 degradation of colon cancer cells.
Expression levels of AKT, ERK, MCL-1, and FBW7 in a macrophage CM-treated HCT116 and HT29 cells and in b mouse subcutaneous tissues transplanted with long-term coculture and differentiated M0, M1, and M2 macrophages. c mRNA levels of MCL-1 and FBW7 were evaluated by RT-PCR after macrophage CM treatment for 24 h. d HT29 cells were exposed to MG132 for 1 h and incubated with macrophage CM for 24 h. e HCT116 cells were transfected with either empty vector or MCL-1 expression vector for 24 h, followed by incubation with macrophage CM for another 24 h. Actin was used as a loading control.
Fig. 5
Fig. 5. Ex vivo analysis of the role of macrophage CM in colon cancer patient-derived cells (PDCs).
a Estimation of PDC viability after coculture with macrophage CM for 24 h using the WST-1 assay. Error bars are derived from three independent experiments. b Expression levels of apoptosis and EMT markers in macrophage CM-treated PDCs were measured by western blotting. c Wound-healing ability was evaluated by creating wounds on a confluent monolayer of PDCs using 1-Dish 35-mm-high culture inserts. d Activation of AKT and ERK and expression levels of MCL-1 and FBW7 assessed by western blotting. Actin was used as a loading control. The results are presented as the mean ± SE. **P < 0.01; ***P < 0.001.
Fig. 6
Fig. 6. Role of PI3Kγ in TAM-mediated colon cancer cell viability and EMT characteristics.
mRNA expression levels of genes involved in the proinflammatory response (IL-1α, IL-1β, CXCL10, and IL-8) and antiinflammatory response (IL-10 and CCL17) were evaluated by real-time PCR in M1 a and M2 b macrophages with or without treatment with 10 nm TG100-115 (PI3Kγ inhibitor) for 18 h. c HT29 cells were exposed to TG100-115-treated macrophage CM for 24 h. Cell viability was then measured by WST-1 assay. d Expression levels of apoptosis- and EMT-related markers in CM-treated HT29 cells. CMs were derived from TG100-115 (10 nm)-treated or untreated M0, M1, and M2 macrophages. HT29 cells e and PDCs f were incubated with TG100-115-treated macrophage CM for 24 h. Protein levels of MCL-1 and FBW7 were evaluated using western blotting. Actin was used as a loading control. The results are presented as the mean ± SE. *P < 0.05; **P < 0.01; ***P < 0.001.
Fig. 7
Fig. 7. Inhibition of PI3Kγ attenuates tumor growth in xenograft models associated with infiltrated macrophages.
a Experimental procedure illustrating the TG100-115 treatment regimen in BALB/c mice. b CT26 cells (5 × 105 cells/mouse) were subcutaneously injected into the flanks of 6-week-old mice. Mean tumor volume of subcutaneously implanted vehicle- or TG100-115-treated mice (n = 5) and representative images of subcutaneous tumors at day 16 after treatment with vehicle or TG100-115 (box) are shown. c FACS analysis and quantification of CD11b+ F4/80+ (TAM) cell populations in CT26 tumors at day 14 posttreatment (n = 5) and expression levels of MHCII (M1) and CD206 (M2) in CD11b+ F4/80+ cell populations. d Graph showing the percentage of each population (M1, M2) in the vehicle-treated group in comparison with the TG100-115-treated group. e mRNA expression levels of genes involved in the proinflammatory response (il-1β, cxcl10) and antiinflammatory response (il-10 and tgf-β) were evaluated by real-time PCR in vehicle and TG100-155-treated groups. f Representative western blot analysis showing survival/EMT-related protein expression as well as ERK/AKT-FBW7-MCL-1 signal axis regulation in vehicle- and TG100-155-treated mouse tumor tissues.
Fig. 8
Fig. 8. Survival analysis according to the M2 marker (CD163) to M1 marker (CD86) ratio in the validation cohort.
a Representative immunohistochemical staining for markers of M1 macrophages (CD86, green) and M2 macrophages (CD163, red) in CRC tissues. Dried slides were scanned using the PerkinElmer Vectra 3.0 platform at ×20 magnification. Nuclei were shown by DAPI staining (blue). Scale bar: 100 µm. b Kaplan–Meier curves for progression-free survival (left panel) and overall survival (right panel) of the two groups were divided by an optimal cutoff value of 3 for the ratio of M2 marker (CD163) to M1 marker (CD86). Statistical analysis by long-rank test: p = 0.033 and p = 0.043, respectively.

References

    1. Murdoch C, Muthana M, Coffelt SB, Lewis CE. The role of myeloid cells in the promotion of tumour angiogenesis. Nat. Rev. Cancer. 2008;8:618–631. - PubMed
    1. Peddareddigari VG, Wang D, Dubois RN. The tumor microenvironment in colorectal carcinogenesis. Cancer Microenviron. 2010;3:149–166. - PMC - PubMed
    1. Gajewski TF, Schreiber H, Fu YX. Innate and adaptive immune cells in the tumor microenvironment. Nat. Immunol. 2013;14:1014–1022. - PMC - PubMed
    1. Pollard JW. Tumour-educated macrophages promote tumour progression and metastasis. Nat. Rev. Cancer. 2004;4:71–78. - PubMed
    1. Ostuni R, Kratochvill F, Murray PJ, Natoli G. Macrophages and cancer: from mechanisms to therapeutic implications. Trends Immunol. 2015;36:229–239. - PubMed

Publication types

MeSH terms

Substances