. 2020 May 22;3(1):257.
doi: 10.1038/s42003-020-0986-1.

Mitochondrial stress-activated cGAS-STING pathway inhibits thermogenic program and contributes to overnutrition-induced obesity in mice

Affiliations

Mitochondrial stress-activated cGAS-STING pathway inhibits thermogenic program and contributes to overnutrition-induced obesity in mice

Juli Bai et al. Commun Biol. .

Abstract

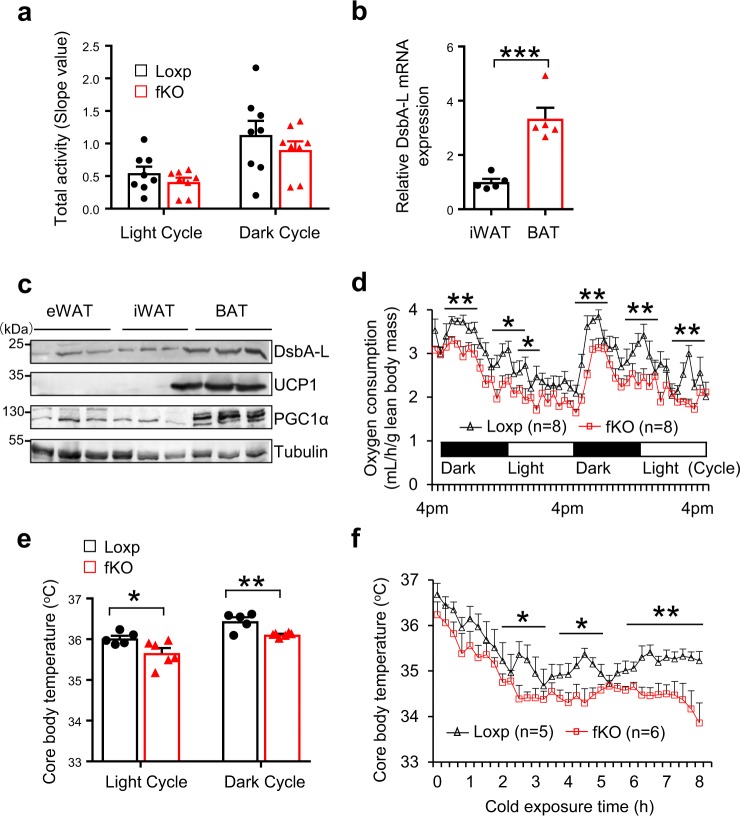
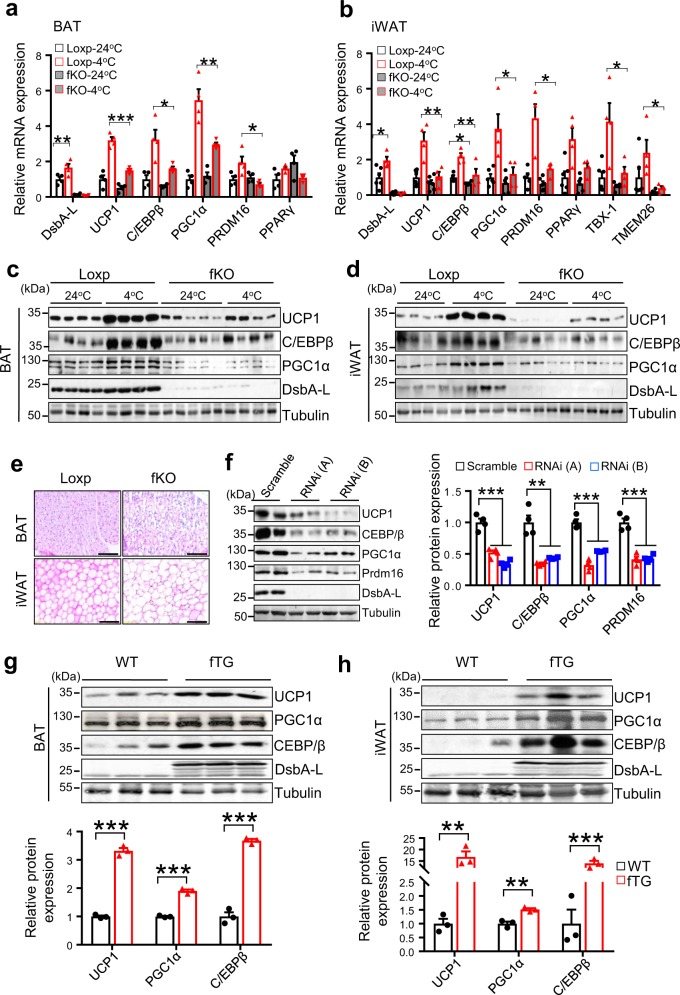
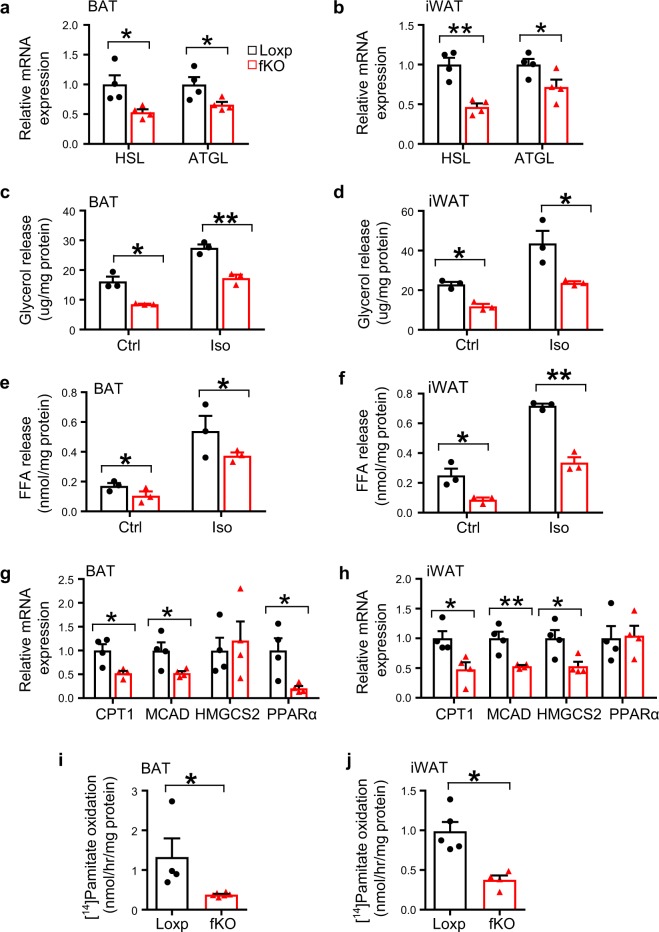
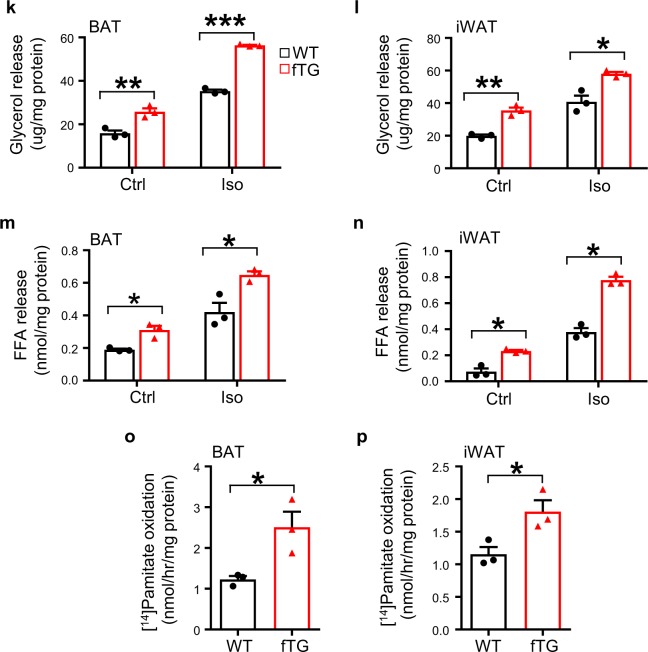
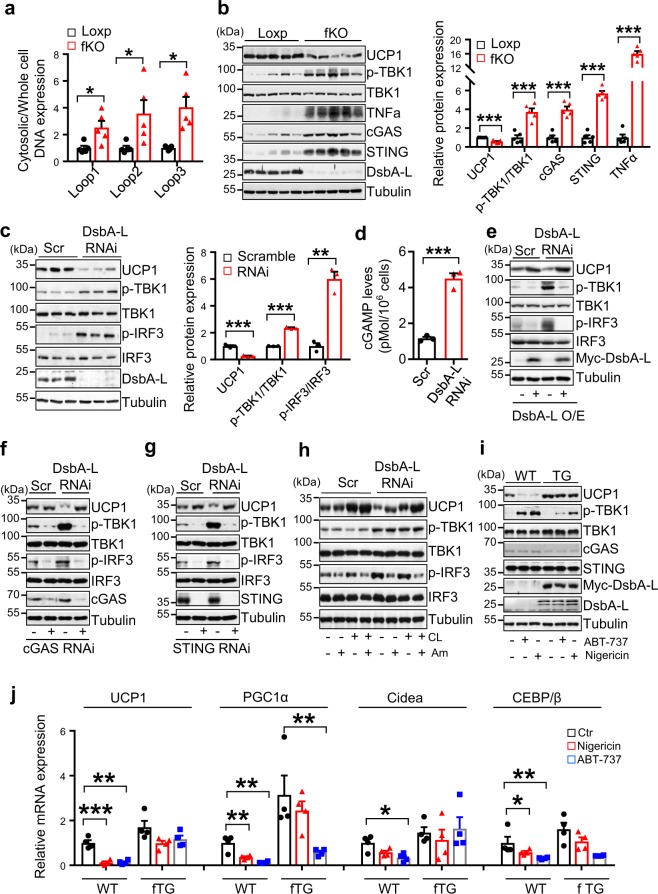
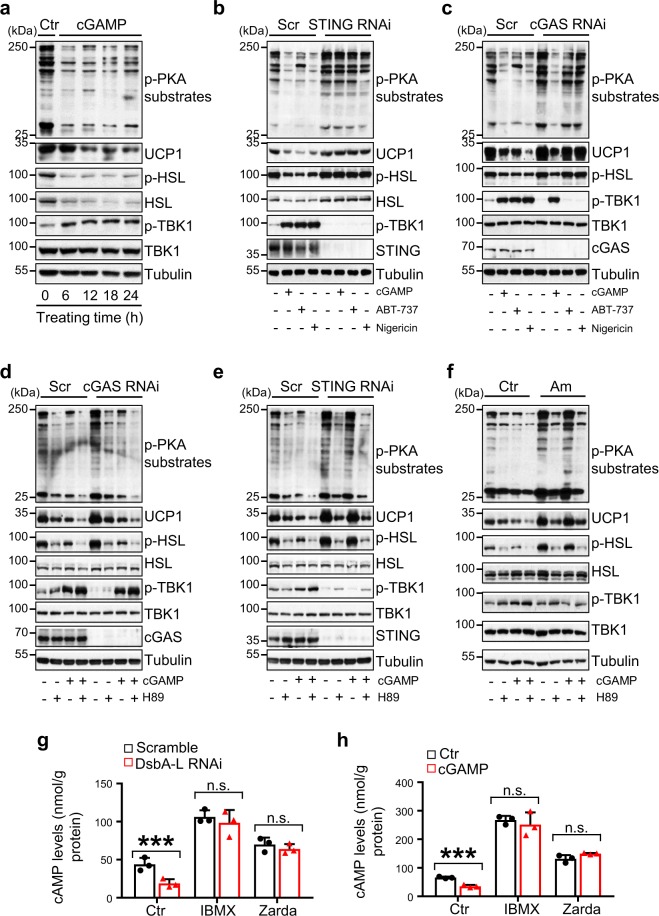
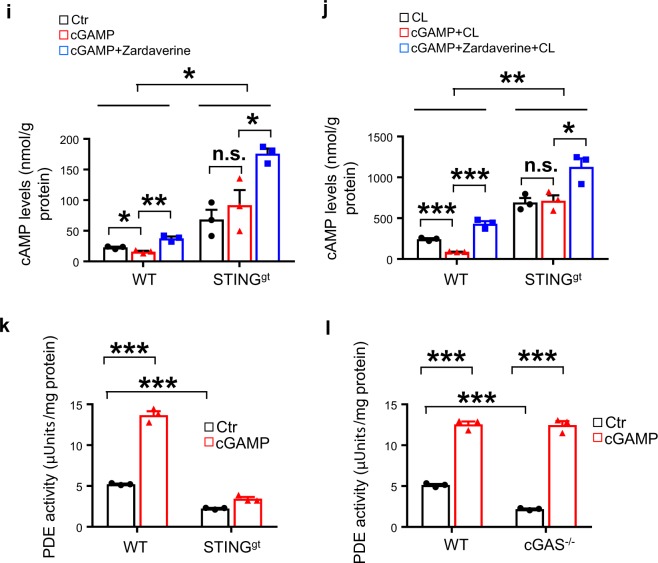
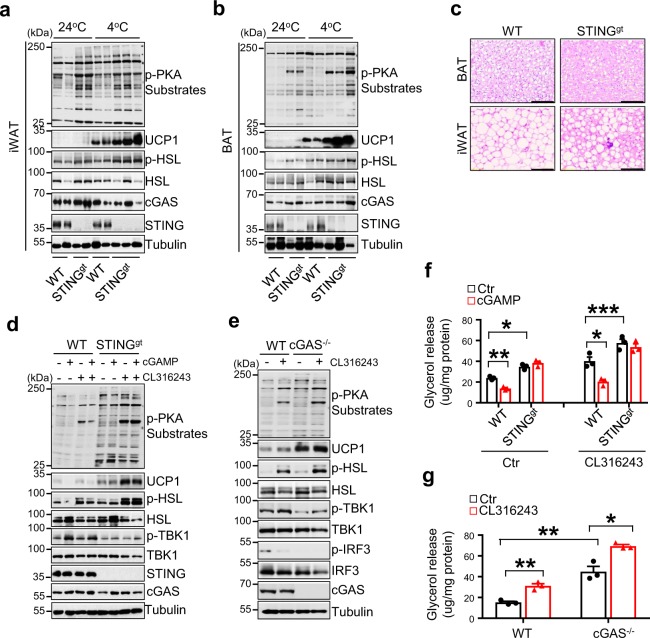
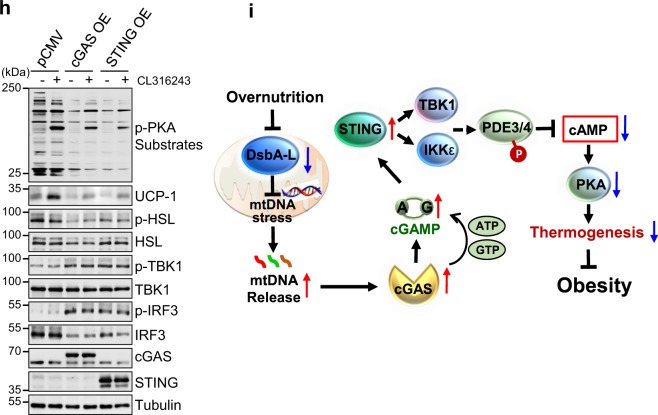
Obesity is a global epidemic that is caused by excessive energy intake or inefficient energy expenditure. Brown or beige fat dissipates energy as heat through non-shivering thermogenesis by their high density of mitochondria. However, how the mitochondrial stress-induced signal is coupled to the cellular thermogenic program remains elusive. Here, we show that mitochondrial DNA escape-induced activation of the cGAS-STING pathway negatively regulates thermogenesis in fat-specific DsbA-L knockout mice, a model of adipose tissue mitochondrial stress. Conversely, fat-specific overexpression of DsbA-L or knockout of STING protects mice against high-fat diet-induced obesity. Mechanistically, activation of the cGAS-STING pathway in adipocytes activated phosphodiesterase PDE3B/PDE4, leading to decreased cAMP levels and PKA signaling, thus reduced thermogenesis. Our study demonstrates that mitochondrial stress-activated cGAS-STING pathway functions as a sentinel signal that suppresses thermogenesis in adipose tissue. Targeting adipose cGAS-STING pathway may thus be a potential therapeutic strategy to counteract overnutrition-induced obesity and its associated metabolic diseases.


Conflict of interest statement

The authors declare no competing interests.

Figures

Fig. 1
Fig. 1. Fat-specific knockout of DsbA-L reduced energy expenditure in mice.
a The activities of DsbA-LfKO (n = 8) and loxp control (n = 8) mice was measured during a 48-h period, including two light/dark cycles. b The mRNA levels of DsbA-L in inguinal WAT (iWAT) (n = 5) and BAT (n = 5) were determined by qPCR and normalized to β-actin. c Immunoblot analysis of DsbA-L, UCP1, PGC1α expression in epididymal WAT (eWAT), iWAT and BAT from C57BL/6 wild-type mice (n = 3). d Oxygen consumption of DsbA-LfKO and loxp control mice was measured during a 48-h period, including two light/dark cycles. e Core body temperature of DsbA-LfKO (n = 5) and loxp control (n = 6) mice at room temperature (24 °C) in the feeding condition. f Core body temperature of DsbA-LfKO and loxp control mice exposed to cold (4 °C) in the feeding condition at different time points as indicated. Data are presented as mean ± SEM of biologically independent samples, *p < 0.05, **p < 0.01, and ***p < 0.001 by unpaired two-tailed t-test.
Fig. 2
Fig. 2. DsbA-L is positively correlated with thermogenic gene expression in brown and beige fat.
Cold exposure-induced mRNA expression in a BAT and b iWAT of DsbA-LfKO (24 °C, n = 6; 4 °C, n = 4) and loxp control (24 °C, n = 4; 4 °C, n = 4) mice. The mRNA levels were determined by qPCR and normalized to β-actin. Immunoblot analysis for cold exposure-induced protein expression of UCP1, C/EBPβ, PGC1α, and DsbA-L in c BAT and d iWAT of DsbA-LfKO and loxp control mice (n = 4 for each group). e Representative H&E stain of BAT and iWAT of DsbA-LfKO and loxp control mice. Scale bar: 200 µM. f Immunoblot analysis for protein expression of thermogenic genes in DsbA-L RNAi-suppressed stable brown adipocytes and control scramble cells (n = 4 for each group). The data were semiquantified by ImageJ program. Immunoblot analysis for protein expression of thermogenic genes in g BAT and h iWAT of fat-specific DsbA-L transgenic mice (DsbA-LfTG) (n = 3) and their control littermates (n = 3). The data were semiquantified by ImageJ program. Data are presented as mean ± SEM of biologically independent samples, *p < 0.05, **p < 0.01, and ***p < 0.001 by unpaired two-tailed t-test (for comparison between two groups) or one-way ANOVA (for comparison of multiple groups).
Fig. 3
Fig. 3. DsbA-L promotes lipolysis and fatty acid oxidation in adipose tissue.
The mRNA levels of lipolytic genes in a BAT and b iWAT of DsbA-LfKO (n = 4) and loxp control (n = 4) mice were determined by qPCR and normalized to β-actin. Glycerol release from primary-cultured adipocytes of c BAT and d iWAT of DsbA-LfKO (n = 3) and loxp control (n = 3) mice. Free fatty acid release from primary-cultured adipocytes of e BAT and f iWAT of DsbA-LfKO (n = 3) and loxp control (n = 3) mice. The mRNA levels of fatty acid oxidation-related genes in g BAT and h iWAT of DsbA-LfKO (n = 4) and loxp control (n = 4) mice were determined by qPCR and normalized to β-actin. The oxidation of 14C-palmitate in i BAT and j iWAT from DsbA-LfKO (n = 4 for BAT and n = 5 for iWAT) and loxp (n = 6 for BAT and n = 4 for iWAT) control mice. Glycerol release from primary-cultured adipocytes of k BAT and l iWAT of DsbA-LfTG and their control mice (n = 3 for each group). Free fatty acid release from isolated m BAT and n iWAT of DsbA-LfTG and their control mice (n = 3 for each group). The oxidation of 14C-palmitate in o BAT and p iWAT isolated from DsbA-LfTG and their control mice (n = 3 for each group). Data are presented as mean ± SEM of biologically independent samples, *p < 0.05, **p < 0.01, and ***p < 0.001 by unpaired two-tailed t-test.
Fig. 4
Fig. 4. Activation of the cGAS–STING pathway mediates DsbA-L deficiency-induced inhibition of thermogenic gene expression.
a Cytosolic mtDNA content was quantitated via qPCR using mtDNA primers (Dloop1-3) in freshly purified brown adipocytes from DsbA-LfKO and loxp control mice (n = 5 for each group). b Immunoblot analysis of UCP1, STING, cGAS, TNFα, DsbA-L expression, and the phosphorylation of TBK1 at Ser172 in BAT from DsbA-LfKO and loxp control mice (n = 5 for each group). The data were semiquantified by ImageJ program. c The protein levels of UCP1, DsbA-L, and the phosphorylation of TBK1 at Ser172 and IRF3 at Ser396 in DsbA-L-suppressed stable brown adipocytes and scramble control adipocytes (n = 3 for each group). The data were semiquantified by ImageJ program. d 2′3′-cGAMP levels in DsbA-L-suppressed brown adipocytes and scramble control cells were measured by HPLC–ESI–MS/MS analysis. e Representative immunoblot analysis of UCP1 expression, TBK1 and IRF3 phosphorylation in DsbA-L-suppressed brown adipocytes and scramble control cells stably overexpressing myc-tagged wild-type DsbA-L and its control plasmid. Representative immunoblot analysis of UCP1 expression, TBK1, and IRF3 phosphorylation in DsbA-L-suppressed brown adipocytes and scramble control cells transiently expressing f cGAS RNAi or g STING RNAi and their respective control plasmid. h Representative immunoblot analysis of UCP1 expression, TBK1, and IRF3 phosphorylation in DsbA-L-suppressed brown adipocytes and scramble control cells treated with or without 1 μM CL316243 or 50 μM amlexanox for 12 h. i Immunoblot analysis of UCP1, STING, cGAS expression, and TBK1 phosphorylation in primary brown adipocytes isolated from DsbA-LfTG and wild-type mice treated with or without 4 μM nigericin or 10 μM ABT-737 for 12 h. j mRNA levels of thermogenic genes in primary brown adipocytes isolated from DsbA-LfTG and wild-type control mice treated with or without 4 μM nigericin or 10 μM ABT-737 (n = 4 for each group) for 12 h. Data are presented as mean ± SEM of biologically independent samples, *p < 0.05, **p < 0.01, and ***p < 0.001 by unpaired two-tailed t-test (for comparison between two groups) or one-way ANOVA (for comparison of multiple groups).
Fig. 5
Fig. 5. The cGAS–STING pathway inhibits cAMP-PKA signaling by activating PDE.
a Representative immunoblot analysis of UCP1 expression, and phosphorylation of PKA substrates, HSL, and TBK1 in brown adipocytes treated with 10 nM 2′3′-cGAMP at different time points as indicated. Representative immunoblot analysis of UCP1 expression, and the phosphorylation of PKA substrates, HSL and TBK1 in b STING RNAi or c cGAS RNAi brown adipocytes treated with 10 nM 2′3′-cGAMP, 10 μM ABT-737 or 4 μM nigericin for 12 h. Representative immunoblot analysis of UCP1 expression, and the phosphorylation of PKA substrates, HSL, and TBK1 in d cGAS-, e STING-, or f TBK1/IKKε-suppressed brown adipocytes treated with or without 10 nM 2′3′-cGAMP or 10 μM H89 for 12 h. g cAMP levels in scramble and DsbA-L-suppressed brown adipocytes treated with or without 250 μM IBMX or 10 μM zardaverine (Zarda) for 15 min (n = 3 for each group). h cAMP levels in brown adipocytes treated with or without 10 nM 2′3′-cGAMP for 6 h followed by treatment with or without 250 μM IBMX or 10 μM zardaverine (Zarda) for 15 min (n = 3 for each group). cAMP levels in primary adipocytes isolated from iWAT of wild-type and STING-deficient mice (STINGgt) (n = 3 for each group) treated with or without 10 nM 2′3′-cGAMP for 6 h followed by treatment of 10 μM zardaverine (Zarda) for 15 min in the i absence or j presence of CL316243. PDE activities were measured in primary adipocytes isolated from iWAT of k STINGgt or l cGAS−/− mice (n = 3 for each group) treated with or without 10 nM 2′3′-cGAMP for 6 h. Data are presented as mean ± SEM of biologically independent samples, *p < 0.05, **p < 0.01, and ***p < 0.001 by unpaired two-tailed t-test (for comparison between two groups) or one-way ANOVA (for comparison of multiple groups).
Fig. 6
Fig. 6. Knockout of cGAS or STING in mice increased PKA signaling and thermogenesis.
Immunoblot analysis of UCP1 expression and the phosphorylation of PKA substrates including HSL in a iWAT and b BAT of STINGgt and their control littermates exposed to cold stress (4 °C) or housed at room temperature (24 °C). c Representative H&E stain of BAT and iWAT of wild-type and STINGgt mice. Scale bar: 200 µM. Immunoblot analysis of UCP1 expression and the phosphorylation of PKA substrates, HSL, TBK1, and IRF3 in primary-cultured inguinal adipocytes treated with 1 μM CL316243 in the presence or absence of 10 nM 2′3′-cGAMP from d STINGgt or e cGAS−/− mice and their wild-type control mice. Glycerol release from primary-cultured inguinal adipocytes treated with 1 μM CL316243 in the presence or absence of 10 nM 2′3′-cGAMP from f STINGgt or g cGAS−/− mice and their wild-type control mice (n = 3 for each group). h Immunoblot analysis of UCP1 expression and the phosphorylation of PKA substrates, HSL, TBK1, and IRF3 in cGAS or STING overexpressed primary inguinal adipocytes treated with 1 μM CL316243 for 12 h. i A graphic model on the negative regulation of thermogenesis by the cGAS–STING pathway in adipose tissue. Data are presented as mean ± SEM of biologically independent samples, *p < 0.05, **p < 0.01, and ***p < 0.001 by unpaired two-tailed t-test (for comparison between two groups) or one-way ANOVA (for comparison of multiple groups).

References

    1. Li T, Chen ZJ. The cGAS-cGAMP-STING pathway connects DNA damage to inflammation, senescence, and cancer. J. Exp. Med. 2018;215:1287–1299. - PMC - PubMed
    1. West AP, et al. Mitochondrial DNA stress primes the antiviral innate immune response. Nature. 2015;520:553–557. - PMC - PubMed
    1. Rongvaux A, et al. Apoptotic caspases prevent the induction of type I interferons by mitochondrial DNA. Cell. 2014;159:1563–1577. - PMC - PubMed
    1. White MJ, et al. Apoptotic caspases suppress mtDNA-induced STING-mediated type I IFN production. Cell. 2014;159:1549–1562. - PMC - PubMed
    1. Bai J, et al. DsbA-L prevents obesity-induced inflammation and insulin resistance by suppressing the mtDNA release-activated cGAS-cGAMP-STING pathway. Proc. Natl Acad. Sci. USA. 2017;114:12196–12201. - PMC - PubMed

Publication types

MeSH terms

Substances