. 2020 Aug;598(16):3459-3483.
doi: 10.1113/JP279460. Epub 2020 Jun 12.

Comparison of operation of spinal locomotor networks activated by supraspinal commands and by epidural stimulation of the spinal cord in cats

Affiliations

Comparison of operation of spinal locomotor networks activated by supraspinal commands and by epidural stimulation of the spinal cord in cats

Pavel E Musienko et al. J Physiol. 2020 Aug.

Abstract

Key points: Epidural electrical stimulation (ES) of the spinal cord restores/improves locomotion in patients. ES-evoked locomotor movements differ to some extent from the normal ones. Operation of the locomotor network during ES is unknown. We compared the activity of individual spinal neurons during locomotion initiated by signals from the brainstem and by ES. We demonstrated that the spinal network generating locomotion under each of the two conditions is formed by the same neurons. A part of this network operates similarly under the two conditions, suggesting that it is essential for generation of locomotion under both conditions. Another part of this network operates differently under the two conditions, suggesting that it is responsible for differences in the movement kinematics observed under the two conditions.

Abstract: Locomotion is a vital motor function for both animals and humans. Epidural electrical stimulation (ES) of the spinal cord is used to restore/improve locomotor movements in patients. However, operation of locomotor networks during ES has never been studied. Here we compared the activity of individual spinal neurons recorded in decerebrate cats of either sex during locomotion initiated by supraspinal commands (caused by stimulation of the mesencephalic locomotor region, MLR) and by ES. We found that under both conditions, the same neurons had modulation of their activity related to the locomotor rhythm, suggesting that the network generating locomotion under the two conditions is formed by the same neurons. About 40% of these neurons had stable modulation (i.e. small dispersion of their activity phase in sequential cycles), as well as a similar phase and shape of activity burst in MLR- and ES-evoked locomotor cycles. We suggest that these neurons form a part of the locomotor network that operates similarly under the two conditions, and are critical for generation of locomotion. About 23% of the modulated neurons had stable modulation only during MLR-evoked locomotion. We suggest that these neurons are responsible for some differences in kinematics of MLR- and ES-evoked locomotor movements. Finally, 25% of the modulated neurons had unstable modulation during both MLR- and ES-evoked locomotion. One can assume that these neurons contribute to maintenance of the excitability level of locomotor networks necessary for generation of stepping, or belong to postural networks, activated simultaneously with locomotor networks by both MLR stimulation and ES.

Keywords: decerebrate cat; epidural stimulation; locomotion; mesencephalic locomotor region; sensory feedback; spinal neurons.


Conflict of interest statement

Competing interests

The authors declare that they have no competing interests.

Figures

Figure 1.
Figure 1.. Experimental design for recording of the same neurons during MLR- and ES-evoked locomotion.
A, The head, vertebral column and pelvis of a decerebrate cat were fixed in a rigid frame (points of fixation are indicated by X). The hindlimbs were positioned on the treadmill. Walking of the hindlimbs was evoked by stimulation of the mesencephalic locomotor region (MLR-stim) or the epidural stimulation of the spinal cord (ES). Anterior/posterior movements of each limb were recorded by mechanical sensors (only the right sensor, Limb-R, is shown). The contact force under each limb was measured by a force plate (FP). Neuronal activity was recorded by a multichannel electrode array (ME). B-D, Location of five spinal neurons (#1–5) recorded simultaneously by the multichannel electrode array on the left side of L6 (B), waveforms of their spikes extracted from the mass activity by spike sorting procedure (C), as well as their activity during MLR- and ES-evoked locomotion (D and E, respectively). Neuronal activity was recorded along with movements of the right and left limbs (Limb-R and Limb-L), contact forces (Force-R and Force-L), and EMGs of the left and right gastrocnemius and tibialis muscles (Gast-L, Gast-R and Tib-L, Tib-R, respectively). The EMGs were rectified. In E, the EMG signals contained large responses to individual epidural stimuli (indicated by red arrows). Swing phases of the left hindlimb are highlighted.
Figure 2.
Figure 2.. Comparison of locomotor movements evoked by MLR-stimulation and by ES of the L5.
A,B, Extreme left hindlimb positions during one step cycle evoked by MLR-stimulation (A) and by ES (B). Angles αA and αP characterize the extreme anterior and posterior paw positions in relation to the trunk, respectively. Angle Δα characterizes the magnitude of limb movements. Thick and thin arrows indicate directions of the treadmill belt movement and the foot movement during swing, respectively. Note, that during stepping evoked by MLR stimulation the limb is landed at more rostral position in relation to the trunk as compared with that observed during stepping evoked by ES (compare distance between the anterior extreme paw position and the projection of the hip on the treadmill surface in A and B, respectively). C,D, Comparison of characteristics of stepping evoked by MLR stimulation and ES (mean ± SD are indicated by black lines across corresponding dot clouds showing the values of the parameter in individual cycles. In C, the number of animals, episodes and cycles analyzed during MLR-evoked as well as during ES-evoked locomotion: N=5, nep=17 and ncyc=140, respectively. In D, N=5, nep=107, ncyc=2711 were analyzed during MLR-evoked locomotion, and N=5, nep=113, ncyc=1797 were analyzed during ES-evoked locomotion. Indication of significance level: * p < 0.05, *** p < 0.001).
Figure 3.
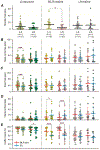
Figure 3.. Neurons recorded in L4 and L6 spinal segments during both locomotion evoked by MLR stimulation and by ES.
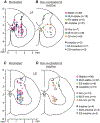
A-D, Position of different types of neurons modulated under both conditions (A,C), as well as non-modulated, inactive and modulated under only one condition neurons (B,D) on the cross-section of the spinal cord, recorded in L4 (A,B) and L6 (C,D). Designations: Stable, neurons with stable modulation under both conditions; MLR-stable, neurons with stable modulation during MLR-stimulation and unstable modulation during ES; ES-stable, neurons with stable modulation during ES and unstable modulation during MLR-stimulation; Unstable, neurons with unstable modulation under both conditions; N/m, non-modulated neurons; MLR-n/m, non-modulated during MLR stimulation and modulated during ES; ES-n/m, non-modulated during ES and modulated during MLR stimulation; Inactive, Neurons with the mean cycle frequency less than 1 Hz under both conditions; MLR-inactive, inactive during MLR stimulation only; ES-inactive, inactive during ES only.
Figure 4.
Figure 4.. Comparison of modulation patterns of individual neurons during MLR- and ES-evoked locomotion.
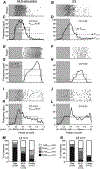
A-L, Examples of modulation patterns of three neurons (A-D, E-H, and I-L, respectively) during MLR-stimulation (A,C,E,G,I,K) and ES (B,D,F,H,J,L). For each condition (MLR-stimulation and ES), the raster (for clarity, only 10 out of 20–60 recorded cycles are shown in each neuron) and the histogram (thick line) of the activity of the neuron in the cycle of the ipsilateral hindlimb are shown. The swing phase is highlighted. The dotted lines show the best two-level rectangular approximations of the histograms, with the burst period (upper level indicating also the mean burst frequency, FBURST in D) and interburst period (lower level indicating also the mean interburst frequency, FINTER in D). The dashed lines show the mean cycle frequency (FCYCLE in D). The average correlation coefficient (CC) between the profiles of activity in individual locomotor cycles and in the entire activity histogram, as well as the coefficient of similarity (KSIMILAR), that is the correlation coefficient between the activity phase histograms obtained under two conditions, are indicated. Two neurons shown in A-H were classified as Stable neurons, and the neuron shown in I-L – as Unstable one. M,N, Comparison of the relative number of neurons with different values of the coefficient of similarity in populations Stable (Stab), MLR-stable (MLR-stab), and Unstable (Unstab) neurons recorded in L4 (M) and L6 (N). Parts of the bars outlined by dashed line indicate relative number of neurons with KSIMILAR ≥ 0.7. Number of animals and number of Stable, MLR-stable, Unstable neurons in M: N = 3 and n = 50, 18, 31, respectively. Number of animals and number of Stable, MLR-stable, Unstable neurons in N: N = 2 and n = 36, 22, 13, respectively.
Figure 5.
Figure 5.. Phases of activity in the locomotor cycle of individual S-neurons, MLR-stable, and Unstable neurons during MLR- and ES-evoked locomotion.
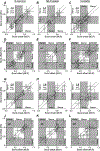
A-L, Phase distribution of bursts of individual S-neurons (A,D,G,J), MLR-stable (B,E,H,K) and Unstable (C,F,I,L) neurons recorded in L4 (A-F) and L6 (G-L) in the cycle of MLR-evoked (A-C,G-I) and ES-evoked (D-F,J-L) locomotion. The x and y values of each point show the mean ± SD phases of the burst onset and the burst offset in the locomotor cycle, respectively. A dashed red ellipse deliniates a part of the locomotor cycle in which a subpopulation of S-neurons recorded in L4 had bursts of activity, but in a given population such subpopulation was absent. Number of animals and number of S-neurons, MLR-stable, Unstable neurons in A-F: N = 3 and n = 42, 18, 31, respectively. Number of animals and number of S-neurons, MLR-stable, Unstable neurons in G-L: N = 2 and n = 30, 22, 13, respectively.
Figure 6.
Figure 6.. Comparison of burst onsets and burst offsets of individual S-neurons, MLR-stable, and Unstable neurons in MLR-evoked and ES-evoked locomotor cycles.
In scatter plots A-L, the x and y values of each point show the mean ± SD phase of the burst onset (A-C,G-I) or the mean ± SD phase of the burst offset (D-F,J-L) in the MLR- and ES-evoked locomotor cycle, respectively. The data are presented separately for S-neurons (A,D,G,J), MLR-stable (B,E,H,K), and Unstable (C,F,I,L) neurons recorded in L4 (A-F) and in L6 (G-L). Dotted lines delineate the neurons with a shift of the burst onset or the burst offset less or equal to 0.1 part of the locomotor cycle. Number of animals and number of S-neurons, MLR-stable, Unstable neurons in A-F: N = 3 and n = 42, 18, 31, respectively. Number of animals and number of S-neurons, MLR-stable, Unstable neurons in G-L: N = 2 and n = 30, 22, 13, respectively.
Figure 7.
Figure 7.. Comparison of burst phases of individual S-neurons, MLR-stable, and Unstable neurons in MLR-evoked and ES-evoked locomotor cycles.
A,B, Relative number of S-neurons, MLR-stable (MLR-stab), and Unstable (Unstab) neurons with less or equal to 0.1 part of the cycle shift of both the burst onset and the burst offset (ΔPh(on,off) ≤ 0.1, black parts of bars), of the burst onset only (ΔPh(on) ≤ 0.1, light gray parts of bars), of the burst offset only (ΔPh(off) ≤ 0.1, dark gray parts of bars), and those with more than to 0.1 part of the cycle shift of both the burst onset and the burst offset (ΔPh(on,off) > 0.1, white parts of bars) recorded in L4 (A) and in L6 (B). Number of animals and number of S-neurons, MLR-stable, Unstable neurons in A: N = 3 and n = 42, 18, 31, respectively. Number of animals and number of S-neurons, MLR-stable, Unstable neurons in B: N = 2 and n = 30, 22, 13, respectively.
Figure 8.
Figure 8.. Comparison of different characteristics of activity of individual S-neurons, MLR-stable, and Unstable neurons recorded in L4 and in L6 during MLR- and ES-evoked locomotion.
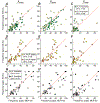
A-I, Comparison of mean cycle frequencies (FCYCLE, A,D,G), mean burst (FBURST, B,E,H) and interburst (FINTER, C,F,I) frequencies of individual S-neurons (A-C), MLR-stable (D-F) and Unstable (G-I) neurons during MLR- and ES-evoked locomotion. The x and y values of each point show the frequency of an individual neuron during MLR- and ES-evoked locomotion, respectively. Number of animals, number of S-neurons MLR-stable, Unstable neurons from L4 and L6: N = 3, n = 42, 18, 31 and N = 2, n = 30, 22, 13, respectively.
Figure 9.
Figure 9.. Comparison of different characteristics of population activity of S-neurons, MLR-stable, and Unstable neurons recorded in L4 and in L6 during MLR- and ES-evoked locomotion.
A-E, Mean ± SD values of spontaneous frequency (A), cycle frequency (B), burst (C) and interburst (D) frequency, coefficient of modulation (E) for populations of S-neurons, MLR-stable and Unstable neurons recorded in L4 and in L6 during MLR-evoked (indicated by red lines across corresponding clouds of diamonds showing the mean values of the parameter for individual neurons) and ES-evoked (indicated by blue lines) locomotion. Number of animals, number of S-neurons MLR-stable, Unstable neurons from L4 and L6: N = 3, n = 42, 18, 31 and N = 2, n = 30, 22, 13, respectively. Indication of significance level: * p < 0.05, *** p < 0.001.
Figure 10.
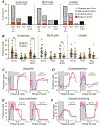
Figure 10.. Effects of passive movements of the ipsilateral and of the contralateral hindlimb along the locomotor trajectory on activity of S-neurons, MLR-stable, and Unstable neurons.
A, Relative numbers of neurons modulated by passive movements of either hindlimb (Ipsi- & Co- bars), neurons modulated by movements of only ipsilateral or only contralateral limb (Ipsi- and Co- bars, respectively), and neurons non-modulated by passive limb movements (Non-mod bars), in populations of S-neurons, MLR-stable, and Unstable neurons. Parts of the Ipsi- & Co- bars with dotted and solid outlines show the proportions of neurons with complimentary and opposite inputs from ipsilateral and contralateral hindlimb (see Results for explanation), respectively. Red, pink, and gray parts of the bars indicate the proportion of neurons with the phase of modulation caused by sensory feedback similar to, strongly overlapping with, and different from that observed during locomotion (Similar to loc, Contrib to loc, and Cannot contrib to loc, respectively). Number of S-neurons, MLR-stable, and Unstable neurons recorded in 5 cats: n=55, 23, and 31, respectively. B, Mean ± SD values of the burst (Burst) and interburst (Inter) frequency, and the depth of modulation in S-neurons, MLR-stable, and Unstable neurons caused by passive movements of the ipsilateral limb (Ipsi-hl, N = 5, n = 39, 22, 31, respectively) and of the contralateral hindlimb (Co-hl, N = 5, n = 31, 19, 21, respectively) are indicated by black lines across corresponding clouds of diamonds showing the mean frequencies for individual neurons. Indication of significance level: ** 0.001 < p < 0.01, *** p < 0.001. C,D, Examples of two neurons with opposite (C) and complementary (D) sensory feedback from ipsilateral and contralateral hindlimbs. E,F, Examples of two neurons with sensory feedback from ipsilateral limb only, which can contribute (E) and cannot contribute (F) to locomotor modulation of the neuron. For each neuron, the histogram (thick line) of the activity of the neuron in the cycle of the ipsilateral hindlimb (Ipsi-hl) passive movements (left panels in C-F), and in the cycle of the contralateral hindlimb (Co-hl) passive movements (right panels in C,D) or in the cycle of the ipsilateral hindlimb locomotor movements (right panels in E,F) are shown. The swing phase is highlighted. The blue lines show the best two-level rectangular approximations of the histograms (as in Fig. 4A–L).

Similar articles

Cited by

References

    1. Angel MJ, Jankowska E & McCrea DA (2005). Candidate interneurons mediating group I disynaptic EPSPs in extensor motoneurons during fictive locomotion in the cat. J Physiol 563, 597–610. - PMC - PubMed
    1. AuYong N, Olliver-Lanvin K & Lemay A (2011). Preferred locomotor phase of activity of lumbar interneurons during air-stepping in subchronic spinal cats. J Neurophysiol 105, 1011–1022. - PMC - PubMed
    1. Baev KV, Degtyarenko AM, Zavadskaya TV & Kostyuk PG (1979). Activity of lumbar interneurons during fictitious locomotion in thalamic cats. Neirofiziologiya 11, 329–338. - PubMed
    1. Baev KV, Beresovskii VK, Kebkalo TG & Savoskina LA (1988). Afferent and efferent connections of brainstem locomotor regions study by means of horseradish peroxidase transport technique. Neuroscience 26, 871–892. - PubMed
    1. Barthélemy D, Leblond H & Rossignol S (2007). Characteristics of mechanisms of locomotion induced by intraspinal microstimulation and dorsal root stimulation in spinal cats. J Neurophysiol 97, 1986–2000. - PubMed

Publication types