. 2020 Jun 11;181(6):1329-1345.e24.
doi: 10.1016/j.cell.2020.04.047. Epub 2020 May 22.

Metabolic Regulation of the Epigenome Drives Lethal Infantile Ependymoma

Kulandaimanuvel Antony Michealraj  1 Sachin A Kumar  2 Leo J Y Kim  3 Florence M G Cavalli  1 David Przelicki  2 John B Wojcik  4 Alberto Delaidelli  5 Andrea Bajic  6 Olivier Saulnier  1 Graham MacLeod  7 Ravi N Vellanki  8 Maria C Vladoiu  2 Paul Guilhamon  1 Winnie Ong  2 John J Y Lee  2 Yanqing Jiang  1 Borja L Holgado  1 Alex Rasnitsyn  9 Ahmad A Malik  10 Ricky Tsai  11 Cory M Richman  9 Kyle Juraschka  2 Joonas Haapasalo  1 Evan Y Wang  9 Pasqualino De Antonellis  1 Hiromichi Suzuki  1 Hamza Farooq  1 Polina Balin  2 Kaitlin Kharas  2 Randy Van Ommeren  2 Olga Sirbu  9 Avesta Rastan  1 Stacey L Krumholtz  1 Michelle Ly  2 Moloud Ahmadi  7 Geneviève Deblois  8 Dilakshan Srikanthan  2 Betty Luu  1 James Loukides  1 Xiaochong Wu  1 Livia Garzia  12 Vijay Ramaswamy  13 Evgeny Kanshin  14 María Sánchez-Osuna  14 Ibrahim El-Hamamy  15 Fiona J Coutinho  1 Panagiotis Prinos  16 Sheila Singh  17 Laura K Donovan  1 Craig Daniels  1 Daniel Schramek  10 Mike Tyers  14 Samuel Weiss  18 Lincoln D Stein  15 Mathieu Lupien  8 Bradly G Wouters  8 Benjamin A Garcia  4 Cheryl H Arrowsmith  19 Poul H Sorensen  5 Stephane Angers  20 Nada Jabado  21 Peter B Dirks  22 Stephen C Mack  23 Sameer Agnihotri  24 Jeremy N Rich  25 Michael D Taylor  26
Affiliations

Metabolic Regulation of the Epigenome Drives Lethal Infantile Ependymoma

Kulandaimanuvel Antony Michealraj et al. Cell. .

Abstract

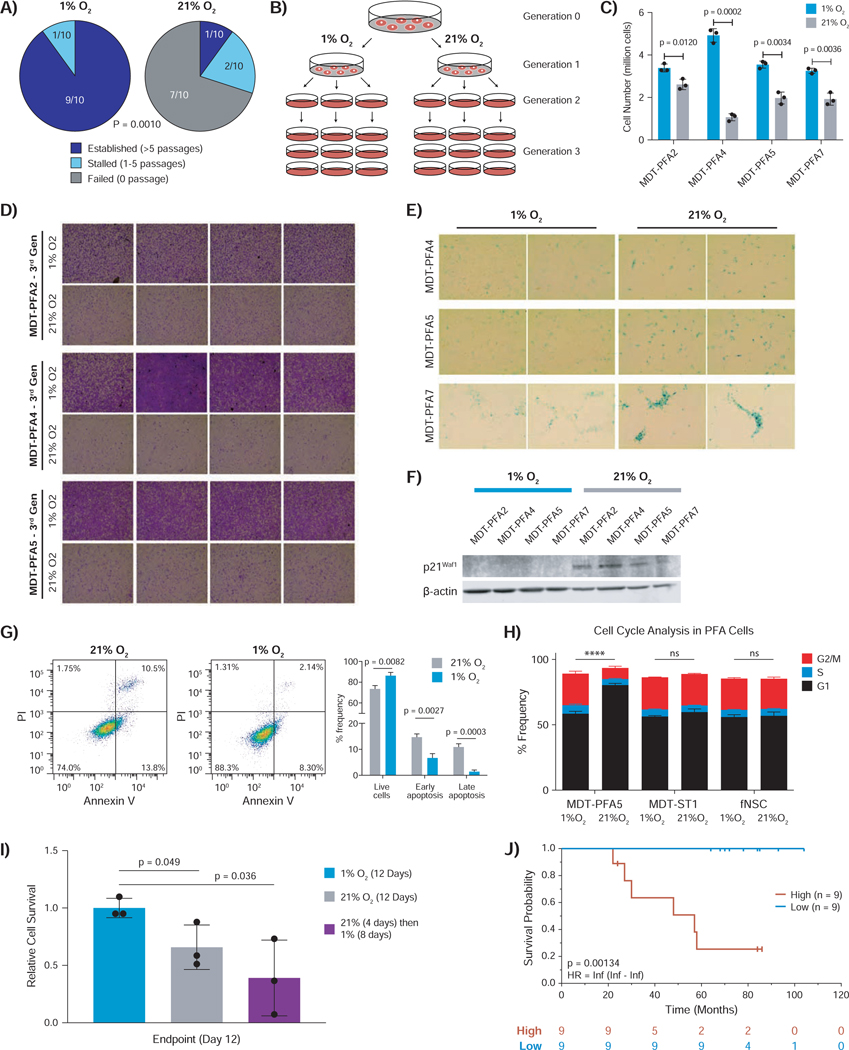
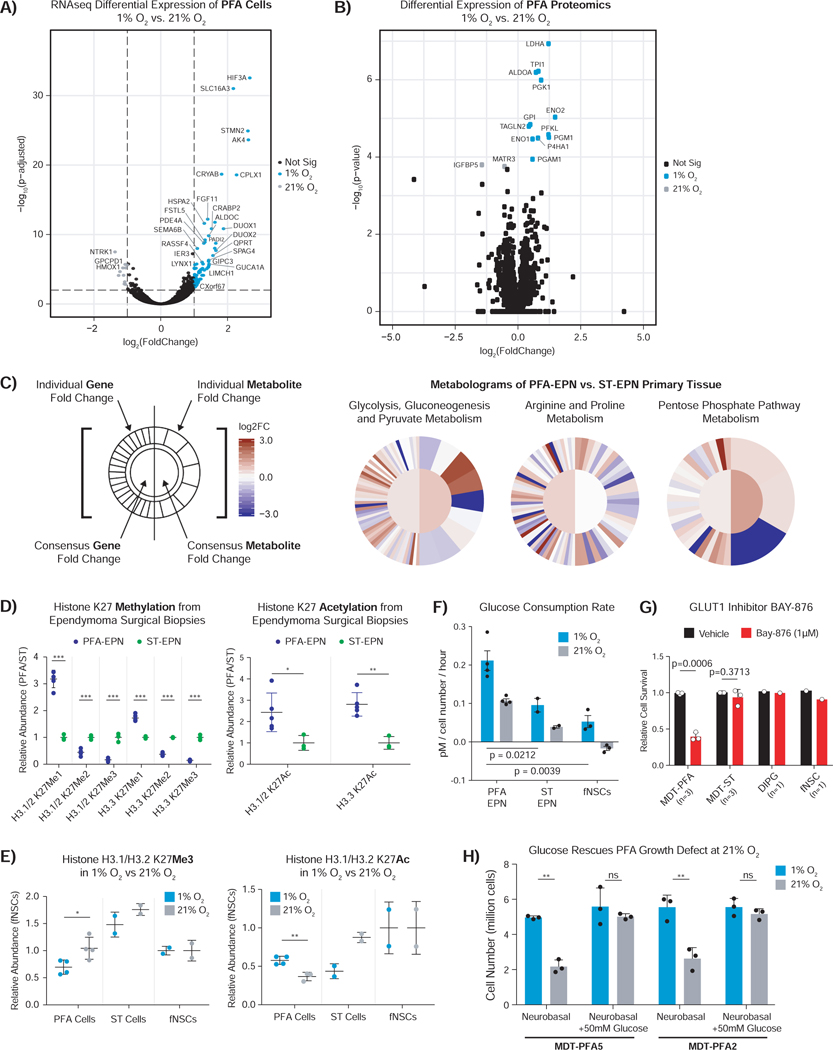
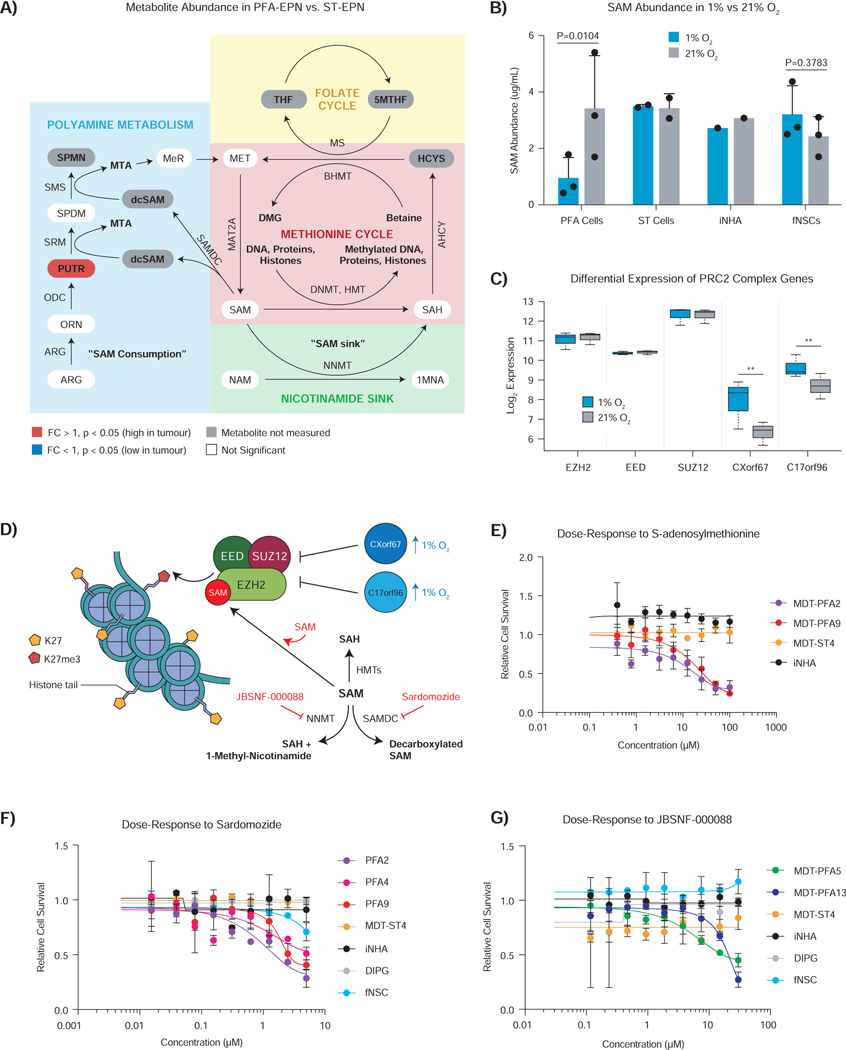
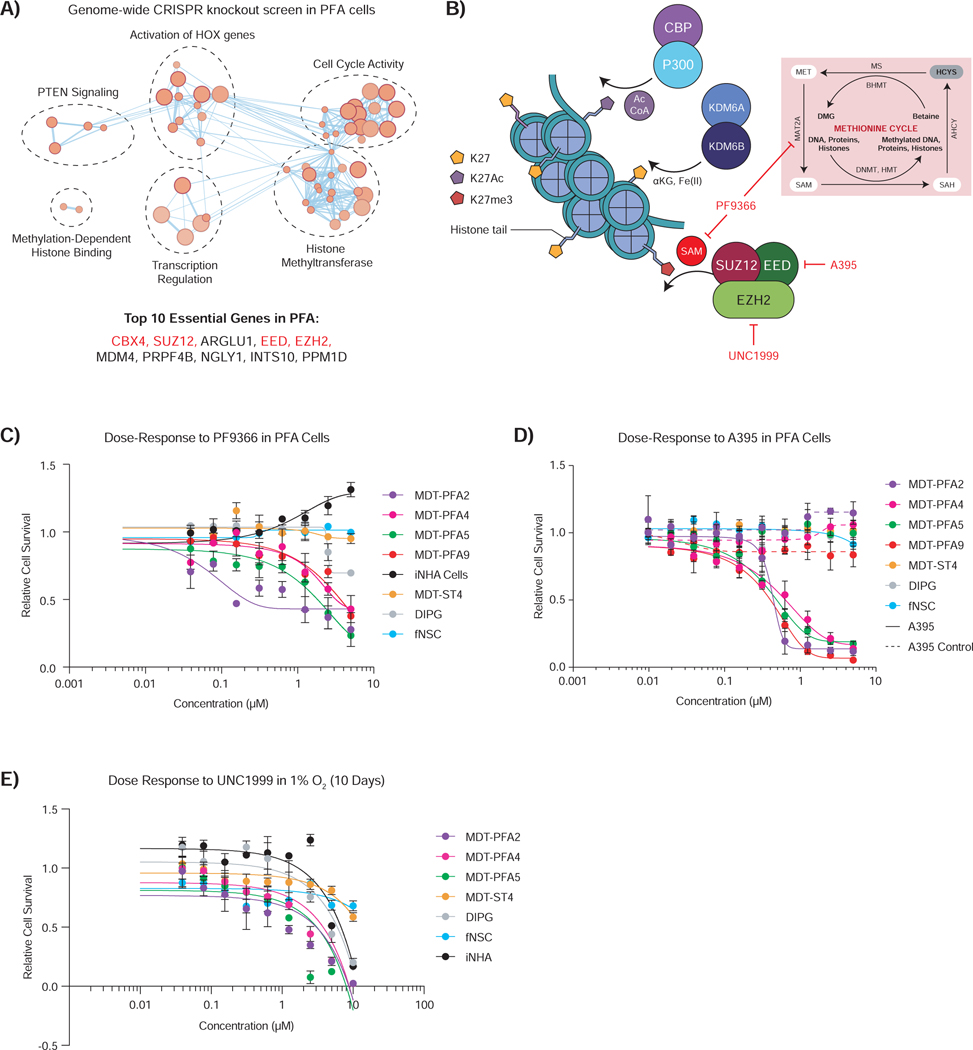
Posterior fossa A (PFA) ependymomas are lethal malignancies of the hindbrain in infants and toddlers. Lacking highly recurrent somatic mutations, PFA ependymomas are proposed to be epigenetically driven tumors for which model systems are lacking. Here we demonstrate that PFA ependymomas are maintained under hypoxia, associated with restricted availability of specific metabolites to diminish histone methylation, and increase histone demethylation and acetylation at histone 3 lysine 27 (H3K27). PFA ependymomas initiate from a cell lineage in the first trimester of human development that resides in restricted oxygen. Unlike other ependymomas, transient exposure of PFA cells to ambient oxygen induces irreversible cellular toxicity. PFA tumors exhibit a low basal level of H3K27me3, and, paradoxically, inhibition of H3K27 methylation specifically disrupts PFA tumor growth. Targeting metabolism and/or the epigenome presents a unique opportunity for rational therapy for infants with PFA ependymoma.

Keywords: cancer metabolism; ependymoma; epigenetics; hindbrain development; microenvironment; paediatric cancer.


Conflict of interest statement

Declaration of Interests The authors declare no competing interests.

Figures

Figure 1 –
Figure 1 –. PFA ependymoma mandates hypoxic conditions
A) Patient derived PFA ependymoma primary cells undergo sustained growth in 1%, but not 21% oxygen. Cell lines were considered established if they could sustain 5 consecutive passages in culture, stalled if fewer than 5 passages, and failed if they never demonstrated growth in vitro. Two tailed Fisher’s exact test was used for statistical comparison. B) Schematic representation of continuous culture in 1% versus 21% O2. A “generation” denotes a consecutive passage in each condition. C) Proliferation of PFA cells cultured continuously in 1% O2 (blue) is significantly sustained and increased compared to 21% O2 (grey). Cell counts represent average viable cells remaining per plate at the end of the 3rd generation. Statistical comparison was performed using two-tailed t-test. D) Crystal violet staining of 3rd generation PFA cells demonstrates high confluence of cells in 1% O2 compared to 21% O2. Each square is a representative image for the culture condition. E) Senescence-associated β-Galactosidase staining of 3rd generation PFA cells demonstrates increased senescence in 21% O2, but not 1% O2. Blue colour indicates positive X-gal staining. F) Immunoblot for p21Waf1 demonstrates increased expression in 21% compared to 1% O2. G) Flow cytometry-based quantification of apoptosis using Annexin V and propidium iodide in PFA cell lines reveals a significant increase in apoptosis in 21% O2. Statistical comparisons were conducted using Welch’s t-test from technical triplicates for each sample. H) Cell cycle analysis demonstrates an increase in G1 arrest of PFA cells, but not control STEPN or fetal neural stem cells (fNSCs), in 21% O2 versus 1% O2. Statistical comparison was performed using multiple t-testing for the G1 cell cycle phase between 1% vs. 21% oxygen of each cell type. I) PFA cells cultured in 21% O2 for 4 days and then returned to 1% O2, display an irreversible decrease in proliferation. Statistical comparison was performed using twotailed t-test. J) Poor outcome among PFA patients with a hypoxic gene signature (MSigDB). Kaplan-Meier survival curve stratified by hypoxia signature (high = red, low = blue) is correlated with worse overall survival in a cohort of 18 PFA patients. Statistical comparison was performed using the log-rank test after FDR correction.
Figure 2 –
Figure 2 –. PFA ependymomas harbor a unique metabolic and global histone hypomethylation profile
A) Volcano plot of differential gene expression analysis for PFA cells cultured in 1% versus 21% oxygen. Significantly differentially expressed genes are indicated in colour (log2foldchange > 1, Padj < 0.05). B) Volcano plot of differential proteomic expression analysis for PFA cells cultured in 1% O2 versus 21% O2. Significantly differentially expressed proteins are indicated in colour (FDR < 0.05). C) Integrative metabologram of gene expression and metabolite abundance for selected KEGG pathways in PFA tissue relative to ST-EPN tissue (derived from (Hakimi et al., 2016a)). Log2FoldChange shown on a set scale from −3.0 to 3.0. D) Relative levels of histone K27 methylation and acetylation in PFA (n=5) versus ST-EPN surgical (n=3) biopsies assessed by post-translational modification histone-tail mass spectrometry. E) Relative abundance of H3.1 and H3.2 K27 methylation and acetylation in cultured PFA, ST and (fNSCs) under 1% and 21% O2 as assessed by post-translational modification histone-tail mass spectrometry. F) Increased glucose consumption rate of cultured PFA, as compared to ST and fNSCs, and in 1% versus 21% O2. G) Treatment of PFA cells with a GLUT1 specific inhibitor, BAY-876 (1μM), perturbs PFA, but not fNSCs survival in 1% O2. Bar plot shows relative survival. H) Glucose (50mM) supplementation rescues the growth defect of third generation PFA cells grown in 21% O2. Data are displayed as mean ± SEM. *p < 0.05, **p < 0.01 and ***p < 0.001. Statistical comparisons were conducted using Welch’s t-test for E-H.
Figure 3 –
Figure 3 –. Hypoxia drives SAM deficiency, thereby perturbing PRC2-dependent methylation and maintaining H3K27 hypomethylation in PFA ependymoma.
A) Relative metabolite abundance of methionine cycle metabolites and intermediates, including the nicotinamide N-methyltransferase sink and polyamine metabolism, in PFA (n=15) versus ST-EPN (n=4) surgical biopsies. Significantly differentially abundant metabolites characterized by t-test with FDR correction (q-value < 0.05). B) Hypoxia significantly decreases SAM abundance in PFA cells but not control ST-EPN, immortalized normal human astrocytes (iNHA) or fNSCs. C) Hypoxia does not affect the transcript expression of PRC2 core subunits, but does increases the expression of PRC inhibitory genes, CXorf67 (EZHIP) and C17orf96 (EPOP), in 1% oxygen. Statistical comparison was performed using Wald test with Benjamini-Hochberg adjustment. D) Cartoon depicting the relationship between metabolism of SAM (SAM consuming metabolic pathways) and the PRC2 complex activity during K27 methylation. Hypoxia mediated over expression of PRC2 complex inhibitory genes (blue) and targets/drugs (red) are indicated. E) Supplementing exogenous SAM to PFA cells grown in 1% O2 diminishes survival in a dose dependent manner. F) Dose dependent Sardomozide inhibition (7 days) of SAM decarboxylation (polyamine metabolism) diminishes PFA cell survival in 1% O2. G) Dose dependent JBSNF-000088 inhibition (7 days) of the nicotinamide N-methyltransferase (methylation sink) perturbs PFA cell survival in 1% O2. *p < 0.05 and **p < 0.01. Data are displayed as the mean ± SEM. Curves show logistic regression line of fit for E-G.
Figure 4 –
Figure 4 –. Hypoxia maintains histone lysine demethylase activity by increasing αKG abundance via glutamine catabolism in PFA ependymoma
A) Snapshot of relative metabolite abundance of Krebs cycle intermediates in PFA (n=15) versus ST-EPN (n=4) surgical biopsies. Significantly differentially abundant metabolites characterized by t-test with FDR correction (q-value < 0.05). B) PFA cells growing in 1% O2, exhibit significantly increased ratio of αKG/Succinate in PFA cells. Statistical comparison was performed using ratio paired t-test. C) Histone lysine 27 demethylase gene expression is not differentially regulated by oxygen tension in PFA cells. Statistical comparison was performed using Wald test with Benjamini-Hochberg adjustment. D) Cartoon depicting glutamine tracing in PFA cells growing in 1% O2. Labelled glutamine was used as the carbon source (13C5 light blue; unlabeled carbon dark blue). PFA cells preferentially undergo glutaminolysis and reductive carboxylation. E) Labelled glutamine tracing of PFA cells reveals an elevated αKG:succinate ratio in 1% compared to 21% O2. Statistical analysis performed using two-tailed t-test with HolmSidak correction. F) Cartoon depicting the roles of αKG and the KDMs in histone demethylation. Drugs which inhibit lysine 27 demethylase activity and their targets are in red, while exogenous αKG, which increases activity is in green. G) Dose response of GSK-J4 inhibition (7 days) of KDM6A and KDM6B perturbs PFA cell survival in 1% O2. H) Dose response of CB-839 inhibition (7 days) of GLS perturbs PFA cell survival in 1% O2. I) Supplementing exogenous cell permeable dimethyl αKG rescues the growth defect of PFA cells cultured in 21% O2. J) Supplementing exogenous cell permeable dimethyl αKG rescues PFA cell survival while under CB-839 inhibition in 1% O2. *p < 0.05, **p < 0.01 and ****p < 0.0001. Data are displayed as the mean ± SEM. Curves show logistic regression line of fit for G-H.
Figure 5 –
Figure 5 –. Hypoxia drives reverse TCA cycle activity to increase histone K27 acetylation in PFA ependymoma
A) Relative metabolite abundance of Krebs cycle and glycolysis intermediates in PFA (n=15) versus ST-EPN (n=4) surgical biopsies. Significantly differentially abundant metabolites characterized by t-test with FDR correction (q-value < 0.05). B) The αKG:citrate ratio is significantly lower in PFA cells in 21% versus 1% oxygen, which is not mirrored in fNSCs. Statistical comparison was performed using ratio paired t-test. C) Expression of lysine acetyltransferase components CREBBP and p300 is not influenced by oxygen tension in PFA cells. Statistical comparison was performed using Wald test with Benjamini-Hochberg adjustment. D) Cartoon depicting glutamine tracing in PFA cells growing in 1% O2. Labelled glutamine was used as the carbon source (13C5 light blue; unlabeled carbon dark blue). PFA cells preferentially undergo glutaminolysis and reductive carboxylation. E) Labelled glutamine tracing of PFA cells demonstrates an increased aKG:citrate ratio, a marker of reductive carboxylation, in 1% O2. Statistical analysis performed using twotailed t-test with Holm-Sidak correction. F) Cartoon depicting the roles of acetate and lysine 27 acetyltransferases in histone acetylation. Drugs and which inhibit lysine 27 acetyltransferase activity and their targets are in red, while exogenous acetate, which increases activity is in green. G) Dose-dependent selective inhibition (7 days) of CREBBP/P300 by A485 diminishes PFA cell survival at 1% O2. H) BMS-303141 (50μM) inhibition (7 days) of ACLY diminishes PFA cell survival in 1% O2. Statistical analysis was performed by t-test with Welch correction. I) Addition of exogenous acetate (200μM and 2mM) rescues BMS-303141 inhibition of ACLY in PFA cells in 1% O2. J) Addition of exogenous acetate (200μM and 2mM) rescues CB-839 inhibition of GLS in PFA cells in 1% O2. ****p < 0.0001. Data are displayed as the mean ± SEM. Curves show logistic regression line of fit for G,I,J.
Figure 6 –
Figure 6 –. Paradoxically, inhibition of the PRC2 complex also shows activity against PFA ependymoma.
A) Pathway analysis of significantly essential genes by genome-wide CRISPR knockout essentiality screen in PFA cells compared to GBM cells (z-score, p-value < 0.05). The top 10 hits ranked by average difference of quantile normalized Bayes Factor between PFA and GBM screens are listed. Genes associated with the PRC2 complex are denoted in red. B) Cartoon depicting several mechanisms of K27 modification active in PFA ependymoma. Targeted inhibition of MAT2A by PF9366 and the PRC2 complex components EED and EZH2 by A395 and UNC1999 respectively are depicted. C) Dose-dependent inhibition (7 days) of MAT2A by PF9366 inhibits SAM production, resulting in diminished PFA cell survival, while simultaneously augmenting iNHA control cell survival in 1% O2. ST, DIPG and fNSC control lines showed no effect upon treatment. D) Dose-dependent inhibition (7 days) of EED by A395 diminishes PFA cell survival in 1% O2. An inactive analog of the A395 probe (dashed) did not affect PFA cell survival. ST, DIPG and fNSC control lines showed no effect upon treatment. E) Dose-dependent inhibition (10 days) of EZH2 by UNC1999 diminishes PFA cell survival in 1% O2. ST, DIPG and fNSC control lines showed no effect upon treatment. Curves show logistic regression line of fit for C-E.
Figure 7 –
Figure 7 –. The normal glial lineage of origin of PFA in the hindbrain displays early hypoxia during normal development.
A) Relative frequency of gliogenic progenitors and roof-plate like stem cells across several embryonic timepoints. Frequency is calculated as number of cells of that type at each timepoint, relative to total number of cells of that type across all timepoints. B) Violin plot of the signature score for hypoxia genes across the embryonic timepoints. Hypoxia signature set based on 15 genes (Aldoa, Aldoc, Bnip3, Bnip3l, Car9, Ddit4, Gpi1, Ldha, P4ha1, P4ha2, Pdk1, Pgk1, Tpi1, Vegfa, Zfp395). Set scale from −1 to 1. C) Gene set enrichment analysis of mouse cerebellar gliogenic progenitors across four developmental timepoints, generated from scRNAseq. Cytoscape maps generated using q < 0.15, P < 0.05. D) Heatmap of PFA enriched metabolites demonstrates a higher correlation to E16.5 compared to P2 embryonic timepoints. A total of 19 significantly enriched metabolites in PFA ependymoma tissue (FDR < 0.05, foldchange > 0) were assessed in mouse hindbrain tissue isolated from at E16.5 and P2 embryonic timepoints. Normalized metabolite abundance was plotted with a set scale of 3 to −3. Annotations of metabolic KEGG pathway are indicated for reference.

Comment in

References

    1. Aldape K, Brindle KM, Chesler L, Chopra R, Gajjar A, Gilbert MR, Gottardo N, Gutmann DH, Hargrave D, Holland EC, et al. (2019). Challenges to curing primary brain tumours. Nat Rev Clin Oncol 16, 509–520. - PMC - PubMed
    1. Amemiya HM, Kundaje A, and Boyle AP (2019). The ENCODE Blacklist: Identification of Problematic Regions of the Genome. Sci Rep 9, 9354–9355. - PMC - PubMed
    1. Andrews S. (2010). FastQC: a quality control tool for high throughput sequence data.
    1. Badur MG, Muthusamy T, Parker SJ, Ma S, McBrayer SK, Cordes T, Magana JH, Guan K-L, and Metallo CM (2018). Oncogenic R132 IDH1 Mutations Limit NADPH for De Novo Lipogenesis through (D)2-Hydroxyglutarate Production in Fibrosarcoma Sells. Cell Rep 25, 1018–1026.e4. - PMC - PubMed
    1. Beringer M, Pisano P, Di Carlo V, Blanco E, Chammas P, Vizán P, Gutiérrez A, Aranda S, Payer B, Wierer M, et al. (2016). EPOP Functionally Links Elongin and Polycomb in Pluripotent Stem Cells. Mol. Cell 64, 645–658. - PubMed

Publication types

MeSH terms