

Clinical testing for COVID-19
- PMID: 32445839
- PMCID: PMC7237919
- DOI: 10.1016/j.jaci.2020.05.012
Clinical testing for COVID-19
Abstract
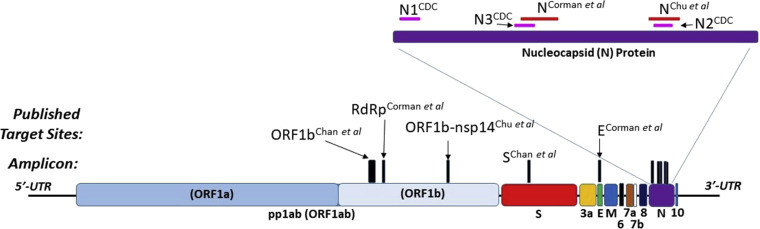
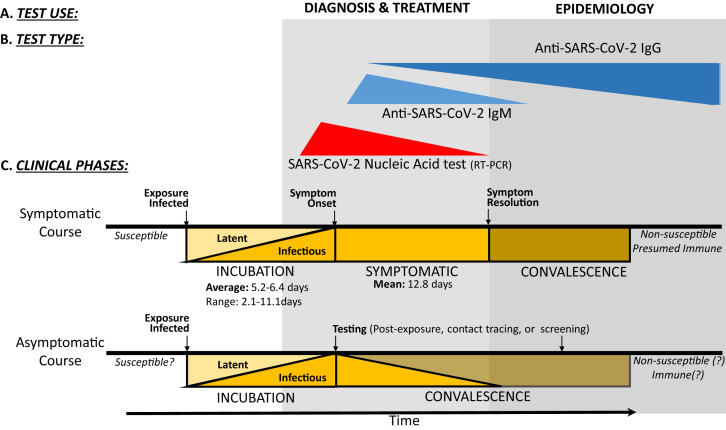
As the novel coronavirus severe acute respiratory syndrome coronavirus 2 caused coronavirus disease 2019 cases in the United States, the initial test was developed and performed at the Centers for Disease Control and Prevention. As the number of cases increased, the demand for tests multiplied, leading the Centers for Disease Control and Prevention to use the Emergency Utilization Authorization to allow clinical and commercial laboratories to develop tests to detect the presence of the virus. Many nucleic acid tests based on RT-PCR were developed, each with different techniques, specifications, and turnaround time. As the illnesses turned into a pandemic, testing became more crucial. The test supply became inadequate to meet the need and so it had to be prioritized according to guidance. For surveillance, the need for serologic tests emerged. Here, we review the timeline of test development, the turnaround times, and the various approved tests, and compare them as regards the genes they detect. We concentrate on the point-of-care tests and discuss the basis for new serologic tests. We discuss the testing guidance for prioritization and their application in a hospital setting.
Keywords: COVID-19; Centers for Disease Control and Prevention; E protein; Food and Drug Administration; M protein; N protein; RT-PCR; S protein; SARS-CoV-2; World Health Organization; coronavirus; guidance; nucleic acid test; point-of-care; prioritization; serologic test; test; viral genes.
Published by Elsevier Inc.
Figures
References
-
- Food and Drug Administration https://www.fda.gov/media/135659/download Available at:
-
- Food and Drug Administration https://www.fda.gov/medical-devices/emergency-situations-medical-devices... Available at:
-
- Brady P.W., Tchou M.J., Ambroggio L., Schondelmeyer A.C., Shaughnessy E.E. Quality improvement feature series article 2: displaying and analyzing quality improvement data. J Pediatric Infect Dis Soc. 2018;7:100–103. - PubMed
-
- Food and Drug Administration https://www.fda.gov/news-events/press-announcements/coronavirus-covid-19... Available at:
Publication types
MeSH terms
Substances
LinkOut - more resources
Full Text Sources
Other Literature Sources
Medical
Research Materials
Miscellaneous
