

COVID-19 identification in chest X-ray images on flat and hierarchical classification scenarios
- PMID: 32446037
- PMCID: PMC7207172
- DOI: 10.1016/j.cmpb.2020.105532
COVID-19 identification in chest X-ray images on flat and hierarchical classification scenarios
Abstract
Background and objective: The COVID-19 can cause severe pneumonia and is estimated to have a high impact on the healthcare system. Early diagnosis is crucial for correct treatment in order to possibly reduce the stress in the healthcare system. The standard image diagnosis tests for pneumonia are chest X-ray (CXR) and computed tomography (CT) scan. Although CT scan is the gold standard, CXR are still useful because it is cheaper, faster and more widespread. This study aims to identify pneumonia caused by COVID-19 from other types and also healthy lungs using only CXR images.
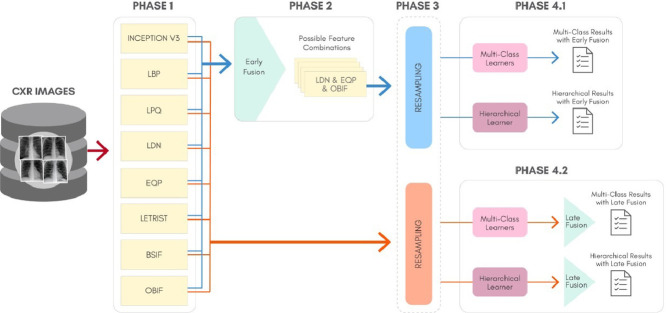
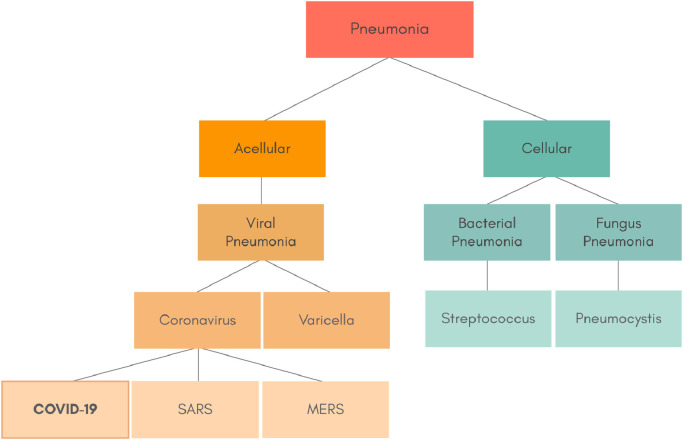
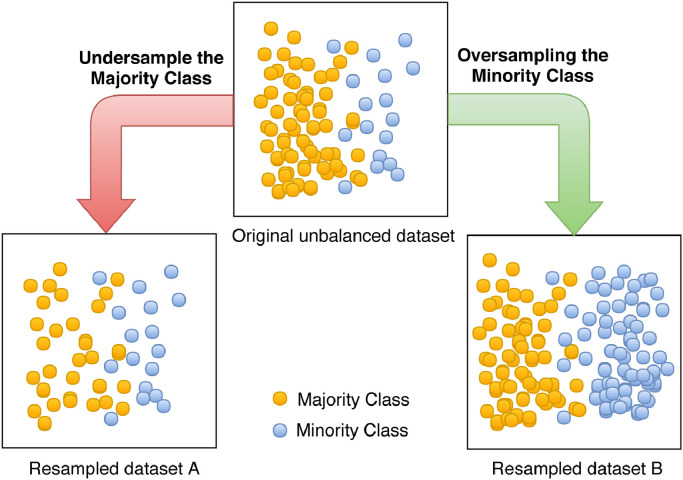
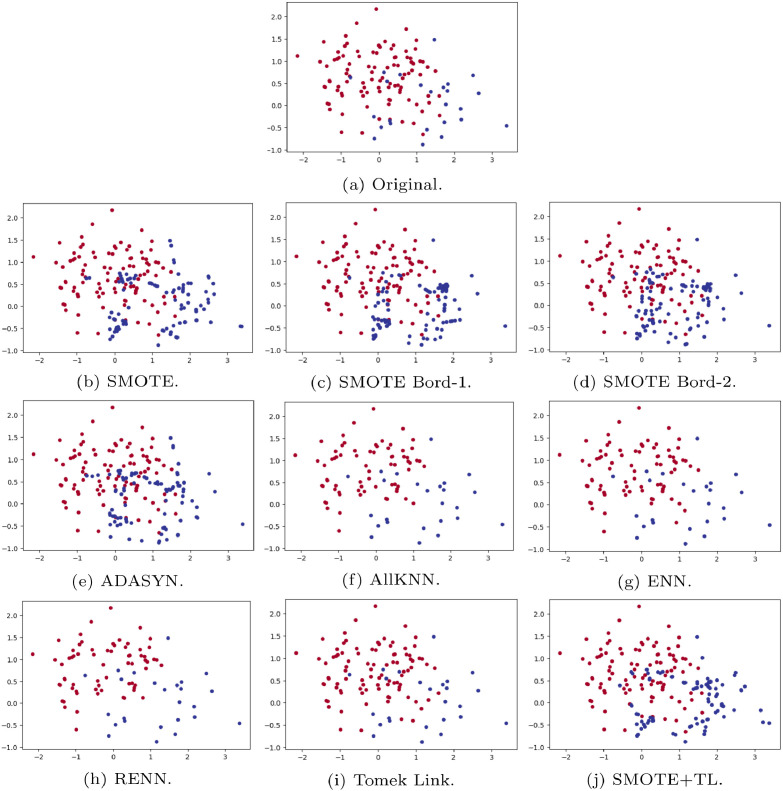
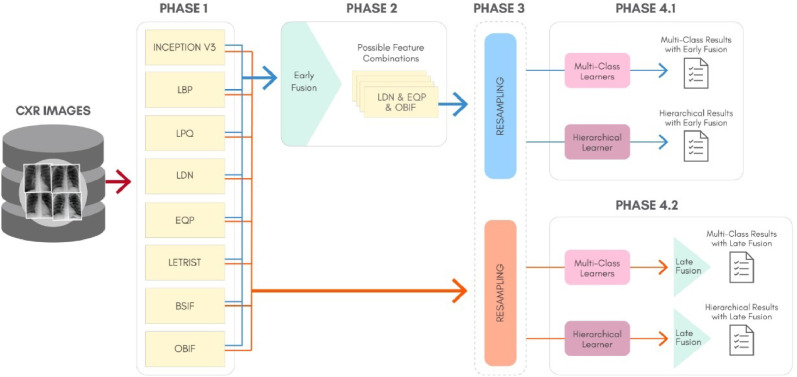
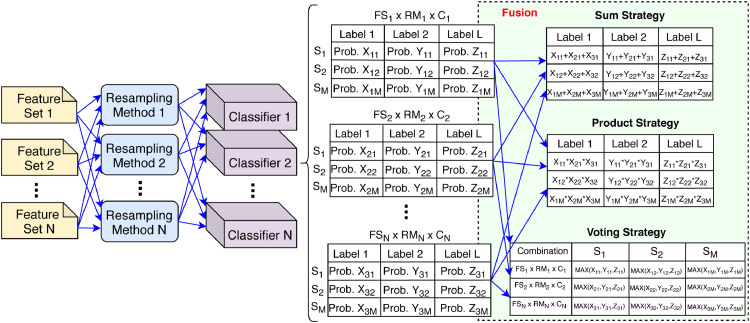
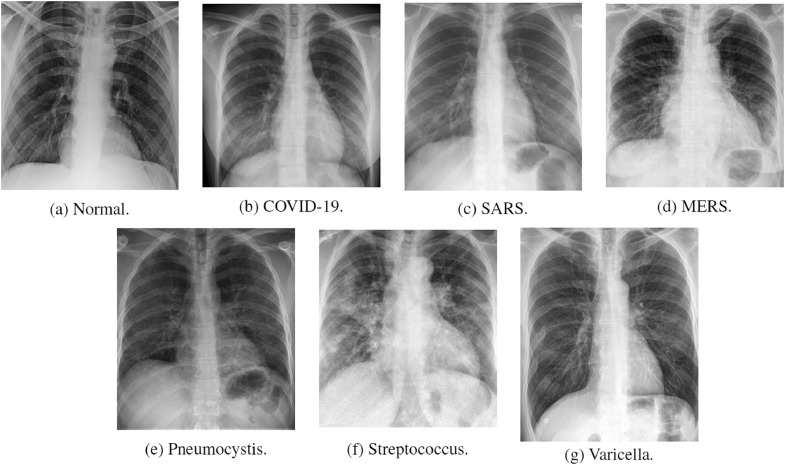
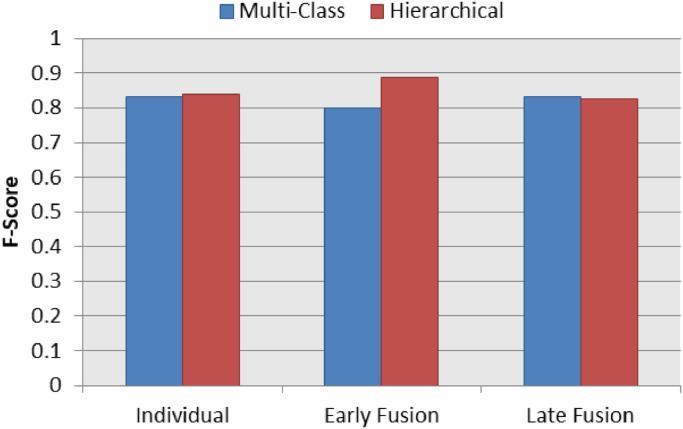
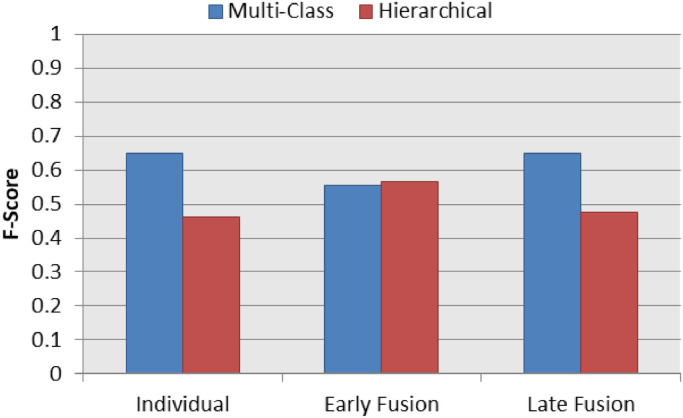
Methods: In order to achieve the objectives, we have proposed a classification schema considering the following perspectives: i) a multi-class classification; ii) hierarchical classification, since pneumonia can be structured as a hierarchy. Given the natural data imbalance in this domain, we also proposed the use of resampling algorithms in the schema in order to re-balance the classes distribution. We observed that, texture is one of the main visual attributes of CXR images, our classification schema extract features using some well-known texture descriptors and also using a pre-trained CNN model. We also explored early and late fusion techniques in the schema in order to leverage the strength of multiple texture descriptors and base classifiers at once. To evaluate the approach, we composed a database, named RYDLS-20, containing CXR images of pneumonia caused by different pathogens as well as CXR images of healthy lungs. The classes distribution follows a real-world scenario in which some pathogens are more common than others.
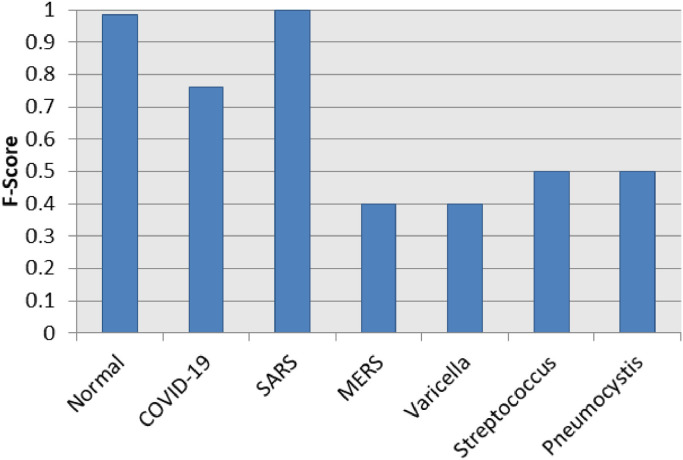
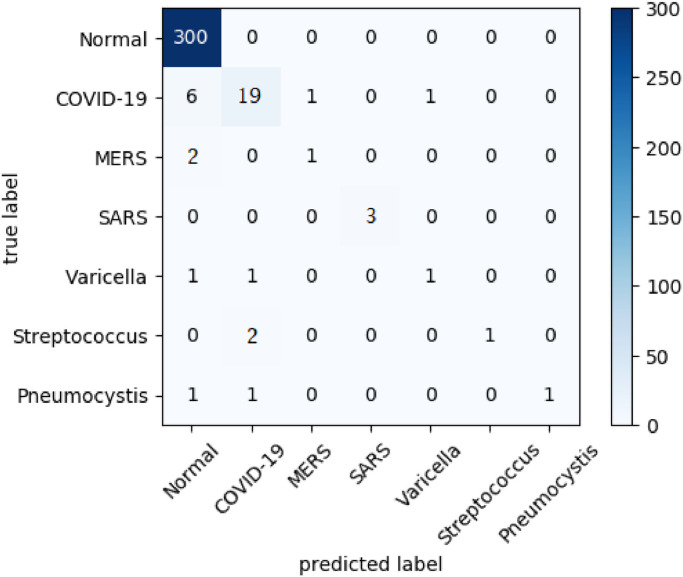
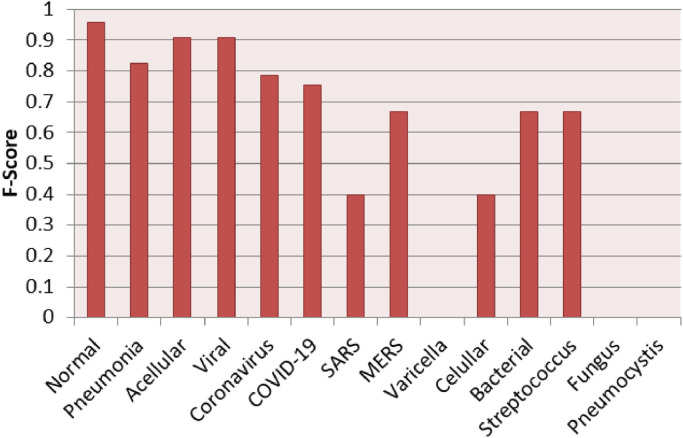
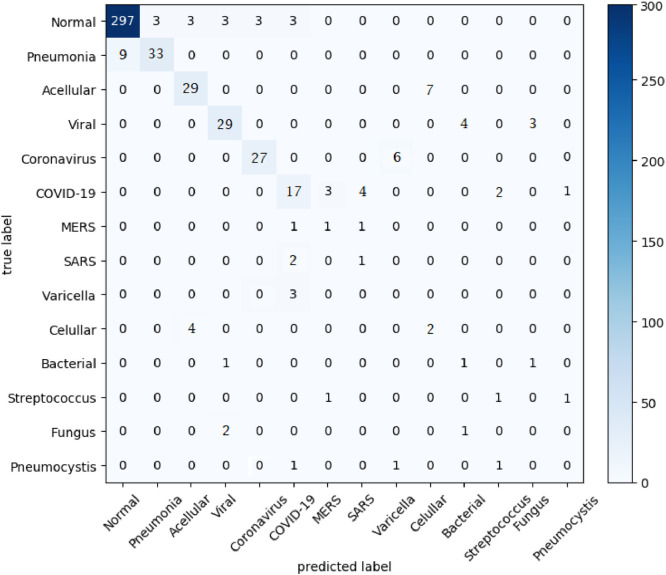
Results: The proposed approach tested in RYDLS-20 achieved a macro-avg F1-Score of 0.65 using a multi-class approach and a F1-Score of 0.89 for the COVID-19 identification in the hierarchical classification scenario.
Conclusions: As far as we know, the top identification rate obtained in this paper is the best nominal rate obtained for COVID-19 identification in an unbalanced environment with more than three classes. We must also highlight the novel proposed hierarchical classification approach for this task, which considers the types of pneumonia caused by the different pathogens and lead us to the best COVID-19 recognition rate obtained here.
Keywords: COVID-19; Chest X-ray; Medical image analysis; Pneumonia; Texture.
Copyright © 2020 Elsevier B.V. All rights reserved.
Conflict of interest statement
Declaration of Competing Interest The authors declare that they have no known competing financial interests or personal relationships that could have appeared to influence the work reported in this paper.
Figures
References
-
- Organization W.H. Situation Report 72. 2020. Coronavirus Disease 2019 (COVID-19)
-
- Musher D.M., Thorner A.R. Community-acquired pneumonia. N. Engl. J. Med. 2014;371(17):1619–1628. - PubMed
-
- Grasselli G., Pesenti A., Cecconi M. Critical care utilization for the COVID-19 outbreak in lombardy, italy: early experience and forecast during an emergency response. JAMA. 2020 - PubMed
MeSH terms
LinkOut - more resources
Full Text Sources
Other Literature Sources
Research Materials
