. 2020 Jun 18;78(6):1114-1132.e10.
doi: 10.1016/j.molcel.2020.04.034. Epub 2020 May 23.

Opposing Functions of BRD4 Isoforms in Breast Cancer

Affiliations

Opposing Functions of BRD4 Isoforms in Breast Cancer

Shwu-Yuan Wu et al. Mol Cell. .

Abstract

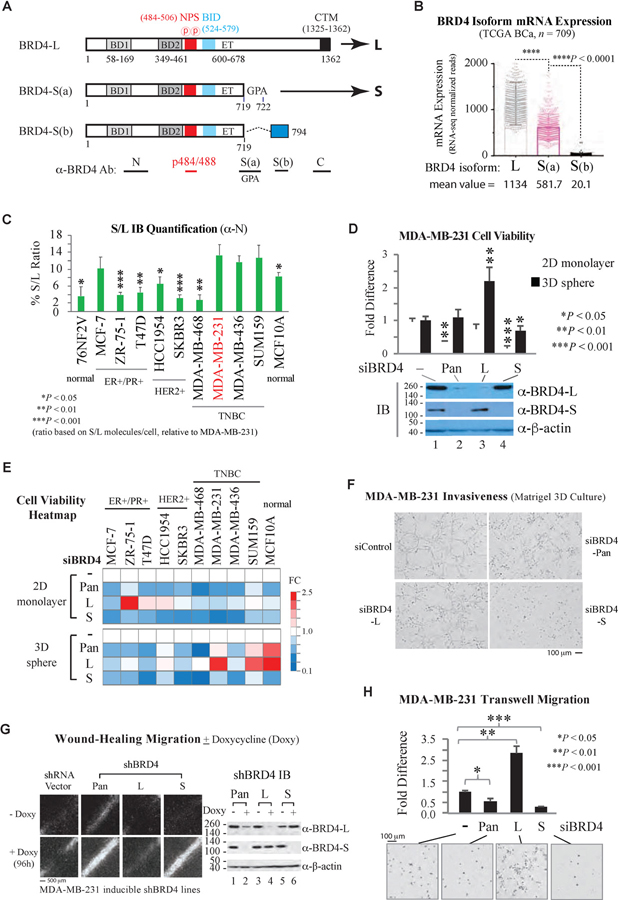
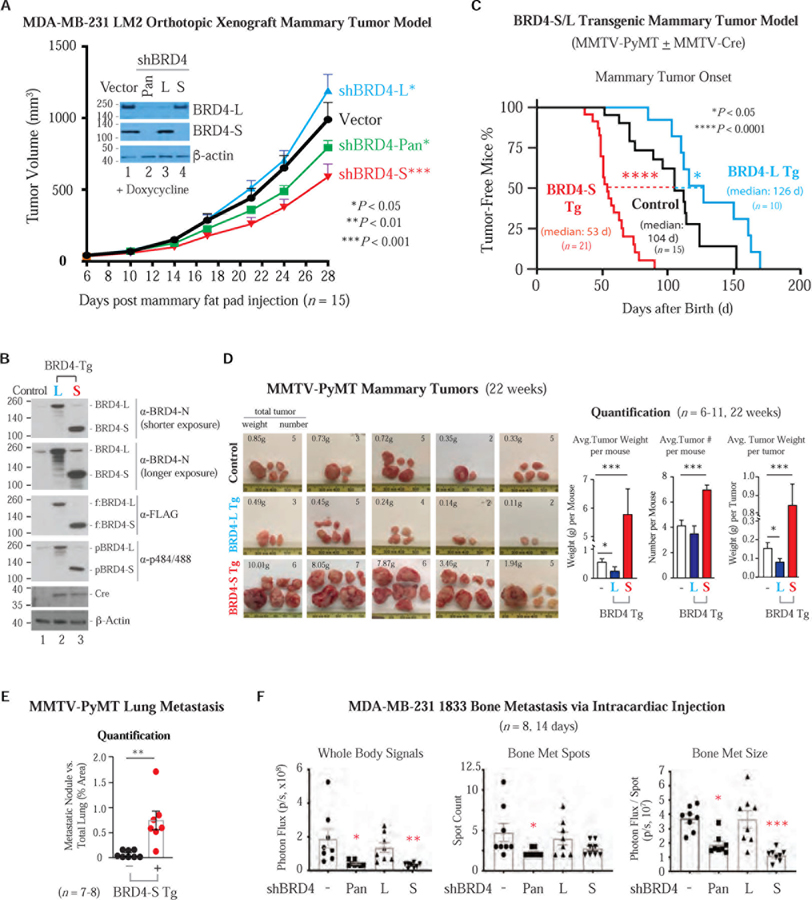
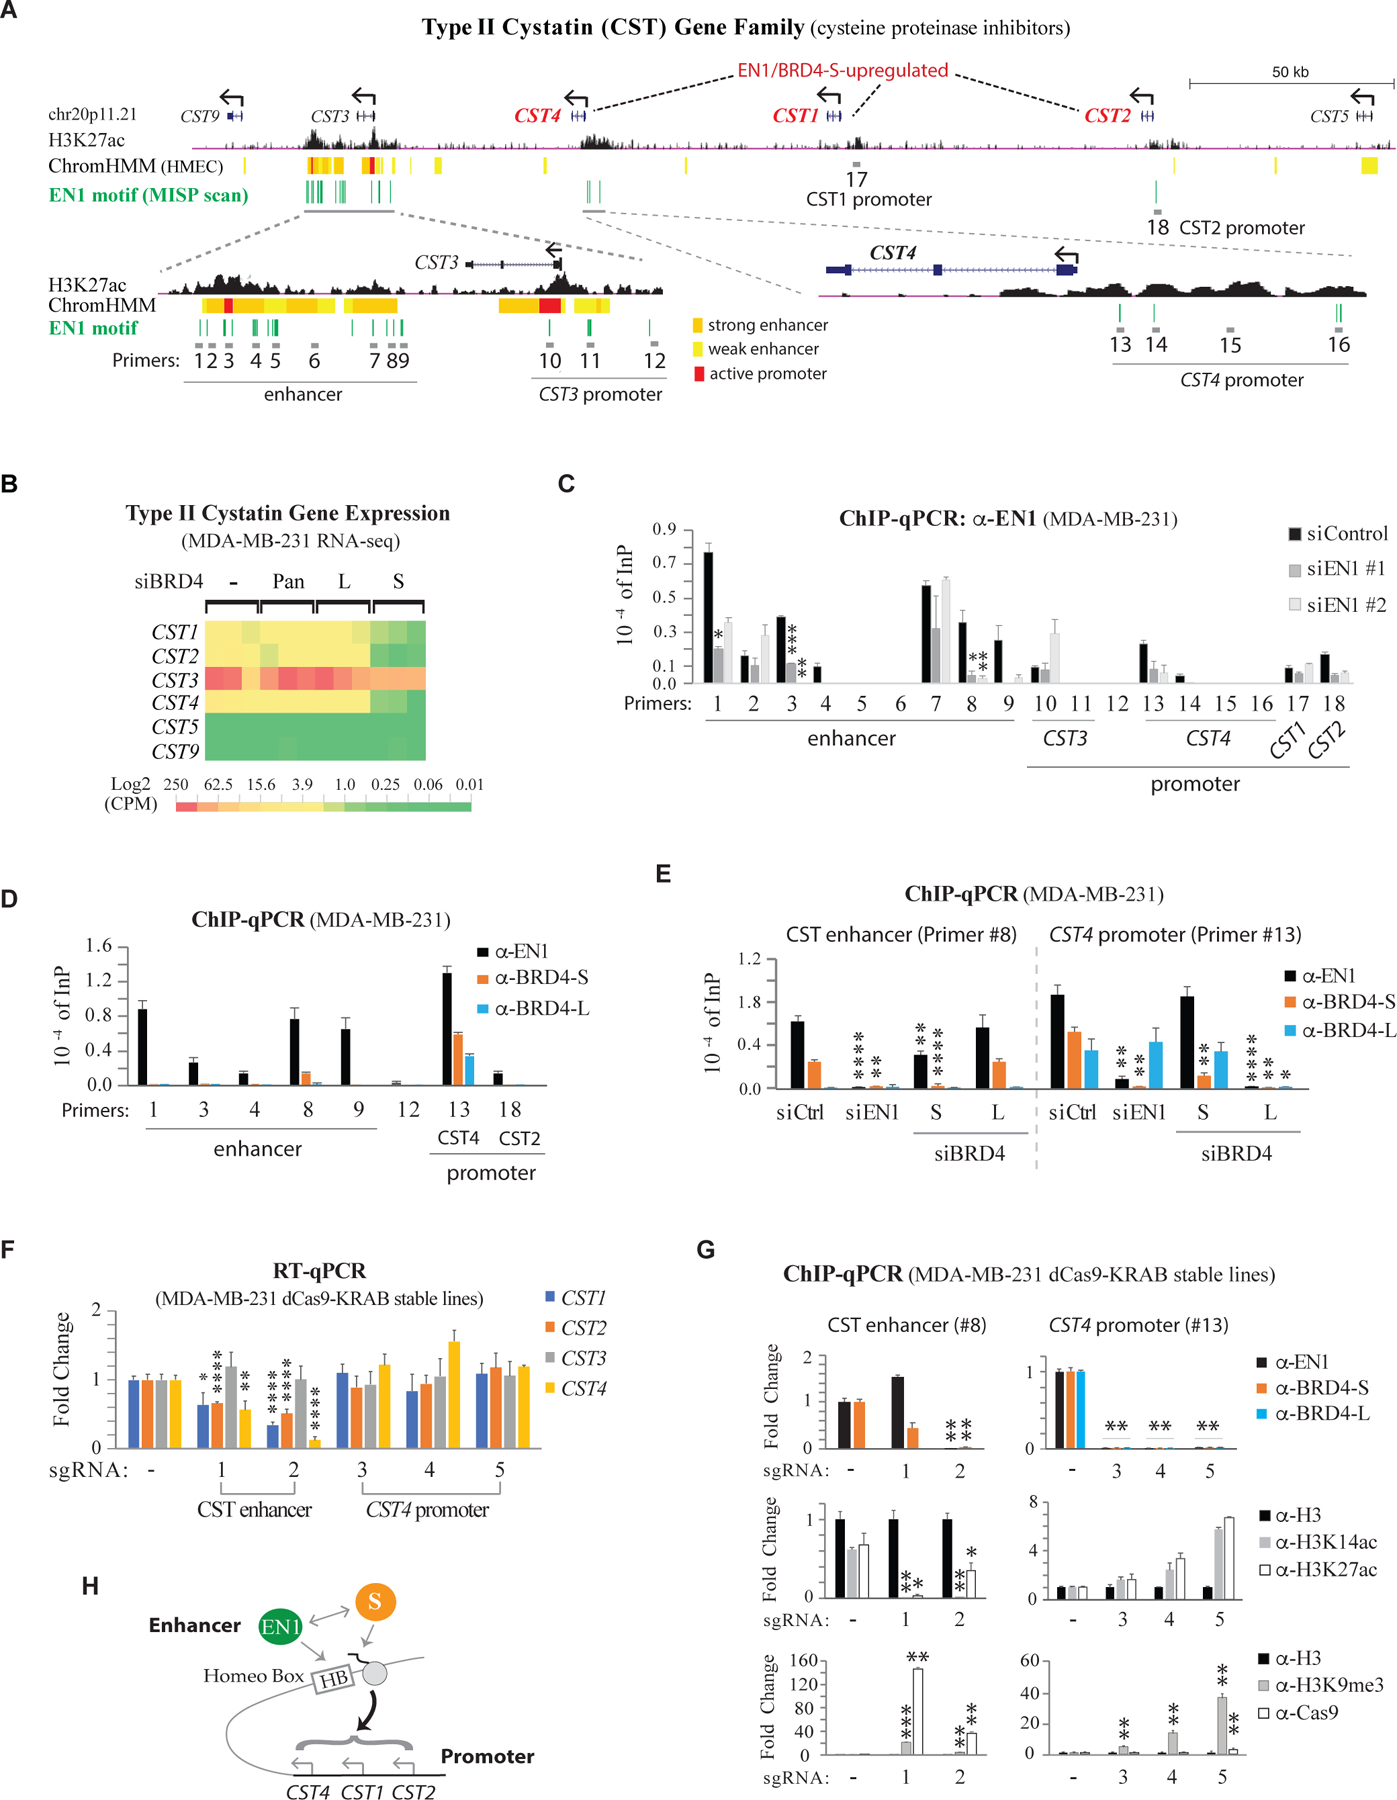
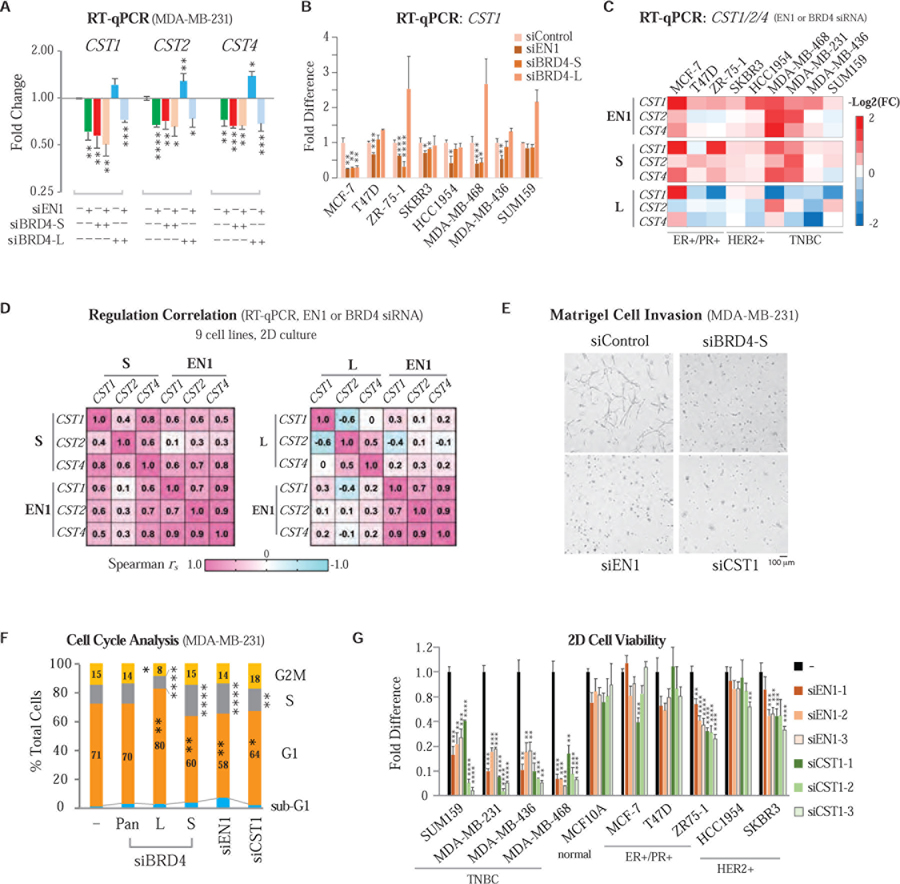
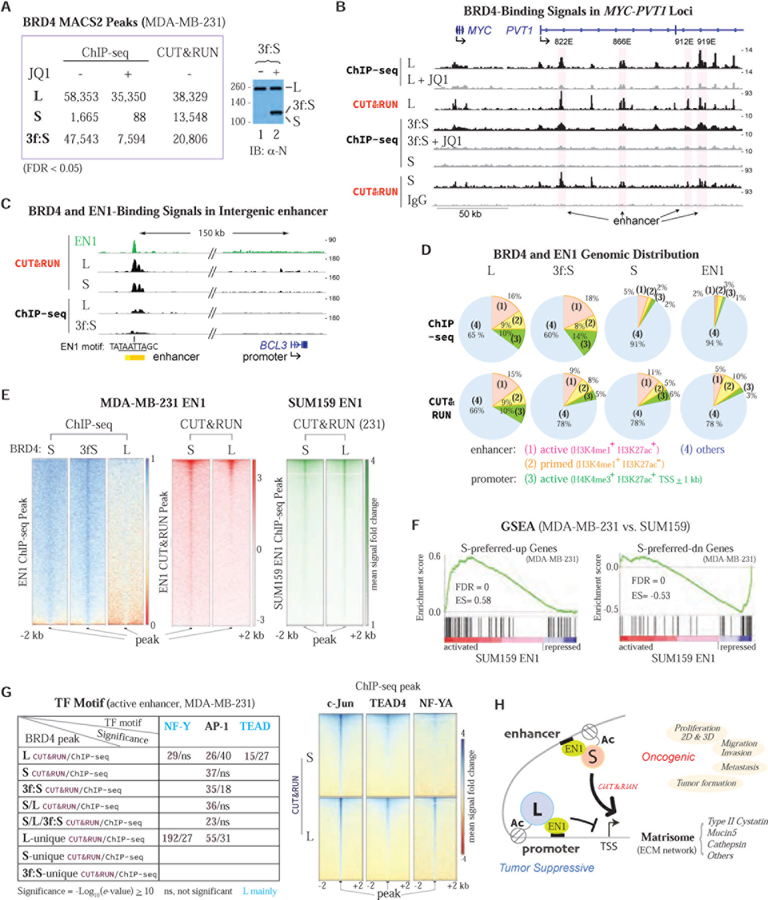
Bromodomain-containing protein 4 (BRD4) is a cancer therapeutic target in ongoing clinical trials disrupting primarily BRD4-regulated transcription programs. The role of BRD4 in cancer has been attributed mainly to the abundant long isoform (BRD4-L). Here we show, by isoform-specific knockdown and endogenous protein detection, along with transgene expression, the less abundant BRD4 short isoform (BRD4-S) is oncogenic while BRD4-L is tumor-suppressive in breast cancer cell proliferation and migration, as well as mammary tumor formation and metastasis. Through integrated RNA-seq, genome-wide ChIP-seq, and CUT&RUN association profiling, we identify the Engrailed-1 (EN1) homeobox transcription factor as a key BRD4-S coregulator, particularly in triple-negative breast cancer. BRD4-S and EN1 comodulate the extracellular matrix (ECM)-associated matrisome network, including type II cystatin gene cluster, mucin 5, and cathepsin loci, via enhancer regulation of cancer-associated genes and pathways. Our work highlights the importance of targeted therapies for the oncogenic, but not tumor-suppressive, activity of BRD4.

Keywords: BET inhibitor; BRD4; CUT&RUN; ECM; TNBC; bromodomain; drug resistance; enhancer; epigenetics; transcription factor.


Conflict of interest statement

Declaration of Interests The authors declare no competing interests.

Figures

Figure 1.
Figure 1.. Opposing Functions of BRD4 Isoforms in Breast Cancer Cell Proliferation and Migration
(A) Schematic of BRD4 domain features and antibody-targeting regions for a long (L) and two short isoforms S(a) and S(b). BRD4-S(a) is subsequently abbreviated as BRD4-S. (B) BRD4 isoform mRNA levels in breast cancer (BCa) patients derived from RNA-seq-normalized reads (TCGA BCa) multiplying isoform PSI (TCGA SpliceSeq). Data are mean ± s.e.m. (standard error of the mean). P, two-way ANOVA. (C) Ratio (S/L) of cellular BRD4-S and BRD4-L molecules quantified by immunoblotting (IB) with ⍺-BRD4 N antibody. Data are mean ± s.e.m. P, two-tailed t-test. (D) MDA-MB-231 cell viability in monolayer (2D) and low-attachment sphere (3D) cultures following BRD4 pan, isoform, or control (-) siRNA knockdown. Data are mean ± s.d. (standard deviation). P, two-tailed t-test (relative to siControl). (E) Heatmap summarizing cell viability fold change (FC) of BRD4 isoform knockdown in 10 cell lines. (F) Representative images of invasion assay upon BRD4 isoform knockdown. (G) Representative images of wound-healing assay performed in doxycycline (doxy)-inducible shBRD4 stable lines. (H) Serum-induced Transwell migration assay. Data are mean ± s.e.m. Images are representative of at least three biological replicates. Significance: *P < 0.05, **P < 0.01, ***P < 0.001, ****P < 0.0001
Figure 2.
Figure 2.. BRD4-S Enhances Mammary Tumor Growth and Metastasis While BRD4-L Suppresses Mainly Tumor Growth
(A) Orthotopic mammary tumor growth of MDA-MB-231 LM2 cells expressing doxy-inducible BRD4 shRNA or vector. IB shows the extent of BRD4 knockdown prior to mammary fat pad injection. Data are mean ± s.e.m. P, two-way ANOVA. (B) IB shows Cre-induced FLAG-tagged BRD4-S/L transgene (Tg) expression in MMTV-PyMT mammary tumors. Control, no Cre. (C) Percentage of tumor-free mice with palpable mammary tumor onset in immunocompetent syngeneic mice expressing BRD4 Tg isoforms and in control mice without MMTV-Cre expression. P, Log-rank (Mantel-Cox) test. (D) PyMT tumor images (left) and quantification of average tumor weight/number (right). Data are mean ± s.e.m. P, two-tailed t-test. (E) Quantification of lung metastatic nodules from female mice bearing PyMT tumors with or without (control) BRD4-S Tg. Data are mean ± s.e.m. P, two-tailed t-test. (F) BLI quantification of bone metastasis from MDA-MB-231-derived 1833 lines harboring doxy-induced BRD4 pan or isoform shRNA. Bone metastatic size is signal intensity per spot. Data are mean ± s.e.m. P, two-way ANOVA.
Figure 3.
Figure 3.. Transcriptome Profiling Identifies Matrisome Network Genes Generally Upregulated by BRD4-S but Downregulated by BRD4-L
(A) RNA-seq flowchart and DEG classification. RNA-seq data were from MDA-MB-231 with or without BRD4 isoform-specific knockdown. (B) Top canonical pathways identified for BRD4-S/L DEGs highlighting S-unique-upregulated matrisome network (red) and L-preferred-downregulated core ECM (blue). (C) Heatmap of top DEGs from MDA-MB-231 RNA-seq divided into up and downregulated (Dn) groups, each in triplicate. Scale bar is based on the Z score of CPM (counts per million). (D) List of BRD4-S-upregulated matrisome genes with significantly higher expression in IDC vs. normal breast samples (P values from Oncomine METABRIC 2136 BCa dataset). (E) Unique gene families identified in BRD4-S-upregulated RNA-seq from MDA-MB-231. (F) Kaplan-Meier plot showing higher expression of a 17-matrisome-gene signature identified in S-Up predicts unfavorable DMFS in basal subtype patients. The 17 DEGs analyzed are indicated.
Figure 4.
Figure 4.. EN1 functions similarly to BRD4-S in Upregulating Matrisome Gene Expression and Interacts Preferentially with BRD4-S in MDA-MB-231 Cells
(A) 70 TF motifs identified from H3K27ac-enriched and IDC-associated BRD4-S-upregulated type II cystatin gene cluster and CTSW/MUC5 loci by MISP (Cistrome). (B) Heatmap of 73 TF expression profiles classified according to PAM50 subtypes. Heatmap scale represents mRNA mean. Asterisks (*) mark the three TFs not enriched in IDC used as controls. (C) Sequence logos for EN1 (MA0027.2) and EN2 (MA0642.1). (D) RT-qPCR analysis of TF RNA. Data are mean ± s.d. P, two-tailed t-test. (E) Knockdown of EN1 reduces S-Up CST1/2/4, MUC5AC/B and CTSW/Z RNAs as seen with BRD4-S knockdown. Data are mean ± s.d. P, two-tailed t-test. (F) BRD4-S upregulates, while BRD4-L downregulates, matrisome gene expression in 3D culture. Data are mean ± s.d. P, two-tailed t-test. (G) IP-IB showing EN1 preferentially interacts with BRD4-S in MDA-MB-231. (H) EN1 interacts with both BRD4 isoforms better than EN2 using purified FLAG-tagged (f:) proteins as indicated. (I) EN1 binds both BRD4 isoforms in SUM159 and MDA-MB-468. IP was similarly performed as in (G).
Figure 5.
Figure 5.. EN1 Recruits BRD4-S to Type II Cystatin Enhancer Critical for CST1/2/4 Cluster Gene Transcription
(A) Diagram of type II cystatin gene family (CST9/3/4/1/2/5) with H3K27ac ChIP-seq track (MDA-MB-231, GSE85158) and its associated enhancers/promoters identified by ChromHMM in human mammary epithelial cells (HMEC). Primer pairs (#1–18) for qPCR are indicated. Green line, predicted EN1-binding sites. (B) Heatmap showing RNA levels of type II cystatin gene family from MDA-MB-231 RNA-seq. (C) ChIP-qPCR of EN1 binding to 18 genomic regions in type II cystatin gene locus. Data are mean ± s.d. P, two-tailed t-test. (D) ChIP-qPCR of BRD4 isoform occupancy in EN1-binding regions. Data are mean ± s.d. (E) ChIP-qPCR of BRD4 isoform and EN1 binding to CST enhancer (#8 primer pair) and CST4 promoter (#13 primer pair). Data are mean ± s.d. P, two-tailed t-test. (F) RT-qPCR of CST1/2/3/4 gene expression following sgRNA targeting in MDA-MB-231 expressing dCas9-KRAB repressor. Data are mean ± s.d. P, two-tailed t-test. (G) ChIP-qPCR of EN1, BRD4-S, BRD4-L, histone marks, and dCas9-KRAB association. Data are mean ± s.d. P, two-tailed t-test. (H) Model for BRD4-S/EN1-coregulated CST gene cluster.
Figure 6.
Figure 6.. Knockdown of EN1 or CST1 Suppresses TNBC Cell Proliferation, Invasion and Cell Cycle Progression as Seen with BRD4-S Knockdown
(A) RT-qPCR showing dual knockdown of EN1 and BRD4-S reduces CST1/2/4 expression comparable to individual knockdown. Data are mean ± s.d. P, two-tailed t-test. (B) RT-qPCR of CST1 expression upon EN1 and BRD4 isoform knockdown in eight BCa cell lines. Fold difference is mean ± s.e.m. P, two-tailed t-test. (C) Heatmap of CST1/2/4 expression following EN1, BRD4-S or BRD4-L knockdown in nine BCa cell lines. (D) Spearman’s coefficient (rs) showing BRD4-S exhibiting positive and better correlation than BRD4-L for EN1-regulated CST1/2/4 gene expression collectively measured in nine BCa lines as analyzed in (C). (E) Representative images of MDA-MB-231 cell invasion analyzed in 3D Matrigel culture upon BRD4-S, EN1 or CST1 knockdown. (F) Cell cycle profiles of MDA-MB-231 following target-specific or control siRNA knockdown. P, two-tailed t-test. (G) Cell viability of 10 cell lines in 2D culture with or without EN1 or CST1 knockdown. Data are mean ± s.e.m. P, two-tailed t-test.
Figure 7.
Figure 7.. Genome-wide Association of BRD4-S and EN1 by ChIP-seq and CUT&RUN
(A) MACS2 peak numbers and IB showing BRD4-S protein level in MDA-MB-231 expressing 3xFLAG-tagged BRD4-S (3f:S). (B) BRD4 binding in PVT1 intragenic enhancers (822E, 866E, 912E, and 919E). Signals in ChIP-seq tracks represent fold changes, relative to input, +/- JQ1 treatment. Spike-in-normalized signals are used in CUT&RUN tracks. (C) EN1 and BRD4 co-occupy distal enhancer of BCL3, a BRD4-S-unique-up (MDA-MB-231 RNA-seq) and EN1-coregulated gene (SUM159 RNA-seq). The enhancer block (yellow) is from ENCODE HMEC chromHMM with EN1 motif sequence indicated. (D) BRD4-L, BRD4-S, 3f:S, and EN1 peak distributions in active enhancer, primed enhancer, active promoter, and others. (E) Heatmaps of BRD4 signals associated with EN1 peaks. SUM159 V5-tagged EN1 peaks are from GSE120957. (F) GSEA showing S-preferred DEGs from MDA-MB-231 RNA-seq are significantly enriched in EN1 DEGs from SUM159 RNA-seq (GSE120957). (G) Table listing TF motifs identified in enhancer-associated BRD4 peaks and heatmap showing BRD4 CUT&RUN signals associated with ChIP-seq c-Jun and TEAD4 peaks from MDA-MB-231 (GSE66081) and NF-YA peaks from K562 (ENCODE). (H) Model for BRD4-S/EN1-coregulated enhancer modulating ECM matrisome gene expression.

Comment in

References

    1. Afgan E, Baker D, Batut B, van den Beek M, Bouvier D, Cech M, Chilton J, Clements D, Coraor N, Grüning BA, Guerler A, Hillman-Jackson J, Hiltemann S, Jalili V, Rasche H, Soranzo N, Goecks J, Taylor J, Nekrutenko A, and Blankenberg D (2018) The Galaxy platform for accessible, reproducible and collaborative biomedical analyses: 2018 update. Nucleic Acids Res 46, W537–W544. - PMC - PubMed
    1. Alsarraj J, Walker RC, Webster JD, Geiger TR, Crawford NP, Simpson RM, Ozato K, and Hunter KW (2011) Deletion of the proline-rich region of the murine metastasis susceptibility gene Brd4 promotes epithelial-to-mesenchymal transition- and stem cell-like conversion. Cancer Res 71, 3121–3131. - PMC - PubMed
    1. Aronesty E (2013) Comparison of sequencing utility programs. Open Bioinf. J 7, 1–8.
    1. Beltran AS, Graves LM, and Blancafort P (2014) Novel role of Engrailed 1 as a pro-survival transcription factor in basal-like breast cancer and engineering of interference peptides block its oncogenic function. Oncogene 33, 4767–4777. - PMC - PubMed
    1. Bobola N, and Merabet S (2017) Homeodomain proteins in action: similar DNA binding preferences, highly variable connectivity. Curr. Opin. Genet. Dev. 43, 1–8. - PubMed

Publication types

MeSH terms