

The signal peptide of Cry1Ia can improve the expression of eGFP or mCherry in Escherichia coli and Bacillus thuringiensis and enhance the host's fluorescent intensity
- PMID: 32448275
- PMCID: PMC7247199
- DOI: 10.1186/s12934-020-01371-8
The signal peptide of Cry1Ia can improve the expression of eGFP or mCherry in Escherichia coli and Bacillus thuringiensis and enhance the host's fluorescent intensity
Abstract
Background: The signal peptides (SPs) of secretory proteins are frequently used or modified to guide recombinant proteins outside the cytoplasm of prokaryotic cells. In the periplasmic space and extracellular environment, recombinant proteins are kept away from the intracellular proteases and often they can fold correctly and efficiently. Consequently, expression levels of the recombinant protein can be enhanced by the presence of a SP. However, little attention has been paid to the use of SPs with low translocation efficiency for recombinant protein production. In this paper, the function of the signal peptide of Bacillus thuringiensis (Bt) Cry1Ia toxin (Iasp), which is speculated to be a weak translocation signal, on regulation of protein expression was investigated using fluorescent proteins as reporters.
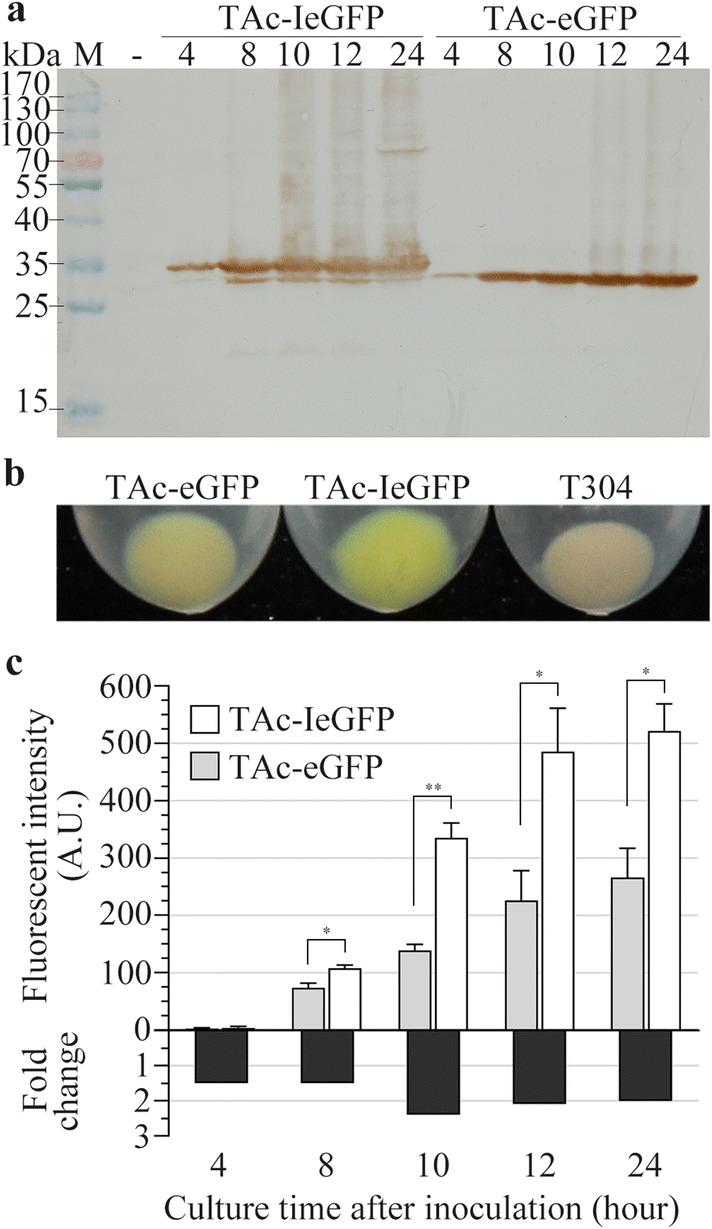
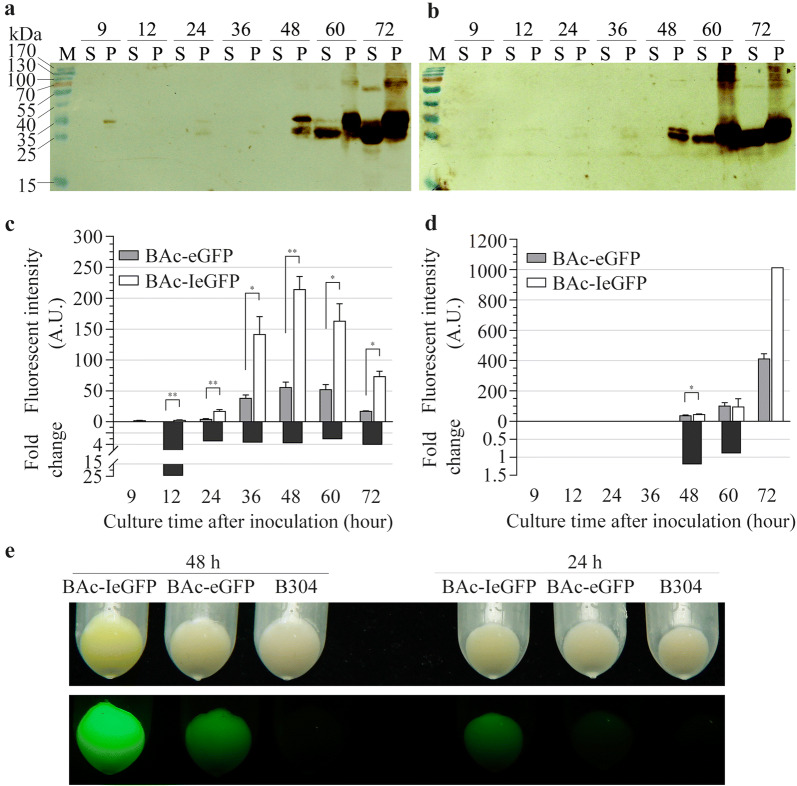
Results: When fused to the N-terminal of eGFP or mCherry, the Iasp can improve the expression of the fluorescent proteins and as a consequence enhance the fluorescent intensity of both Escherichia coli and Bt host cells. Real-time quantitative PCR analysis revealed the higher transcript levels of Iegfp over those of egfp gene in E. coli TG1 cells. By immunoblot analysis and confocal microscope observation, lower translocation efficiency of IeGFP was demonstrated. The novel fluorescent fusion protein IeGFP was then used to compare the relative strengths of cry1Ia (Pi) and cry1Ac (Pac) gene promoters in Bt strain, the latter promoter proving the stronger. The eGFP reporter, by contrast, cannot indicate unambiguously the regulation pattern of Pi at the same level of sensitivity. The fluorescent signals of E. coli and Bt cells expressing the Iasp fused mCherry (ImCherry) were also enhanced. Importantly, the Iasp can also enhanced the expression of two difficult-to-express proteins, matrix metalloprotease-13 (MMP13) and myostatin (growth differentiating factor-8, GDF8) in E. coli BL21-star (DE3) strain.
Conclusions: We identified the positive effects of a weak signal peptide, Iasp, on the expression of fluorescent proteins and other recombinant proteins in bacteria. The produced IeGFP and ImCherry can be used as novel fluorescent protein variants in prokaryotic cells. The results suggested the potential application of Iasp as a novel fusion tag for improving the recombinant protein expression.
Keywords: Cry1Ia; Expression level; Fluorescent intensity; Fluorescent proteins; Fusion tag; Signal peptide.
Conflict of interest statement
The authors declare that they have no competing interests.
Figures


Similar articles
-
N-region of Cry1Ia: A novel fusion tag for Escherichia coli and Pichia pastoris.J Biotechnol. 2023 Mar 20;366:54-64. doi: 10.1016/j.jbiotec.2023.02.006. Epub 2023 Feb 21. J Biotechnol. 2023. PMID: 36822476
-
Expression of a recombinant Cry1Ac crystal protein fused with a green fluorescent protein in Bacillus thuringiensis subsp. kurstaki Cry-B.J Microbiol. 2004 Dec;42(4):340-5. J Microbiol. 2004. PMID: 15650692
-
Expression and characterization of a recombinant Cry1Ac crystal protein with enhanced green fluorescent protein in acrystalliferous Bacillus thuringiensis.Lett Appl Microbiol. 2004;38(5):393-9. doi: 10.1111/j.1472-765X.2004.01505.x. Lett Appl Microbiol. 2004. PMID: 15059210
-
Expression of cry genes in Bacillus thuringiensis biotechnology.Appl Microbiol Biotechnol. 2019 Feb;103(4):1617-1626. doi: 10.1007/s00253-018-9552-x. Epub 2019 Jan 7. Appl Microbiol Biotechnol. 2019. PMID: 30617537 Review.
-
Genetic manipulation in Bacillus thuringiensis for strain improvement.Biotechnol Lett. 2010 Nov;32(11):1549-57. doi: 10.1007/s10529-010-0338-1. Epub 2010 Jul 22. Biotechnol Lett. 2010. PMID: 20652622 Review.
Cited by
-
Coexpressing the Signal Peptide of Vip3A and the Trigger Factor of Bacillus thuringiensis Enhances the Production Yield and Solubility of eGFP in Escherichia coli.Front Microbiol. 2022 Jul 18;13:892428. doi: 10.3389/fmicb.2022.892428. eCollection 2022. Front Microbiol. 2022. PMID: 35923407 Free PMC article.
-
Effect and potential mechanism of nitrite reductase B on nitrite degradation by Limosilactobacillus fermentum RC4.Curr Res Food Sci. 2024 Apr 24;8:100749. doi: 10.1016/j.crfs.2024.100749. eCollection 2024. Curr Res Food Sci. 2024. PMID: 38694558 Free PMC article.
-
Identification of an N-terminal tag (580N) that improves the biosynthesis of fluorescent proteins in Francisella tularensis and other Gram-negative bacteria.Mol Cell Probes. 2024 Apr;74:101956. doi: 10.1016/j.mcp.2024.101956. Epub 2024 Mar 19. Mol Cell Probes. 2024. PMID: 38492609 Free PMC article.
-
N-Terminal Sequences of Signal Peptides Assuming Critical Roles in Expression of Heterologous Proteins in Bacillus subtilis.Microorganisms. 2024 Jun 23;12(7):1275. doi: 10.3390/microorganisms12071275. Microorganisms. 2024. PMID: 39065044 Free PMC article.
References
-
- Zimmer M. Green fluorescent protein (GFP): applications, structure, and related photophysical behavior. Chem Rev. 2002;102:759–781. - PubMed
-
- Shaner NC, Steinbach PA, Tsien RY. A guide to choosing fluorescent proteins. Nat Methods. 2005;2:905–909. - PubMed
-
- Crameri A, Whitehorn EA, Tate E, Stemmer WPC. Improved green fluorescent protein by molecular evolution using DNA shuffling. Nat Biotechnol. 1996;14:315–319. - PubMed
-
- Fukuda H, Arai M, Kuwajima K. Folding of green fluorescent protein and the cycle3 mutant. Biochemistry. 2000;39:12025–12032. - PubMed
MeSH terms
Substances
Grants and funding
LinkOut - more resources
Full Text Sources
Research Materials
Miscellaneous
