. 2020 May;8(1):e000162.
doi: 10.1136/jitc-2019-000162.

Cytotoxic T-cell-related gene expression signature predicts improved survival in muscle-invasive urothelial bladder cancer patients after radical cystectomy and adjuvant chemotherapy

Affiliations

Cytotoxic T-cell-related gene expression signature predicts improved survival in muscle-invasive urothelial bladder cancer patients after radical cystectomy and adjuvant chemotherapy

Markus Eckstein et al. J Immunother Cancer. 2020 May.

Abstract

Background: Assessment of the immune status of muscle-invasive bladder cancer (MIBC) has previously shown to be prognostically relevant after treatment with curative intent. We conducted this study to develop a clinically applicable immune gene expression assay to predict prognosis and adjuvant chemotherapy benefit.

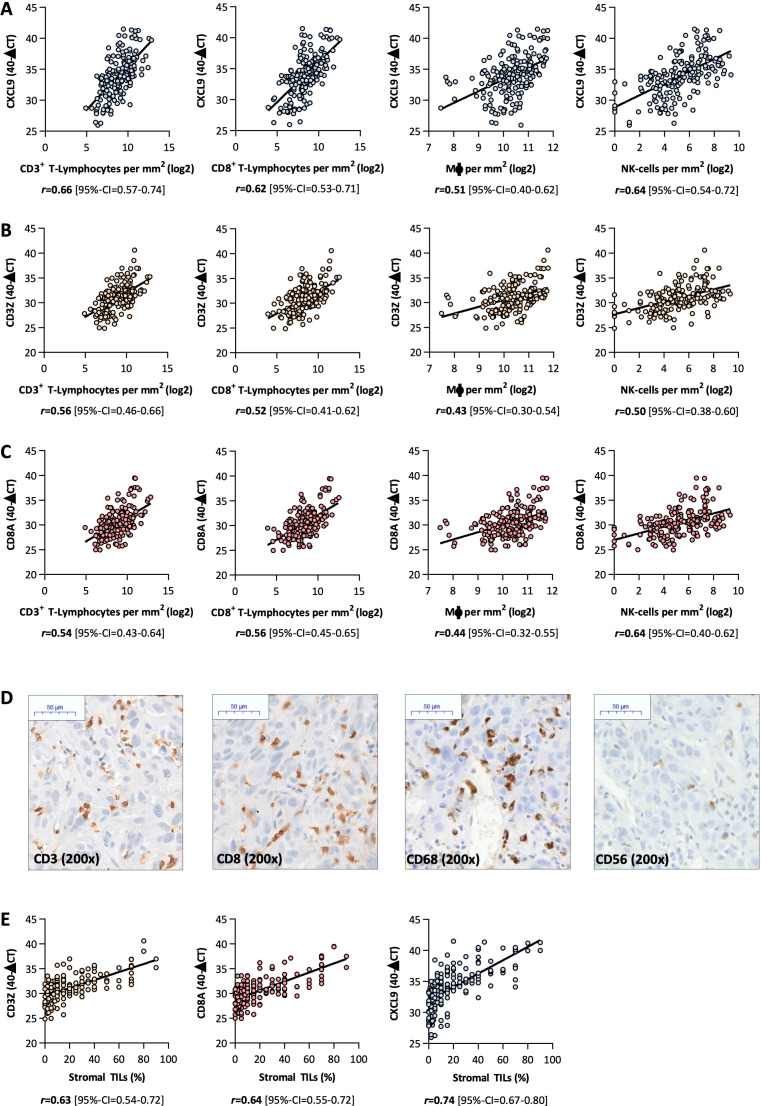
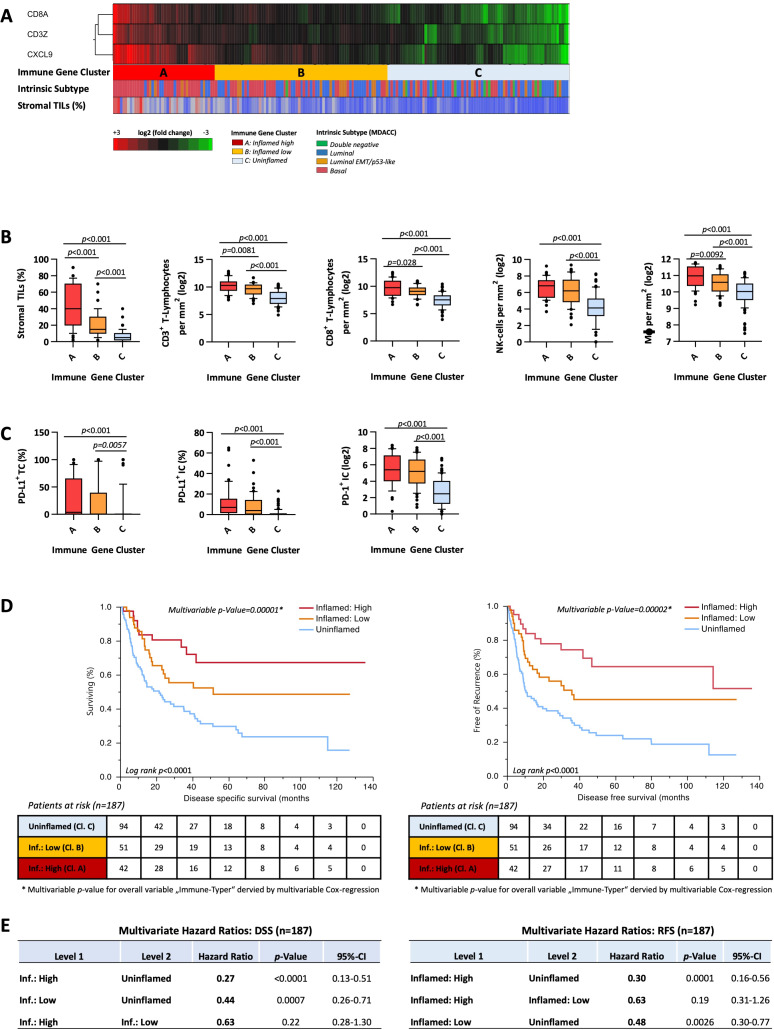
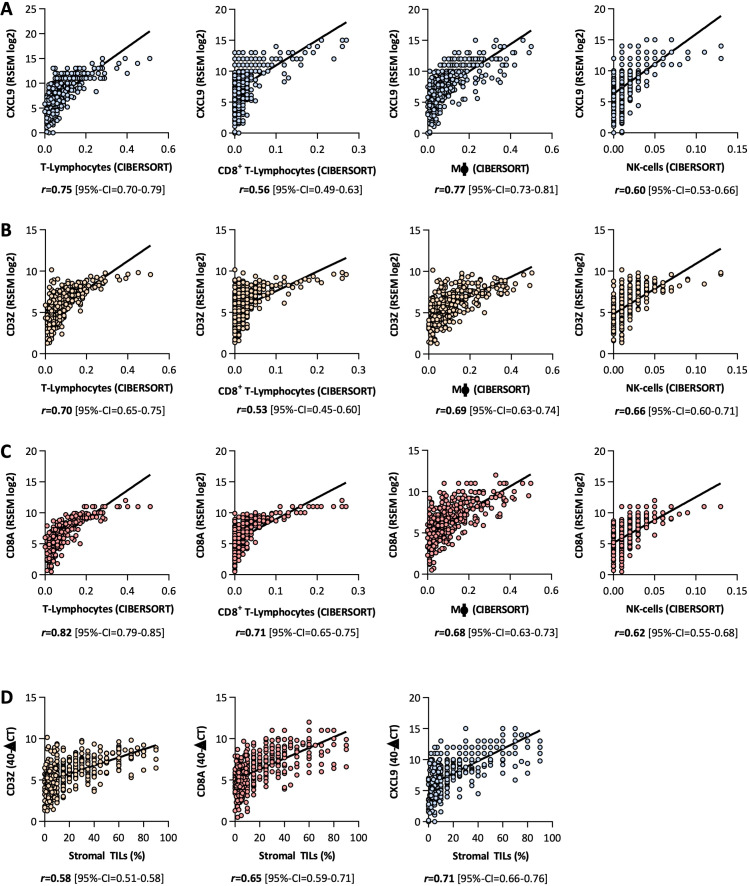
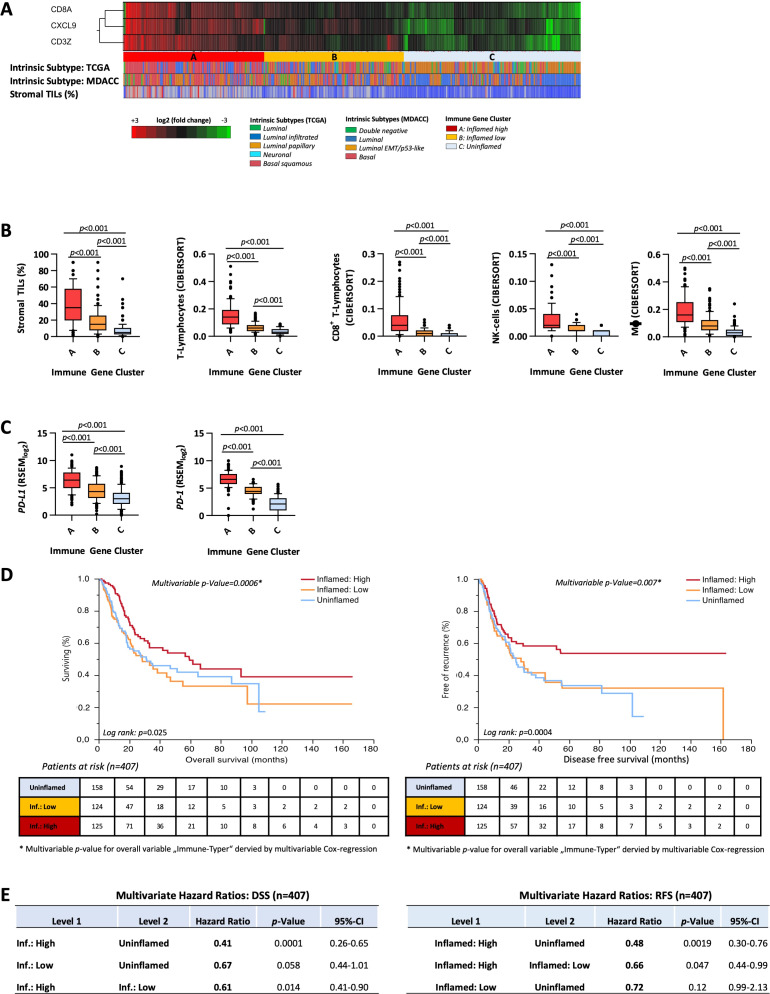
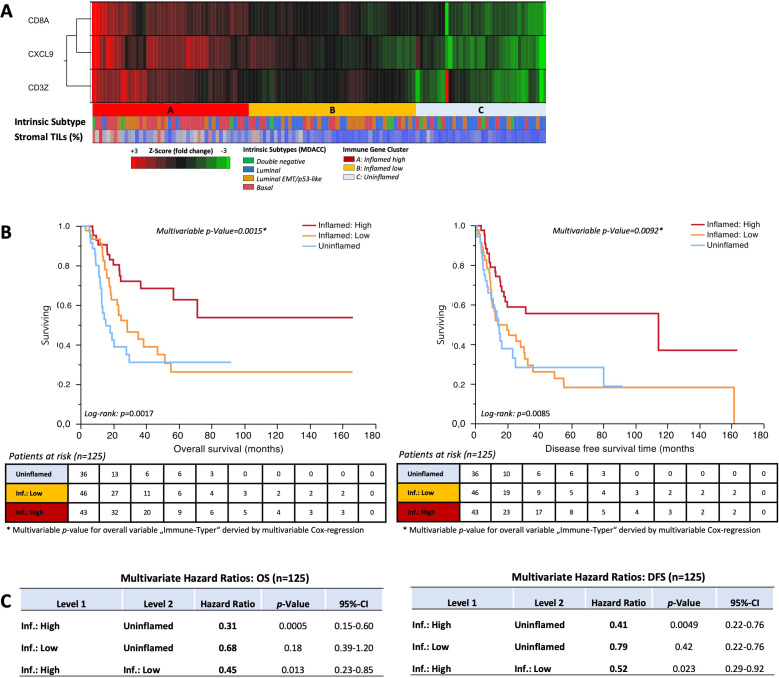
Patients and methods: Gene expression of CD3Z, CD8A and CXCL9, immune cell (IC) populations including stromal tumor infiltrating lymphocytes (sTILs), T-cells, natural killer cells (NK-cells), macrophages, Programmed cell death protein 1 positive (PD-1) IC and tumor subtypes (MD Anderson Cancer Center/MDACC-approach) were assessed in 187 MIBC patients (Comprehensive Cancer Center Erlangen-EMN/CCC-EMN-cohort). A gene expression signature was derived by hierarchical-clustering and validated in The Cancer Genome Atlas (TCGA)-cohort. IC populations in the TCGA cohort were assessed via CIBERSORT. Benefit of platinum-containing adjuvant chemotherapy was assessed in a pooled cohort of 125 patients. Outcome measurements were disease specific survival, disease-free survival and overall survival.

Results: The gene expression signature of CXCL9, CD3Z and CD8A correlates with quantitative amounts of specific IC populations and sTILs (CCC-EMN: ρ-range: 0.44-0.74; TCGA: ρ-range: 0.56-0.82) and allows stratification of three different inflammation levels (inflamed high, inflamed low, uninflamed). Highly inflamed tumors are preferentially basal subtype and show favorable 5-year survival rates of 67.3% (HR=0.27; CCC-EMN) and 55% (HR=0.41; TCGA). Uninflamed tumors are predominantly luminal subtypes and show low 5-year survival rates of 28% (CCC-EMN) and 36% (TCGA). Inflamed tumors exhibit higher levels of PD-1 and Programmed cell death 1 ligand 1 (PD-L1). Patients undergoing adjuvant platinum-based chemotherapy with 'inflamed high' tumors showed a favorable 5-year survival rate of 64% (HR=0.27; merged CCC-EMN and TCGA cohort).

Conclusion: The gene expression signature of CD3Z, CD8A and CXCL9 can assess the immune status of MIBC and stratify the survival of MIBC patients undergoing surgery and adjuvant platinum-based chemotherapy. Furthermore, the assay can identify patients with immunological hot tumors with particular high expression of PD-L1 potentially suitable for immunotherapy.

Keywords: immunology; pathology; urology.


Conflict of interest statement

Competing interests: RW is founder and CEO of STRATIFYER Molecular pathology.

Figures

Figure 1
Figure 1
Correlations of gene expression with immune cell (IC) populations: Spearman rank correlations of CXCL9 (A), CD3Z (B) and CD8A (C) gene expression with CD3+, CD8+, CD68+ (macrophages) and CD56+ (NK-cells) IC infiltrates detected by immunohistochemistry. (D) Representative images of IC populations. (E) Spearman rank correlations of CXCL9, CD3Z and CD8A gene expression with stromal tumor infiltrating lymphocytes (sTILs).
Figure 2
Figure 2
CCC-EMN cohort—immune gene clusters: (A) unsupervised hierarchical cluster analysis (average-linkage algorithm) of CD8A, CD3Z and CXCL9 gene expression: cluster A=inflamed high, cluster B=inflamed low, cluster C=uninflamed. Distribution of intrinsic subtypes and sTILs (%) are depicted below in h-bar plots. (B) Correlations of immune gene clusters A, B and C with sTILs, CD3+, CD8+, CD68+ (macrophages) and CD56+ (NK-cells). (C) Correlations of immune gene clusters A, B and C with total amount of PD-1+ IC and protein expression of PD-L1 on IC and tumor cells. P values are derived by Mann-Whitney U test. (D) Kaplan-Meier regression of disease specific (DSS) and disease-free survival (DFS) based on immune gene clusters. Univariable log-rank p value is depicted in the lower left corner of the survival plots. Multivariable p value for the entire indicator ‘immune gene clusters’ derived by multivariable Cox regression is depicted above the survival curves. Table shows number of patients at risk in 20 months increments. (E) Multivariable HRs of immune gene clusters for DSS and DFS. IC, immune cell; sTILs, stromal tumor infiltrating lymphocytes.
Figure 3
Figure 3
TCGA BLCA cohort—correlations of gene expression with CIBERSORT IC populations: Spearman rank correlations of CXCL9 (A), CD3Z (B) and CD8A (C) gene expression with T-lymphocytes, CD8+-lymphocytes, macrophages and NK-cells derived by CIBERSORT. (D) Spearman rank correlations of CXCL9, CD3Z and CD8A gene expression with stromal tumor infiltrating lymphocytes (sTILs). TCGA BLCA, The Cancer Genome Atlas cohort of bladder cancer. RSEM = RNA-Seq by Expectation Maximization
Figure 4
Figure 4
TCGA BLCA cohort—immune gene clusters: (A) unsupervised hierarchical cluster analysis (average-linkage algorithm) of CD8A, CD3Z and CXCL9 gene expression: cluster A=inflamed high, cluster B=inflamed low, cluster C=uninflamed. distribution of intrinsic subtypes and sTILs (%) are depicted below in h-bar plots. (B) Correlations of immune gene clusters A (inflamed high), B (inflamed low) and C (uninflamed) with sTILs, T-lymphocytes, CD8+-lymphocytes, macrophages and NK-cells. P values are derived by Mann-Whitney U test. (C) Correlations of immune gene clusters A, B and C with gene expression of PDCD-1 (PD-1) IC and PD-L1 (CD274). (D) Kaplan-Meier regression of overall survival (OS) and DFS based on immune gene clusters. Univariable log-rank p value is depicted in the lower left corner of the survival plots. Multivariable p value for the entire indicator ‘immune gene clusters’ derived by multivariable Cox-regression is depicted above the survival curves. Table shows number of patients at risk in 20 months increments. (E) Multivariable HRs of immune gene clusters for OS and DFS. DSS, disease-specific survival; TCGA BLCA, The Cancer Genome Atlas cohort of bladder cancer; TILs, tumor infiltrating lymphocytes.
Figure 5
Figure 5
Adjuvant chemotherapy cohort (TCGA +CCC EMN): (A) unsupervised hierarchical cluster analysis (Average-linkage algorithm) of CD8A, CD3Z and CXCL9 gene expression: cluster A=inflamed high, cluster B=inflamed low, cluster C=uninflamed. distribution of intrinsic subtypes and TILs (%) are depicted above in h-bar plots. (B) Kaplan-Meier regression of OS and DFS based on immune gene clusters. Univariable log-rank p value is depicted in the lower left corner of the survival plots. Multivariable p value for the entire indicator ‘immune gene clusters’ derived by multivariable Cox-regression is depicted above the survival curves. Table shows number of patients at risk in 20 months increments. (C) Multivariable HRs of immune gene clusters for OS and DFS. TCGA, The Cancer Genome Atlas; TILs, tumor infiltrating lymphocytes.

References

    1. Ferlay J, Soerjomataram I, Dikshit R, et al. Cancer incidence and mortality worldwide: sources, methods and major patterns in GLOBOCAN 2012. Int J Cancer 2015;136:E359–86. 10.1002/ijc.29210 - DOI - PubMed
    1. Babjuk M, Böhle A, Burger M, et al. EAU guidelines on non-muscle-invasive urothelial carcinoma of the bladder: update 2016. Eur Urol 2017;71:447–61. 10.1016/j.eururo.2016.05.041 - DOI - PubMed
    1. Kamat AM, Hahn NM, Efstathiou JA, et al. Bladder cancer. Lancet 2016;388:2796–810. 10.1016/S0140-6736(16)30512-8 - DOI - PubMed
    1. Sjödahl G, Eriksson P, Liedberg F, et al. Molecular classification of urothelial carcinoma: global mRNA classification versus tumour-cell phenotype classification. J Pathol 2017;242:113–25. 10.1002/path.4886 - DOI - PMC - PubMed
    1. Robertson AG, Kim J, Al-Ahmadie H, et al. Comprehensive molecular characterization of muscle-invasive bladder cancer. Cell 2017;171:540–56. 10.1016/j.cell.2017.09.007 - DOI - PMC - PubMed

Publication types