

Global, regional and time-trend prevalence of central obesity: a systematic review and meta-analysis of 13.2 million subjects
- PMID: 32448986
- PMCID: PMC7387368
- DOI: 10.1007/s10654-020-00650-3
Global, regional and time-trend prevalence of central obesity: a systematic review and meta-analysis of 13.2 million subjects
Abstract
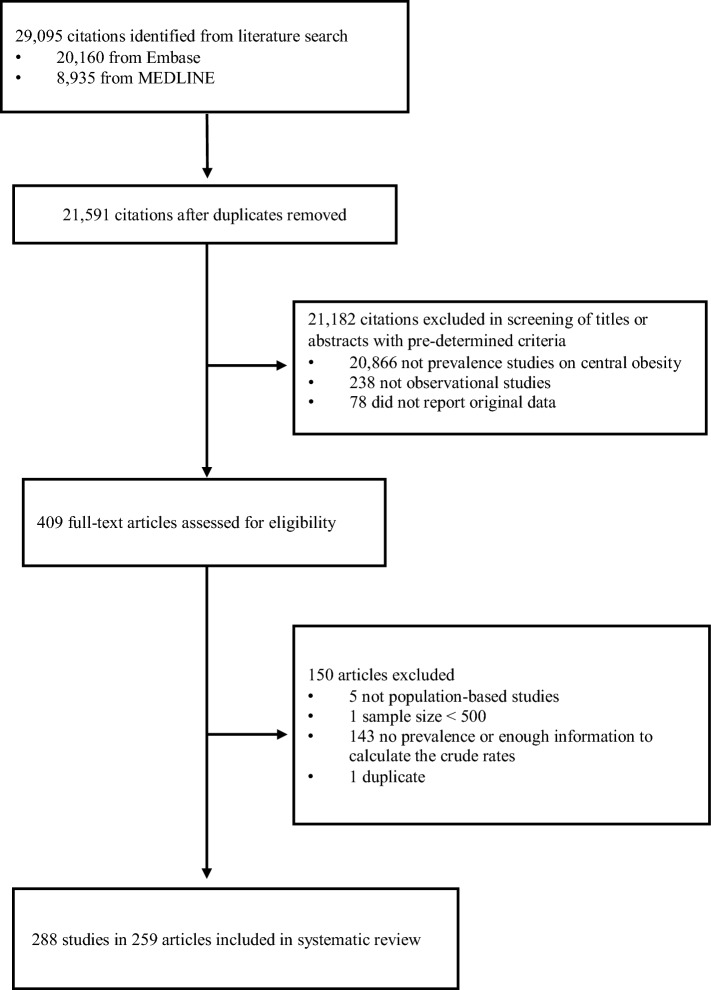
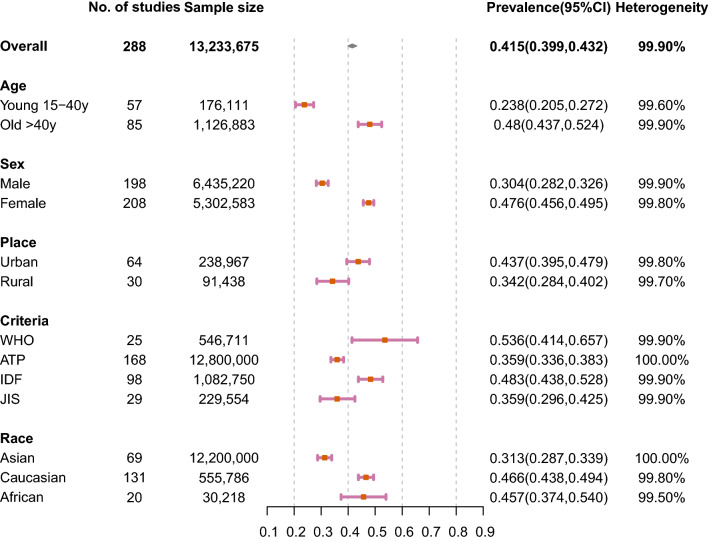
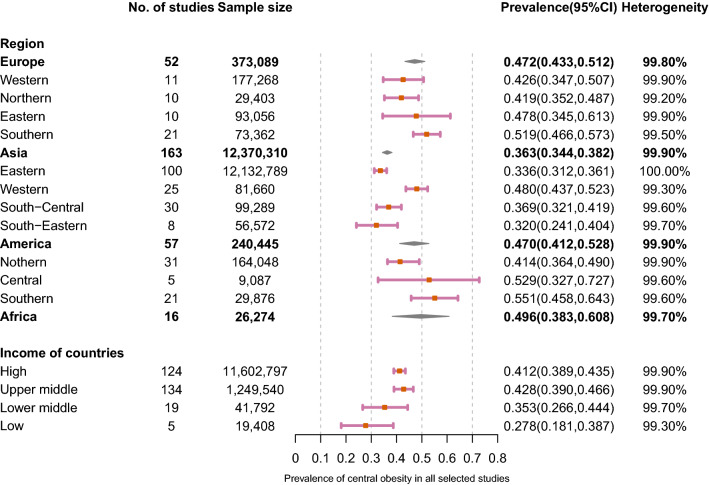
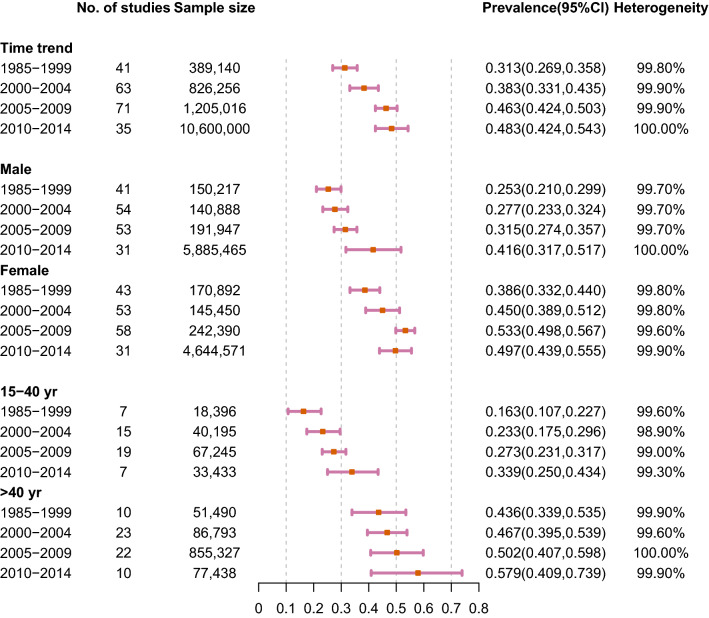
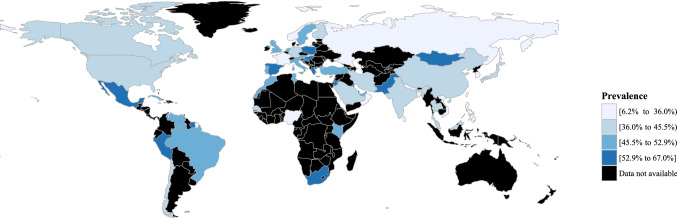
We aimed to examine the global prevalences of central obesity according to age, sex, race, place of residence, geographical region, national income level, and the definitions of central obesity. MEDLINE and Embase were searched. Studies with sample size of ≥ 500 and investigated individuals aged ≥ 15 years were included. Metaprop (a Stata command) was adopted to conduct a meta-analysis of prevalence, and the Freeman-Tukey Double Arcsine Transformation was used to stabilize the variances. A random-effects model was used to evaluate the prevalence and 95% confidence intervals (CI) of central obesity. There were 288 studies involving 13,233,675 individuals in this analysis. The overall prevalence of central obesity was 41.5% (95% CI 39.9-43.2%). A higher prevalence was found in older individuals, female subjects, urban residents, Caucasians, and populations of higher income level countries. Regarding regional variations, the highest prevalence was found in Sothern America (55.1%, 95% CI 45.8-64.3%) and Central American (52.9%, 95% CI 32.7-72.7%). Its prevalence was rapidly rising from 1985 to 2014. From 1985-1999 to 2010-2014, younger subjects aged 15-40 years showed a more drastic rise in prevalence (16.3 to 33.9%) than subjects aged > 40 years (43.6 to 57.9%). Male individuals have a more drastic rise (25.3 to 41.6%) than females (38.6 to 49.7%). Major increasing in prevalence of the condition in the past three decades, particularly in certain subgroups. These findings could act as a useful reference to inform public health strategies to minimize the impact of central obesity on population health.
Keywords: Central obesity; Epidemiology; Prevalence; Temporal trend; Waist circumference.
Conflict of interest statement
We declare no competing interests.
Figures
References
-
- WHO. Waist Circumference and Waist–Hip Ratio: Report of a WHO Expert Consultation 8–11 December ed. Geneva; 2008. p. 47.
-
- Carey DGP. Abdominal obesity. Curr Opin Lipidol. 1998;9(1):35–40. - PubMed
-
- Cornier MA, Tate CW, Grunwald GK, Bessesen DH. Relationship between waist circumference, body mass index, and medical care costs. Obes Res. 2002;10(11):1167–1172. - PubMed
-
- APCSC Central obesity and risk of cardiovascular disease in the Asia Pacific Region. Asia Pac J Clin Nutri. 2006;15(3):287–92. - PubMed
Publication types
MeSH terms
LinkOut - more resources
Full Text Sources
Miscellaneous
