. 2020 Oct 1;37(10):2900-2917.
doi: 10.1093/molbev/msaa128.

Evolution of the Insecticide Target Rdl in African Anopheles Is Driven by Interspecific and Interkaryotypic Introgression

Affiliations

Evolution of the Insecticide Target Rdl in African Anopheles Is Driven by Interspecific and Interkaryotypic Introgression

Xavier Grau-Bové et al. Mol Biol Evol. .

Abstract

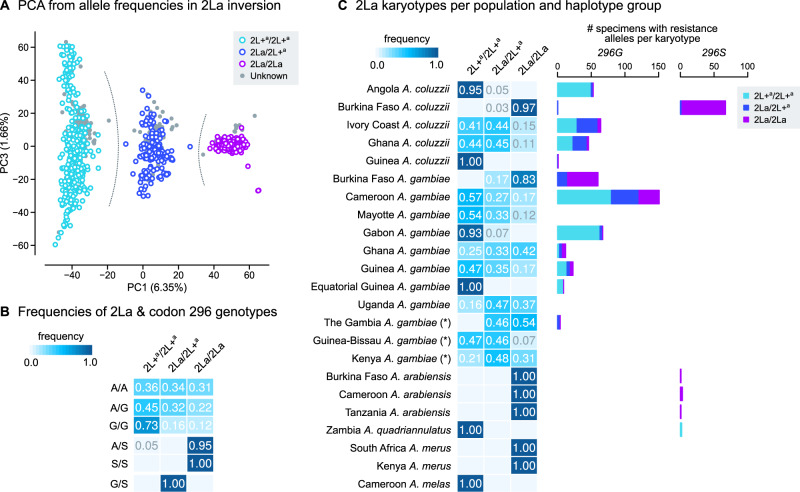
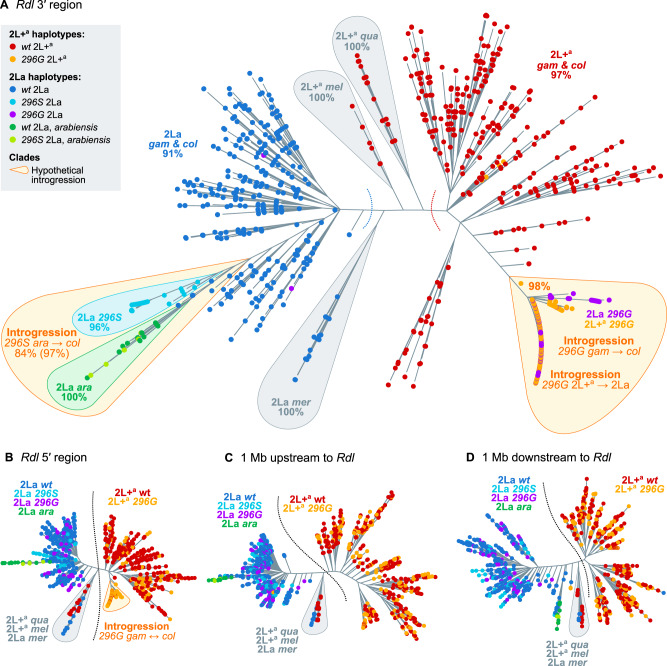
The evolution of insecticide resistance mechanisms in natural populations of Anopheles malaria vectors is a major public health concern across Africa. Using genome sequence data, we study the evolution of resistance mutations in the resistance to dieldrin locus (Rdl), a GABA receptor targeted by several insecticides, but most notably by the long-discontinued cyclodiene, dieldrin. The two Rdl resistance mutations (296G and 296S) spread across West and Central African Anopheles via two independent hard selective sweeps that included likely compensatory nearby mutations, and were followed by a rare combination of introgression across species (from A. gambiae and A. arabiensis to A. coluzzii) and across nonconcordant karyotypes of the 2La chromosomal inversion. Rdl resistance evolved in the 1950s as the first known adaptation to a large-scale insecticide-based intervention, but the evolutionary lessons from this system highlight contemporary and future dangers for management strategies designed to combat development of resistance in malaria vectors.

Keywords: insect vectors; insecticide resistance; population genomics.


Figures

Fig. 1.
Fig. 1.
Rdl mutations. (A) Frequency of nonsynonymous mutations in Rdl across populations of Anopheles gambiae, A. coluzzii (Ag1000G Phase 2), and A. arabiensis. Only variants with >5% frequency in at least on population are included. (B) Distribution of genotypes for the two mutations in codon 296 (A296S and A296G). Note: A. gambiae populations denoted with an asterisk (The Gambia, Guinea-Bissau, and Kenya) have high frequency of hybridization and/or unclear species identification (see Materials and Methods).
Fig. 2.
Fig. 2.
Linkage disequilibrium. Linkage disequilibrium between nonsynonymous mutations in Rdl, calculated using Huff and Rogers’ r (A) and Lewontin’s D′ (B).
Fig. 3.
Fig. 3.
Rdl haplotypes. (A) Minimum spanning network of haplotypes around Rdl codon 296 (626 phased variants located ±10,000 bp from the 2L:25429236 position). Only haplotype clusters with a frequency >1% in the cohort are represented (complete networks available as supplementary material SM6, Supplementary Material online). Each node in the network is color coded according to its species composition. Haplotype clusters carrying the resistance alleles 296G and 296S are highlighted in blue. Red arrows indicate the direction of nonsynonymous mutations (relative to reference genome). (B) Frequency of resistance haplotypes per population. Pie area reflects sample size, ranging from Guinea Anopheles coluzzii (n = 8) to Cameroon A. gambiae (n = 594). Detailed frequencies with absolute counts in supplementary material SM14, Supplementary Material online. gam, A. gambiae; col, A. coluzzii. gam populations denoted with an asterisk have unclear species identification and/or high rates of hybridization.
Fig. 4.
Fig. 4.
Positive selection of haplotypes carrying resistance mutations. (A) Profile of EHH decay for each group of haplotypes (296G, 296S, and wt), built from 11,180 phased variants located ±100,000 bp from codon 296 (2L:25429236 position). Coordinates of nearby genes are indicated above the EHH panel (in Rdl, exons are numbered and red arrows indicate the position of codons 296 and 345). (B–D) Profiles of Garud H12, Garud H2/H1, and haplotypic diversity along chromosomal arm 2L, highlighting the region covered by the 2La inversion (orange vertical lines) and the location of Rdl (red arrow). Each statistic was calculated separately for haplotypes carrying the 296G, 296S, and wt alleles, using sliding blocks of 500 variants with 20% overlap.
Fig. 5.
Fig. 5.
Genotypes of the 2La inversion. (A) Principal component analysis of genotype frequencies of 10,000 random variants located within the 2La inversion (coordinates: 2L:20524058–42165532). Specimens from Ag1000G Phase 1 are color coded by 2La karyotype (homozygotes and heterozygotes), and they are used as a reference to assign 2La genotypes to Phase 2 specimens (gray). Gray-dotted lines highlight the separation of three clusters according to 2La karyotype. (B) Frequency of 2La inversion and Rdl codon 296 genotypes. (C) Frequency of 2La inversion karyotypes per population (heatmap, left), and number of specimens from each population carrying resistance alleles (296G and 296S), broken down by 2La karyotype (barplots, right). Note: Anopheles gambiae populations denoted with an asterisk (The Gambia, Guinea-Bissau, and Kenya) have high frequency of hybridization and/or unclear species identification (see Materials and Methods).
Fig. 6.
Fig. 6.
Phylogenies of haplotypes around the Rdl locus. (A) Maximum-likelihood phylogenetic analysis of variants present at the 3′ region of Rdl (20,000 kb). Nodes are haplotypes and have been color coded according to their Rdl genotype (296S, 296G, wt), 2La karyotype (2La, 2L+a), and species. Orange bubbles highlight clades with hypothetical introgression events. Gray bubbles highlight outgroup clades. Statistical supports are shown on selected clades (UF bootstrap). (B–D) Analogous phylogenies from the Rdl 5′ region, upstream, and downstream regions within the 2La inversion (±1 Mb of Rdl). Complete alignments and phylogenies in supplementary materials SM10 and SM11, Supplementary Material online. col, coluzzii; gam, gambiae; ara, arabiensis; mer, merus; mel, melas; qua, quadriannulatus. Arrows indicate introgression events.
Fig. 7.
Fig. 7.
Interspecific introgression. (A) Direction of 296S introgression between Anopheles arabiensis and A. coluzzii (2La/ 2La background). We test two complementary hypothesis using Patterson’s D statistics: left, introgression between A. coluzzii 296S homozygotes (population A), A. coluzzii wt (B), and A. arabiensis (296S or wt; C) using A. christyi as outgroup (O); right, reversing the position of A. coluzzii and A. arabiensis as populations A/B and C. The complementary hypotheses can be summarized as follows: if 296S homozygotes from species i show evidence of introgression with wt homozygotes from species j (first test) but not with wt from species i (second test), 296S originated in species j. (B) Direction of 296G introgression between A. gambiae and A. coluzzii (2L+a/2L+a background), testing two complementary hypothesis using Patterson’s D statistics: left, introgression between A. coluzzii 296G homozygotes (population A), A. coluzzii wt (B), and A. gambiae (296G or wt; C) using A. quadriannulatus as outgroup (O); right, reversing the position of A. coluzzii and A. gambiae as populations A/B and C. Color-coded cladograms at the bottom of each plot indicate the groups of specimens used in each test, including the average D in the Rdl locus with SEs and P values (estimated from the Z score of jack-knifed estimates; see Materials and Methods). See detailed lists of comparisons and statistical analyses in supplementary materials SM12 and SM13, Supplementary Material online.
Fig. 8.
Fig. 8.
Interkaryotypic introgression of 296G haplotypes. Ratio of sequence divergence (Dxy) between 296G and wt haplotypes of 2L+a and 2La origin. In this ratio, numerators are divergences between 296G haplotypes (of either 2L+a or 2La origin, in blue and purple respectively) relative to wt-2La haplotypes, and denominators are relative to wt-2L+a. Ratios >1 indicate similarity to wt-2L+a, and values <1 indicate similarity to wt-2La. All values are calculated in windows of 20,000 kp with 10% overlap.
Fig. 9.
Fig. 9.
RDL receptor models with docked dieldrin. (A) Homology model of the Anopheles gambiae RDL homopentamer, viewed from the membrane plane (top) and cytoplasm (bottom). The 296A (purple) and 345T (red) positions are shown in space-fill. The dotted outlines depict the receptor regions in panels (B–D). (B) Docking prediction for dieldrin in the pore of the 296A (wt) receptor. Dieldrin is shown in green, in sticks, and transparent surface. Side chains lining the pore are shown as sticks and 296A is colored purple. (C and D) Superimposition of dieldrin docking onto models of the 296G and 296S receptors, respectively. (E) Pore radii in 296A, 296G, and 296S models.

References

    1. Anopheles gambiae 1000 Genomes Consortium. 2017. Ag1000G phase 2 AR1 data release. MalariaGEN [Internet]. Available from: https://www.malariagen.net/data/ag1000g-phase-2-ar1. Accessed June 6, 2020.
    1. Anopheles gambiae 1000 Genomes Consortium. 2019. Genome variation and population structure among 1,142 mosquitoes of the African malaria vector species Anopheles gambiae and Anopheles coluzzii. BioRxiv. doi: 10.1101/864314. - DOI - PMC - PubMed
    1. Andolfatto P, Depaulis F, Navarro A.. 2001. Inversion polymorphisms and nucleotide variability in Drosophila. Genet Res. 77(1):1–8. - PubMed
    1. Asahi M, Kobayashi M, Matsui H, Nakahira K.. 2015. Differential mechanisms of action of the novel γ-aminobutyric acid receptor antagonist ectoparasiticides fluralaner (A1443) and fipronil. Pest Manag Sci. 71(1):91–95. - PubMed
    1. Ayala D, Zhang S, Chateau M, Fouet C, Morlais I, Costantini C, Hahn MW, Besansky NJ.. 2019. Association mapping desiccation resistance within chromosomal inversions in the African malaria vector Anopheles gambiae. Mol Ecol. 28(6):1333–1342. - PMC - PubMed

Publication types