

Reduced iron export associated with hepcidin resistance can explain the iron overload spectrum in ferroportin disease
- PMID: 32450003
- PMCID: PMC7496278
- DOI: 10.1111/liv.14539
Reduced iron export associated with hepcidin resistance can explain the iron overload spectrum in ferroportin disease
Abstract
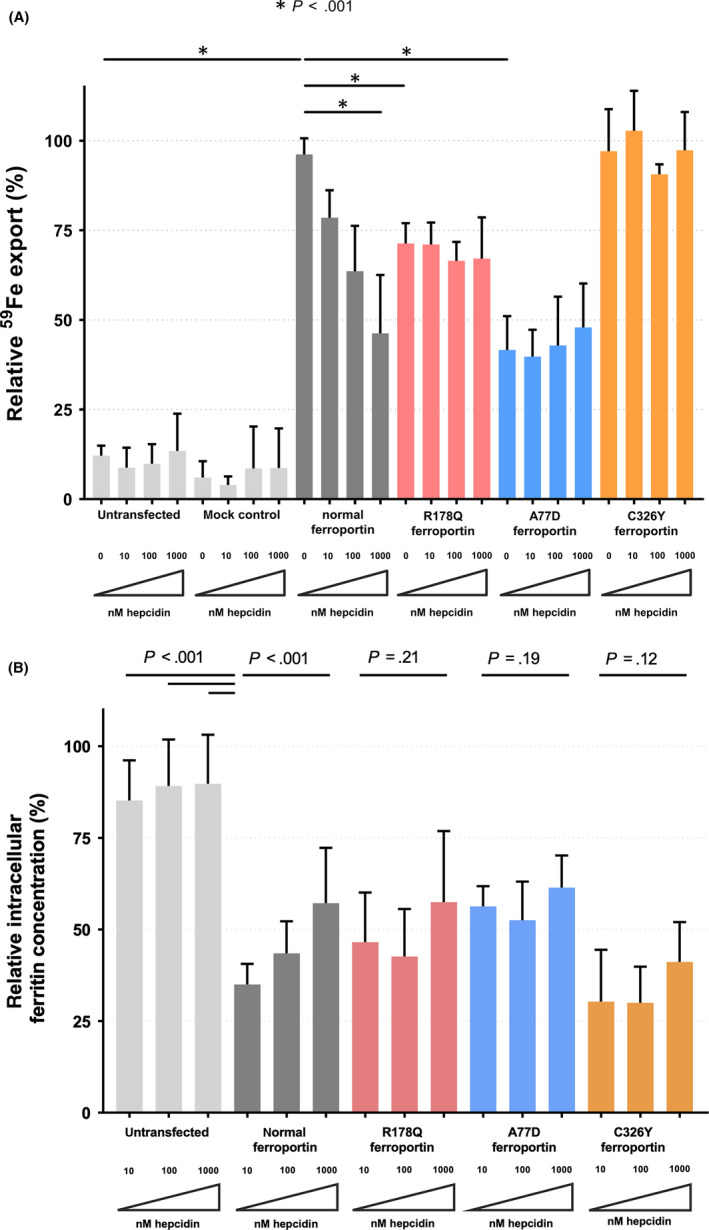
Background & aims: Ferroportin disease (FD) and hemochromatosis type 4 (HH4) are associated with variants in the ferroportin-encoding gene SLC40A1. Both phenotypes are characterized by iron overload despite being caused by distinct variants that either mediate reduced cellular iron export in FD or resistance against hepcidin-induced inactivation of ferroportin in HH4. The aim of this study was to assess if reduced iron export also confers hepcidin resistance and causes iron overload in FD associated with the R178Q variant.
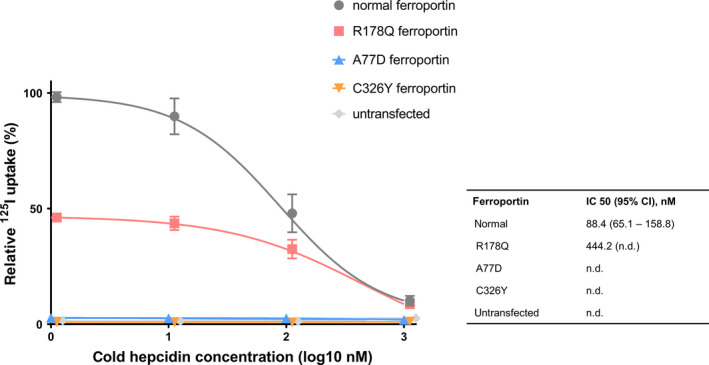
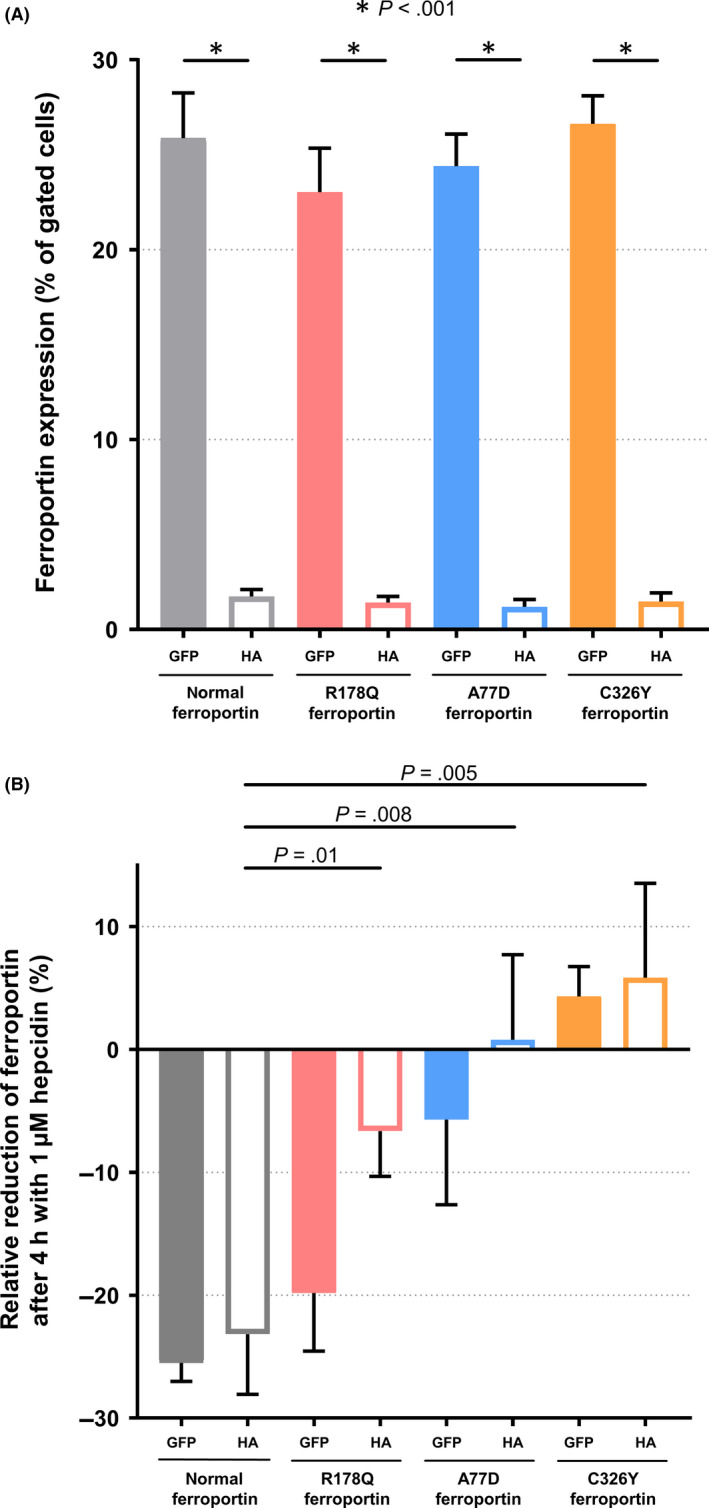
Methods: The ferroportin disease variants R178Q andA77D and the HH4-variant C326Y were overexpressed in HEK-293T cells and subcellular localization was characterized by confocal microscopy and flow cytometry. Iron export and cytosolic ferritin were measured as markers of iron transport and radioligand binding studies were performed. The hepcidin-ferroportin axis was assessed by ferritin/hepcidin correlation in patients with different iron storage diseases.
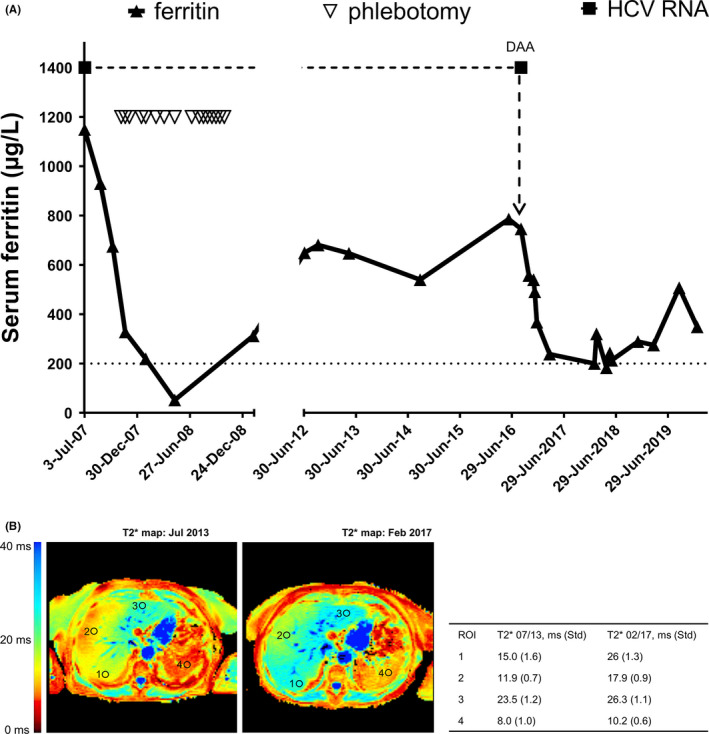
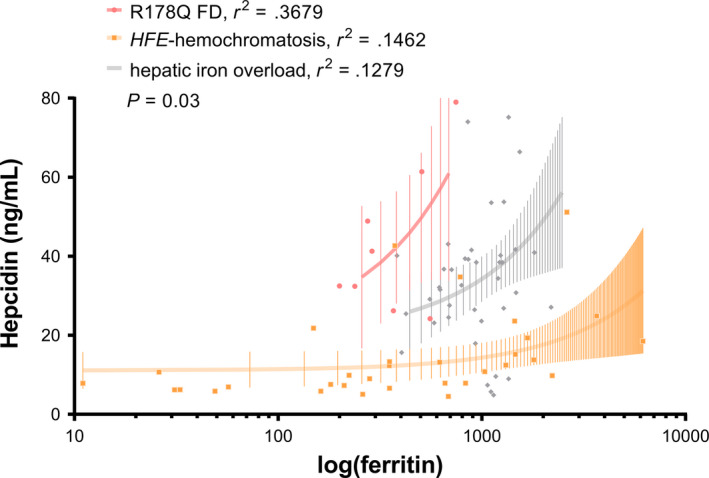
Results: In the absence of hepcidin, the R178Q and A77D variants exported less iron when compared to normal and C326Y ferroportin. In the presence of hepcidin, the R178Q and C326Y, but not the A77D-variant, exported more iron than cells expressing normal ferroportin. Regression analysis of serum hepcidin and ferritin in patients with iron overload are compatible with hepcidin deficiency in HFE hemochromatosis and hepcidin resistance in R178Q FD.
Conclusions: These results support a novel concept that in certain FD variants reduced iron export and hepcidin resistance could be interlinked. Evasion of mutant ferroportin from hepcidin-mediated regulation could result in uncontrolled iron absorption and iron overload despite reduced transport function.
Keywords: SLC40A1; ferroportin disease; hemochromatosis; hepcidin resistance.
© 2020 The Authors. Liver International published by John Wiley & Sons Ltd.
Conflict of interest statement
The authors disclose no conflicts of interest in relation to this work.
Figures
Similar articles
-
The Spectra of Disease-Causing Mutations in the Ferroportin 1 (SLC40A1) Encoding Gene and Related Iron Overload Phenotypes (Hemochromatosis Type 4 and Ferroportin Disease).Hum Mutat. 2023 Jun 13;2023:5162256. doi: 10.1155/2023/5162256. eCollection 2023. Hum Mutat. 2023. PMID: 40225168 Free PMC article. Review.
-
Impact of D181V and A69T on the function of ferroportin as an iron export pump and hepcidin receptor.Biochim Biophys Acta. 2014 Sep;1842(9):1406-12. doi: 10.1016/j.bbadis.2014.05.011. Epub 2014 May 21. Biochim Biophys Acta. 2014. PMID: 24859227
-
The dual loss and gain of function of the FPN1 iron exporter results in the ferroportin disease phenotype.HGG Adv. 2024 Oct 10;5(4):100335. doi: 10.1016/j.xhgg.2024.100335. Epub 2024 Jul 22. HGG Adv. 2024. PMID: 39039793 Free PMC article.
-
Resistance to hepcidin is conferred by hemochromatosis-associated mutations of ferroportin.Blood. 2005 Aug 1;106(3):1092-7. doi: 10.1182/blood-2005-02-0561. Epub 2005 Apr 14. Blood. 2005. PMID: 15831700
-
Inherited iron overload disorders.Transl Gastroenterol Hepatol. 2020 Apr 5;5:25. doi: 10.21037/tgh.2019.11.15. eCollection 2020. Transl Gastroenterol Hepatol. 2020. PMID: 32258529 Free PMC article. Review.
Cited by
-
Apo- and holo-transferrin differentially interact with hephaestin and ferroportin in a novel mechanism of cellular iron release regulation.J Biomed Sci. 2023 Jun 6;30(1):36. doi: 10.1186/s12929-023-00934-2. J Biomed Sci. 2023. PMID: 37277838 Free PMC article.
-
The Spectra of Disease-Causing Mutations in the Ferroportin 1 (SLC40A1) Encoding Gene and Related Iron Overload Phenotypes (Hemochromatosis Type 4 and Ferroportin Disease).Hum Mutat. 2023 Jun 13;2023:5162256. doi: 10.1155/2023/5162256. eCollection 2023. Hum Mutat. 2023. PMID: 40225168 Free PMC article. Review.
-
EnvIRONmental Aspects in Myelodysplastic Syndrome.Int J Mol Sci. 2021 May 14;22(10):5202. doi: 10.3390/ijms22105202. Int J Mol Sci. 2021. PMID: 34068996 Free PMC article. Review.
-
HFE-Related Hemochromatosis May Be a Primary Kupffer Cell Disease.Biomedicines. 2025 Mar 10;13(3):683. doi: 10.3390/biomedicines13030683. Biomedicines. 2025. PMID: 40149659 Free PMC article. Review.
-
TAM-ing the CIA-Tumor-Associated Macrophages and Their Potential Role in Unintended Side Effects of Therapeutics for Cancer-Induced Anemia.Front Oncol. 2021 Mar 25;11:627223. doi: 10.3389/fonc.2021.627223. eCollection 2021. Front Oncol. 2021. PMID: 33842333 Free PMC article.
References
-
- Mayr R, Griffiths WJH, Hermann M, et al. Identification of mutations in SLC40A1 that affect ferroportin function and phenotype of human ferroportin iron overload. Gastroenterology. 2011;140(7):2056‐2063.e1. - PubMed
-
- Pietrangelo A. Hemochromatosis: an endocrine liver disease. Hepatology. 2007;46:1291‐1301. - PubMed
-
- Viveiros A, Schaefer B, Tilg H, et al. Iron Matryoshka‐Haemochromatosis nested in Ferroportin Disease? Liver Int. 2019;39:1014‐1015. - PubMed
-
- Pietrangelo A. The ferroportin disease. Blood Cells Mol Dis. 2004;32:131‐138. - PubMed
Publication types
MeSH terms
Substances
LinkOut - more resources
Full Text Sources
Medical
Miscellaneous
