. 2020 May 26:9:e51027.
doi: 10.7554/eLife.51027.

Estimates of the global burden of Japanese encephalitis and the impact of vaccination from 2000-2015

Affiliations

Estimates of the global burden of Japanese encephalitis and the impact of vaccination from 2000-2015

Tran Minh Quan et al. Elife. .

Abstract

Japanese encephalitis (JE) is a mosquito-borne disease, known for its high mortality and disability rate among symptomatic cases. Many effective vaccines are available for JE, and the use of a recently developed and inexpensive vaccine, SA 14-14-2, has been increasing over the recent years particularly with Gavi support. Estimates of the local burden and the past impact of vaccination are therefore increasingly needed, but difficult due to the limitations of JE surveillance. In this study, we implemented a mathematical modelling method (catalytic model) combined with age-stratifed case data from our systematic review which can overcome some of these limitations. We estimate in 2015 JEV infections caused 100,308 JE cases (95% CI: 61,720-157,522) and 25,125 deaths (95% CI: 14,550-46,031) globally, and that between 2000 and 2015 307,774 JE cases (95% CI: 167,442-509,583) were averted due to vaccination globally. Our results highlight areas that could have the greatest benefit from starting vaccination or from scaling up existing programs and will be of use to support local and international policymakers in making vaccine allocation decisions.

Keywords: epidemiology; global health; human; japanese encephalitis; mathematical modelling; vaccination impact.


Conflict of interest statement

TQ, TT, ND, TN, HC No competing interests declared

Figures

Figure 1.
Figure 1.. Flowchart describes two main stages in our analysis: Estimating FOI (force of infection) and generating burden.
In Stage I we estimate FOI (force of infection) of all studies’ catchment area. In Stage II we then used the FOI estimates to generate global burden. Abbreviation: WPP: World Population Prospects.
Figure 2.
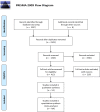
Figure 2.. Flowchart describing the systematic review procedure searching for Japanese encephalitis age- stratified case data.
Figure 2—figure supplement 1.
Figure 2—figure supplement 1.. PRISMA 2009 flowchart.
Figure 3.
Figure 3.. Reported number of individuals vaccinated in each region from multiple data sources by region from 2000 to 2015.
If the country is not listed there is no vaccination reported. Abbreviations: AUS: Australia, CHN: China, IND: India, JPN: Japan, KHM: Cambodia, KOR: South Korea, LAO: Laos, LKA: Sri Lanka, MYS: Malaysia, NPL: Nepal, PRK: People’s Republic of Korea, THA: Thailand, TLS: Timor-Leste, TWN: Taiwan, VNM: Vietnam. The supplementary file: Figure 3—source data 1 lists the vaccination data and the sources for each country.
Figure 4.
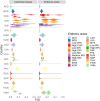
Figure 4.. FOI distribution estimated from all studies’ catchment areas (on the left), each distribution represents FOI from one study, which were used to infer the FOI distribution in all endemic areas (on the right).
The colors are coded after the endemic areas as in the legend. Abbreviation: AUS: Australia, BGD: Bangladesh, CHN: China, IDN: Indonesia, IND: India, JPN: Japan, KHM: Cambodia, KOR: South Korea, LAO: Laos, LKA: Sri Lanka, MYS: Malaysia, NPL: Nepal, PHL: Philippines, RUS: Russia, SGP: Singapore, THA: Thailand, TWN: Taiwan, VNM: Vietnam. Countries have low, medium or high following the classification in Campbell et al., 2011.
Figure 4—figure supplement 1.
Figure 4—figure supplement 1.. Estimated reporting rate from all studies.
For each study, the dots with vertical lines are the mean reporting rate estimated from the model with 95% credible interval. The colors represent the endemic areas as seen in the legend.
Figure 4—figure supplement 2.
Figure 4—figure supplement 2.. prior distributions for lambda and rho.
Figure 5.
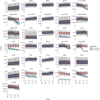
Figure 5.. Number of estimated cases with and without vaccination of the 30 endemic areas and of the world from 2000 to 2015.
The two scenarios, with or without vaccination, are also shown in blue and red respectively. In all areas, the boxplots represent the estimated cases with 95% credible intervals (also shown 1 st quartile, 3rd quartile) with the solid lines showing the mean value of each interval. Abbreviation: AUS: Australia, BGD: Bangladesh, BRN: Brunei, BTN: Bhutan, CHN: China, IDN: Indonesia, IND: India, JPN: Japan, KHM: Cambodia, KOR: South Korea, LAO: Laos, LKA: Sri Lanka, MMR: Myanmar, MYS: Malaysia, NPL: Nepal, PAK: Pakistan, PHL: Philippines, PNG: Papua New Guinea, PRK: North Korea, RUS: Russia, SGP: Singapore, THA: Thailand, TLS: Timor-Leste, TWN: Taiwan, VNM: Vietnam.
Figure 6.
Figure 6.. Maps of estimated cases (in thousand) in 30 endemic areas for two scenarios in 2015.
Each endemic area is shaded in proportion to the area’s estimated cases in thousand as seen in the legend, with yellow shade is the lowest value and red shade is the highest value. The map on the left is the estimates from no vaccination scenario, and the right is from the vaccination scenario. The maps were made by leaflet package in R (Joe et al., 2017).

References

    1. Barzaga NG. A review of Japanese Encephalitis cases in the Philippines (1972-1985) The Southeast Asian Journal of Tropical Medicine and Public Health. 1990;20:587–592. - PubMed
    1. Bista MB, Banerjee MK, Shin SH, Tandan JB, Kim MH, Sohn YM, Ohrr HC, Tang JL, Halstead SB. Efficacy of single-dose SA 14-14-2 vaccine against japanese encephalitis: a case control study. The Lancet. 2001;358:791–795. doi: 10.1016/S0140-6736(01)05967-0. - DOI - PubMed
    1. Buescher EL, Scherer WF. Ecologic studies of japanese encephalitis virus in japan. The American Journal of Tropical Medicine and Hygiene. 1959;8:719–722. doi: 10.4269/ajtmh.1959.8.719. - DOI - PubMed
    1. Burke DS, Leake CJ. Japanese encephalitis. WHO-Recommended Standards for Surveillance of Selected Vaccine-Preventable Diseases. 1988 https://doi.org/WHO/V&B/03.01
    1. Campbell G, Hills S, Fischer M, Jacobson J, Hoke C, Hombach J, Marfin A, Solomon T, Tsai T, Tsui V, Ginsburg A. Estimated global incidence of japanese encephalitis: Bulletin of the World Health Organization. 2011;89:766–774. doi: 10.2471/BLT.10.085233. - DOI - PMC - PubMed

Publication types

Substances