. 2020 May 25;11(1):2604.
doi: 10.1038/s41467-020-16409-z.

Activin-mediated alterations of the fibroblast transcriptome and matrisome control the biomechanical properties of skin wounds

Affiliations

Activin-mediated alterations of the fibroblast transcriptome and matrisome control the biomechanical properties of skin wounds

Mateusz S Wietecha et al. Nat Commun. .

Abstract

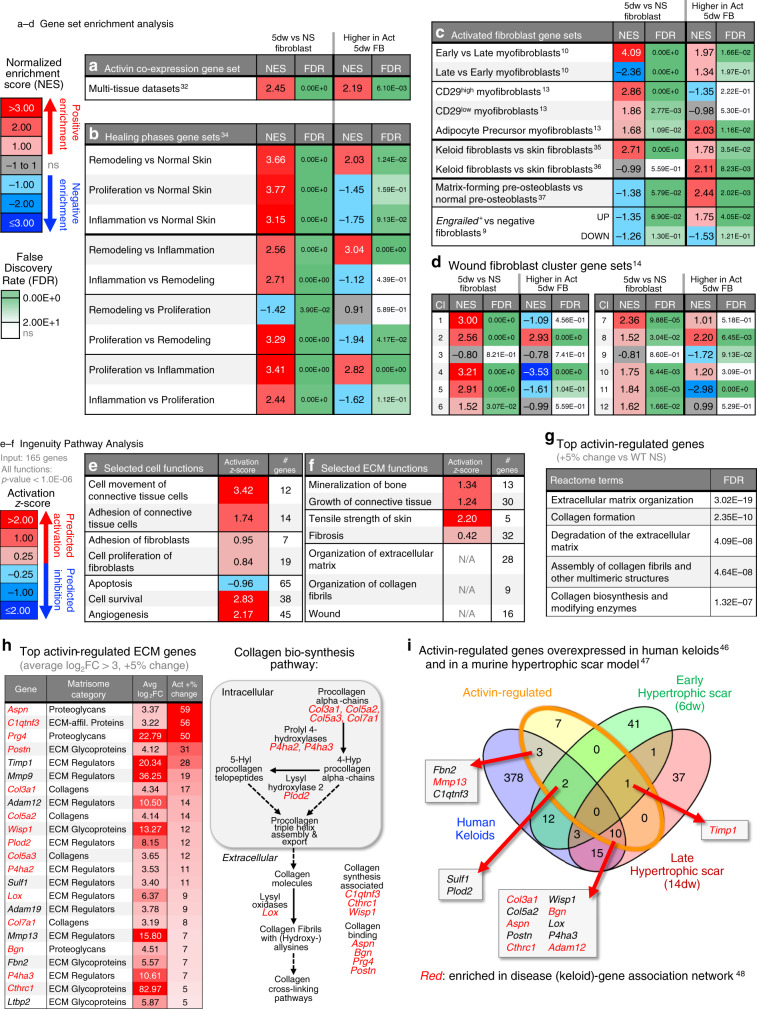
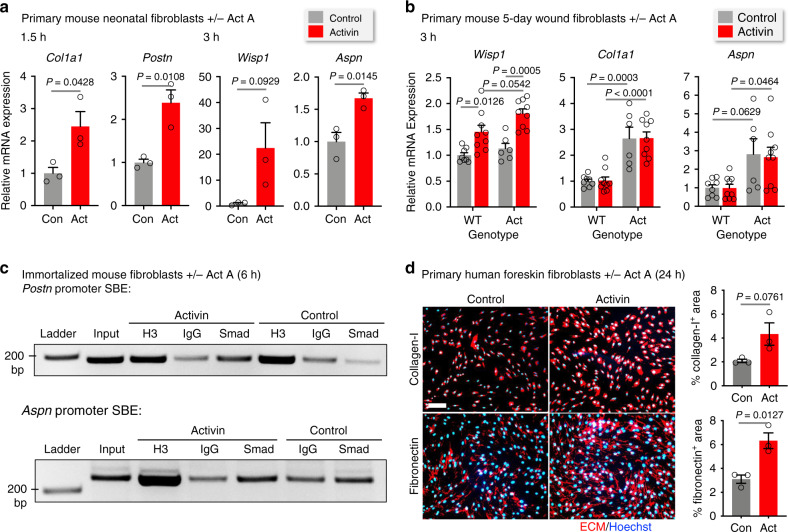
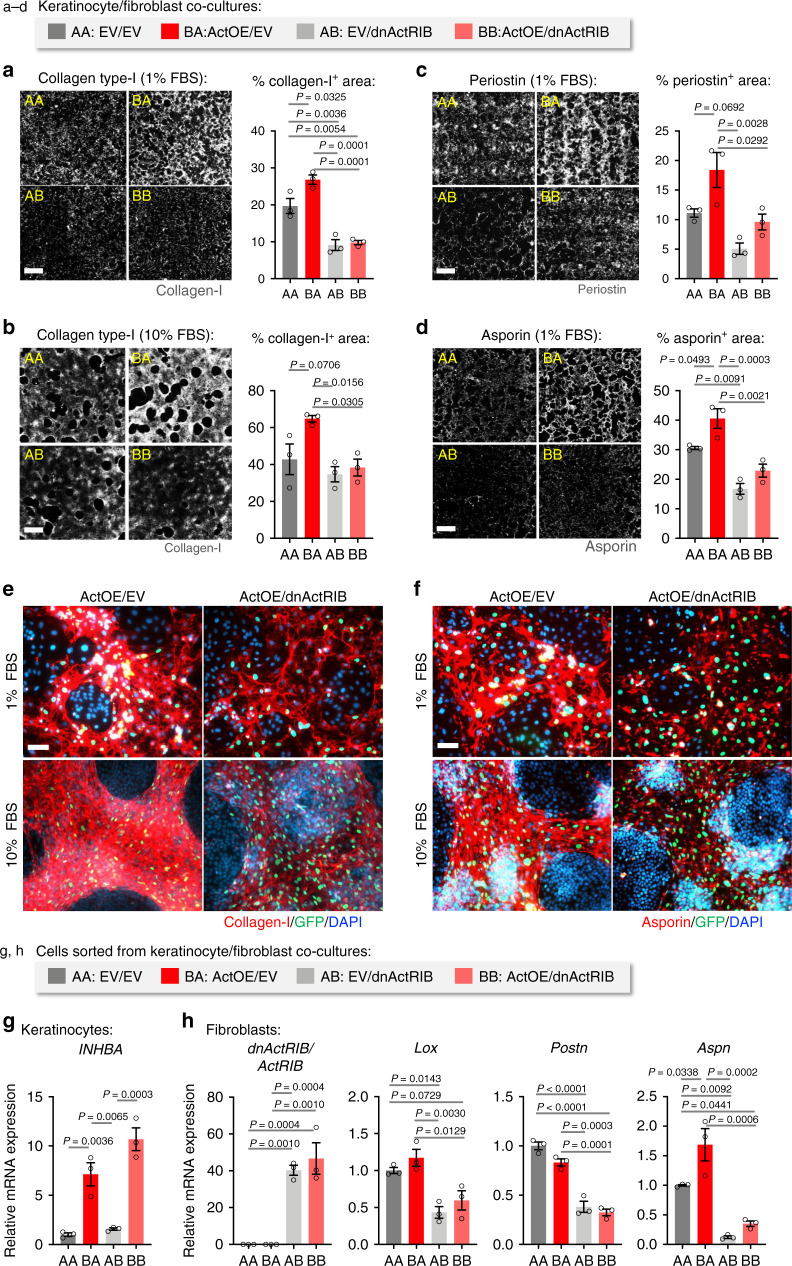
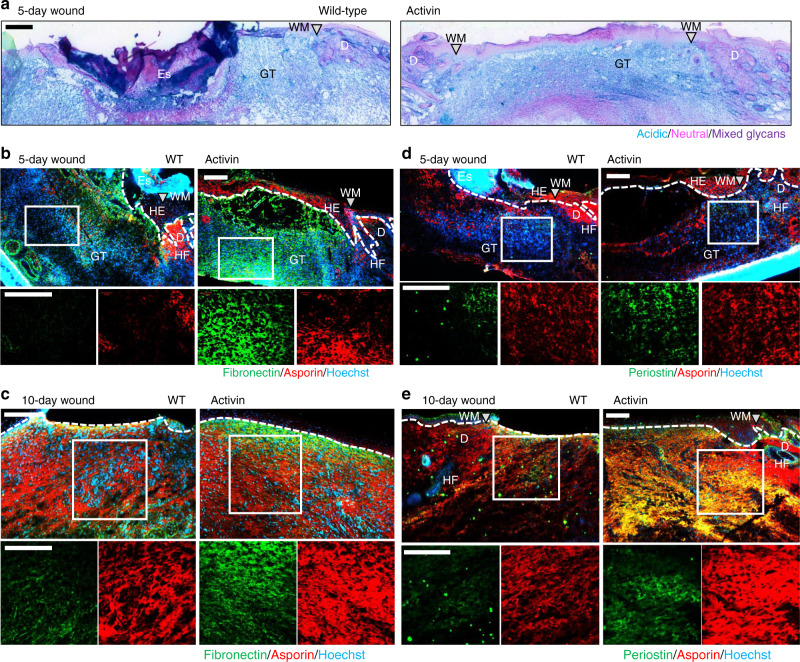
Matrix deposition is essential for wound repair, but when excessive, leads to hypertrophic scars and fibrosis. The factors that control matrix deposition in skin wounds have only partially been identified and the consequences of matrix alterations for the mechanical properties of wounds are largely unknown. Here, we report how a single diffusible factor, activin A, affects the healing process across scales. Bioinformatics analysis of wound fibroblast transcriptome data combined with biochemical and histopathological analyses of wounds and functional in vitro studies identify that activin promotes pro-fibrotic gene expression signatures and processes, including glycoprotein and proteoglycan biosynthesis, collagen deposition, and altered collagen cross-linking. As a consequence, activin strongly reduces the wound and scar deformability, as identified by a non-invasive in vivo method for biomechanical analysis. These results provide mechanistic insight into the roles of activin in wound repair and fibrosis and identify the functional consequences of alterations in the wound matrisome at the biomechanical level.


Conflict of interest statement

The authors declare no competing interests.

Figures

Fig. 1
Fig. 1. Activin promotes collagen deposition and maturation in healing skin wounds.
a Representative photomicrographs of Herovici-stained sections of 5-, 7-, 10-, and 14-day wounds from WT and Act mice. Yellow dotted line represents extent of hyperproliferative wound epidermis; red dotted line represents extent of open wound; green dotted line represents area of granulation tissue. b Left: Number of closed (fully re-epithelialized) or open wounds. n = 10 for WT, n = 9 for Act mice. Right: Granulation tissue area. n = 7 for WT, n = 8 for Act mice. c Quantification of young, mature, and total collagen density in skin wounds. n = 7, 11, 12, 11 for WT, n = 6, 11, 10, 8 for Act mice, for 5-, 7-, 10-, or 14-day wounds, respectively. &P < 0.10, *P < 0.05, #P < 0.05 (total collagen) for Act vs WT at each time point. d Length of granulation tissue/scar tissue in 10- and 21-day wounds. n = 12 for WT, n = 9 for Act mice (10d), and n = 11 for WT, n = 10 for Act mice (21d). e Representative photomicrographs of Picrosirius Red-stained sections from 5-day wounds with insets for corresponding areas in wound edge (i, ii) and wound center (iii, iv). f Quantification of collagen fiber types at the wound edges relative to total collagen (left) and in the wound centers relative to GT area (right). n = 4 for both genotypes. &P < 0.10, *P < 0.05, #P < 0.05 (total collagen) for Act vs WT. Graphs show mean ± SEM and P values; two-sided Chi-square test (b left), two-tailed Student's t-test (b right, c, d, f); see Supplementary Fig. 1a, b for all individual comparisons and P values in c and f. All n numbers indicate biological replicates. Gray triangles represent wound margins (WM); HE hyperproliferative epithelium, HF hair follicle, D dermis, Es eschar, GT granulation tissue. Scale bars: 500 µm. Source data are provided as a Source Data file (Fig. 1).
Fig. 2
Fig. 2. Wound fibroblasts exhibit a distinct transcriptional signature.
a Gating strategy for skin fibroblast isolation. b Quantification of fibroblast frequency relative to live cells in unwounded (normal) skin (NS) and in wounds of WT and Act mice. n = 6, 6, 9, 3 for WT, n = 6, 7, 9, 3 for Act, for NS, 3-, 5-, or 7-day wounds, respectively. c Left: Venn diagram showing the top 100 most highly expressed (by RPKM) genes in NS and 5-day wound fibroblasts. Right: Cell line enrichment analysis of the 77 overlapping genes via ARCHS4 (by enrichR), showing top five cell lines with enrichment of these genes; fibroblast-like cells are in bold. d Analysis of differentially expressed genes (DEGs). Left: Numbers of DEGs (false discovery rate (FDR) < 0.05) for all individual group comparisons. Right: Absolute expression of selected top-expressed (by RPKM) and top up-regulated (in 5dw vs NS comparisons) genes in the four groups. n = 3 for WT_NS, WT_5dw, Act_NS, n = 2 for Act_5dw. e Venn diagram showing the DEGs (FDR < 0.05) in all 5dw vs NS comparisons. Red circle shows the 556 genes shared between all comparisons. f 367 shared up-regulated DEGs from e (Log2FC > 1) were subjected to functional enrichment analysis using enrichR. Top 10 Gene Ontology (GO) Biological Processes are shown, with FDR and percentage of input out of total pathway genes (% genes). g Shared DEGs from e were subjected to Ingenuity Pathway Analysis (IPA). Selected annotated functions are shown with Activation Z-scores and numbers of input genes enriched in the respective functions (# genes). Z-score > 0 (red): predicted activation of function; Z-score < 0 (blue): predicted inhibition of function; P value < 9.0E-09 for all shown functions. h The 5-day wound fibroblast signature was subjected to GSEA against gene sets from wound myofibroblasts. Normalized Enrichment Scores (NES) and FDR values are shown; NES > 1: positive enrichment (red), NES < −1: negative enrichment (blue); FDR are color coded based on statistical significance (green). Wound myofibroblast gene sets include genes up/down-regulated in ɑ-SMA+ myofibroblasts from 7-day small excisional wounds; genes up-regulated in ɑ-SMA+ myofibroblasts from 12- or 26-day large excisional wounds and CD29high, CD29low, or adipocyte precursor myofibroblasts from 5-day small excisional wounds. Graphs show mean±SEM and P values; two-way ANOVA and Bonferroni’s multiple comparison post hoc tests (a). All n numbers indicate biological replicates. Source data are provided as a Source Data file (Fig. 2).
Fig. 3
Fig. 3. Activin induces a pro-fibrotic gene expression signature in fibroblasts.
a–d Genes regulated in 5dw vs NS fibroblasts and pre-ranked list of genes relatively up-regulated in Act 5dw/WT NS vs WT 5dw/WT NS (see Supplementary Fig. 3a, b) were subjected to GSEA against custom gene sets. NES and FDR values are shown. FDR are color-coded based on statistical significance (green). a Activin co-expression gene set derived from the SEEK database of multi-tissue gene expression datasets. b Healing phase gene sets derived from microarray data of small excisional mouse wounds at different healing time points. c Activated fibroblast gene sets include genes up-regulated in: (i) ɑ-SMA-positive myofibroblasts from 12- or 26-day large excisional wounds; (ii) CD29high, CD29low, or adipocyte precursor myofibroblasts from 5-day small excisional wounds; (iii) human keloid vs normal skin fibroblasts,; (iv) matrix-forming vs normal pre-osteoblasts; and genes up- or down-regulated in scar-forming engrailed+ vs engrailed fibroblasts. d Twelve wound fibroblast cluster gene sets identified by single-cell RNA sequencing of fibroblasts from 12-day large excisional wounds. e, f Genes relatively up-regulated in 5dw of Act mice were subjected to IPA. Selected annotated cell functions (e) and ECM functions (f) were extracted and are shown with respective activation Z-scores and numbers of input genes enriched in the respective functions (# genes). P value < 1.0E-06 for all shown functions. g Top activin-regulated genes (at least 5% change vs WT NS) were subjected to functional enrichment analysis using enrichR, and the top five Reactome terms are shown with respective FDR values. h Top activin-regulated genes (more than 5% change vs WT) were filtered by the Matrisome database. Left: Top up-regulated (in 5dw vs NS, log2FC > 3, FDR < 0.05) ECM genes are shown with respective Matrisome category, average log2FC (5dw vs NS), and the relative increase in upregulation in Act vs WT 5dw fibroblasts (Act +% change). Numerical values are color coded based on magnitude (red background). Right: Genes in red are associated with the collagen biosynthesis pathway. i Venn diagram comparison of activin-regulated ECM genes (orange oval) and genes significantly overexpressed in keloids (blue oval) and in a murine hypertrophic scar model (6-day wound, green oval; 14-day wound, red oval), with additional enrichment in the keloid gene association network, red text). Source data are provided as a Source Data file (Fig. 3).
Fig. 4
Fig. 4. Activin directly regulates pro-fibrotic ECM gene expression in fibroblasts.
a qRT-PCR (relative to Rps29) using RNA from primary murine neonatal fibroblasts treated with activin A (20 ng/ml) or vehicle for 1.5 and 3 h. n = 3. b qRT-PCR using RNA from murine fibroblasts from 5-day wounds of adult WT and Act mice treated with activin A (20 ng/ml) or vehicle for 3 h. n = 8, 9, 6, 9 for WT-control, WT-Activin, Act-Control, and Act-Activin, respectively. c Chromatin immunoprecipitation from lysates of immortalized mouse fibroblasts treated with activin A (20 ng/ml) or vehicle for 6 h. Antibodies against anti-histone H3 (H3) or Smad2/3 (Smad) or normal rabbit IgG (IgG) were used. The bound DNA was amplified using primers spanning conserved Smad-binding elements (SBEs) in the promoter regions of Postn and Aspn (see Supplementary Fig. 4b). Representative agarose gels are shown, with the size marker and respective inputs. The experiment was repeated twice with similar results (see also Supplementary Fig. 4c). d Representative photomicrographs of human primary foreskin fibroblasts treated with activin A (20 ng/ml) or vehicle for 24 h and stained for collagen type I or fibronectin (red) (nuclei were counterstained with Hoechst (blue)). Bar graphs show quantification of the percentage of the stained area. Scale bars: 200 μm. n = 3. Graphs show mean ± SEM and P values; mean expression levels in control cells (a) or control cells in WT mice (b) were set to 1; two-tailed Student's t-test (a, d), one-way ANOVA and Tukey’s multiple comparison post hoc tests (b). All n numbers indicate biological replicates. Source data are provided as a Source Data file (Fig. 4).
Fig. 5
Fig. 5. Activin regulates pro-fibrotic ECM deposition by fibroblasts.
ad HaCaT keratinocytes transduced with lentiviruses allowing Dox-inducible overexpression of INHBA (ActOE) or empty vector (EV) were co-cultured with murine immortalized fibroblasts (GFP-expressing) transduced with lentiviruses allowing Dox-inducible expression of dnActRIB or with EV-transduced fibroblasts for 7 days in 1% or 10% FBS. Co-cultures were stained for collagen type I (a, b), periostin, and asporin (c, d). The experiment was repeated twice with similar results. Representative photomicrographs of ECM staining for each group. Bar graphs show quantification of the percentage of the stained area on whole co-culture coverslips. Scale bars: 1000 μm. n = 3. e, f Representative high magnification photomicrographs of collagen type I (e) and asporin (f) staining of ActOE/EV and ActOE/dnActRIB co-cultures in the presence of 1% or 10% FBS. GFP-positive fibroblasts are shown (green); nuclei were counterstained with DAPI (blue). Scale bars: 100 μm. g, h GFP-expressing fibroblasts were sorted from GFP-negative HaCaT keratinocytes after 8 days co-culture, and gene expression was analyzed by qRT-PCR relative to RPL27 for keratinocytes (g) or Rps29 for fibroblasts (h). n = 3. The experiment was repeated twice with similar results. Graphs show mean ± SEM and P values; mean expression levels in AA cultures were set to 1 in g and h; one-way ANOVA and Tukey’s multiple comparison post hoc tests (ad, g, h). All n numbers indicate biological replicates. AA, EV/EV; BA, ActOE/EV; AB, EV/dnActRIB; BB, ActOE/dnActRIB. Source data are provided as a Source Data file (Fig. 5).
Fig. 6
Fig. 6. Activin promotes deposition of wound glycoproteins and proteoglycans.
a Representative photomicrographs of Alcian Blue/PAS-stained 5-day wounds show larger areas of acidic (blue) glycans in the wound center of Act vs WT mice. be Representative photomicrographs of sections from 5-day (b, d) and 10-day wounds (c, e) of WT and Act mice stained with antibodies against fibronectin (green) and asporin (red) (b, c) or periostin (green) and asporin (red) (d, e). Nuclei were counterstained with Hoechst (blue). Insets indicate the areas within the wound bed centers that are shown at higher magnification below. Stainings were performed on n = 5 wounds from five mice for 5-day wounds and n = 3 for 10-day wounds with similar results. Gray triangles represent wound margins (WM); HE hyperproliferative epithelium, HF hair follicle, D dermis, Es eschar, GT granulation tissue. White dotted lines indicate the border between the dermis/granulation tissue and the epidermis or wound epithelium. Scale bars: 200 μm.
Fig. 7
Fig. 7. Activin promotes collagen maturation in healing wounds.
Biochemical analysis of collagen and non-collagenous proteins using whole lysate from unwounded skin (NS) and from wounds at day 3, 5, 10, and 42 post-injury. a Amount of total collagen per sample. b Amount of total non-collagenous protein per sample. c Amount of collagen per total protein relative to NS (gray dashed line). d Diagram outlining the collagen cross-linking initiation and maturation pathways (adapted from ref. ), the enzymes that are responsible for the number (LOX) and the pattern (LH2) of the cross-links, and the cross-links quantified in our analysis. Modifications that are increased in wounds of Act mice are in red. e Hylald/Lysald ratio relative to NS (gray dashed line). f DHLNL/collagen ratio relative to NS (gray dashed line). g DHLNL/HLNL cross-link ratio. Graphs show mean ± SEM and P values; n = 9 biological replicates for mice of both genotypes at all time points; two-way ANOVA and Bonferroni’s multiple comparison post hoc tests; results of two-way ANOVA are shown below each graph (first factor: time point, second factor: activin overexpression). HLCC hydroxylysine aldehyde derived collagen cross-links, LCC lysine aldehyde-derived collagen cross-links, Lys lysine, Hyl hydroxylysine, LH lysyl hydroxylase, LOX lysyl oxidase, Lysald lysine aldehyde, Hylald hydroxylysine aldehyde, ACP aldol condensation product, HLNL hydroxylysinonorleucine, DHLNL dihydroxylysinonorleucine, HHMD histidinohydroxymerodesmosine, LP lysylpyridinoline, HP hydroxylysylpyridinoline. Source data are provided as a Source Data file (Fig. 7).
Fig. 8
Fig. 8. Activin affects the biomechanical properties of skin wounds.
a Representative photographs of wounds from WT and Act mice at different days post-injury; scale bar: 2 mm. b Quantification of visible wound and scar lengths (see Supplementary Fig. 8b, d). n = 24, 10, 12, 14, 16, 12 for WT and n = 22, 6, 10, 8, 12, 8 for Act mice in 3-, 5-, 7-, 10-, 14-, or 21-day wounds, respectively. c Rates of wound length change; green dashed line: no change. Left: Rates using averaged values of pooled wounds. Right: Rates using individual wounds, which were tracked across multiple consecutive time points; n = 10 for WT and n = 6 for Act mice for all time points. d Quantification of wound functional length (see Supplementary Fig. 8e); green dashed line indicates the 5 mm diameter of the biopsy punch. For n numbers, see b. e Graph of the ratios of average functional length to corresponding average wound length; green dashed line indicates equal length of functional and visible wounds. f Color maps demonstrating in vivo deformability of wounded tissues (see Supplementary Fig. 8f); scale bar: 2 mm. g Quantification of in vivo wound strain; green dashed line indicates the behavior of unwounded skin. For n numbers, see b. h Ratio of average deformation of wounds from WT to Act mice. i Rates of localized wound deformation change using averaged values of pooled wounds; green dashed line: no change. j Local scar deformability at day 21 post-injury based on ex vivo tensile tests on uniaxial tissue specimens; 10% deformation of the unwounded skin region (green dashed line) is shown for comparison. n = 9 for WT and n = 6 for Act mice. k Tensile strength of WT NS (green line ±SEM) and 21-day scars of WT and Act mice. n = 8 for WT NS (from ref. ), n = 10 for WT and n = 6 for Act mice. Graphs show mean ± SEM and P values, with comparisons to NS indicated by #; two-way ANOVA and Bonferroni’s multiple comparison post hoc tests (b, c right, d, g), results of two-way ANOVAs are shown below each graph (first factor: time point, second factor: activin overexpression), cf. Supplementary Table 1 for statistical comparisons across time points; two-tailed Student's t-test (j); one-sample t-test vs NS value (10%) (g, j); one-way ANOVA and Tukey’s multiple comparison post hoc tests (k). All n numbers indicate biological replicates. Source data are provided as a Source Data file (Fig. 8).

References

    1. Martin P. Wound healing-aiming for perfect skin regeneration. Science. 1997;276:75–81. - PubMed
    1. Eming SA, Martin P, Tomic-Canic M. Wound repair and regeneration: mechanisms, signaling, and translation. Sci. Transl. Med. 2014;6:265–266. - PMC - PubMed
    1. Gurtner GC, Werner S, Barrandon Y, Longaker MT. Wound repair and regeneration. Nature. 2008;453:314–321. - PubMed
    1. Marshall CD, et al. Cutaneous scarring: basic science, current treatments, and future directions. Adv. Wound Care (N. Rochelle) 2018;7:29–45. - PMC - PubMed
    1. Werner S, Grose R. Regulation of wound healing by growth factors and cytokines. Physiol. Rev. 2003;83:835–870. - PubMed

Publication types

MeSH terms