. 2020 Jul;22(7):779-790.
doi: 10.1038/s41556-020-0525-9. Epub 2020 May 25.

Extracellular serine controls epidermal stem cell fate and tumour initiation

Affiliations

Extracellular serine controls epidermal stem cell fate and tumour initiation

Sanjeethan C Baksh et al. Nat Cell Biol. 2020 Jul.

Erratum in

Abstract

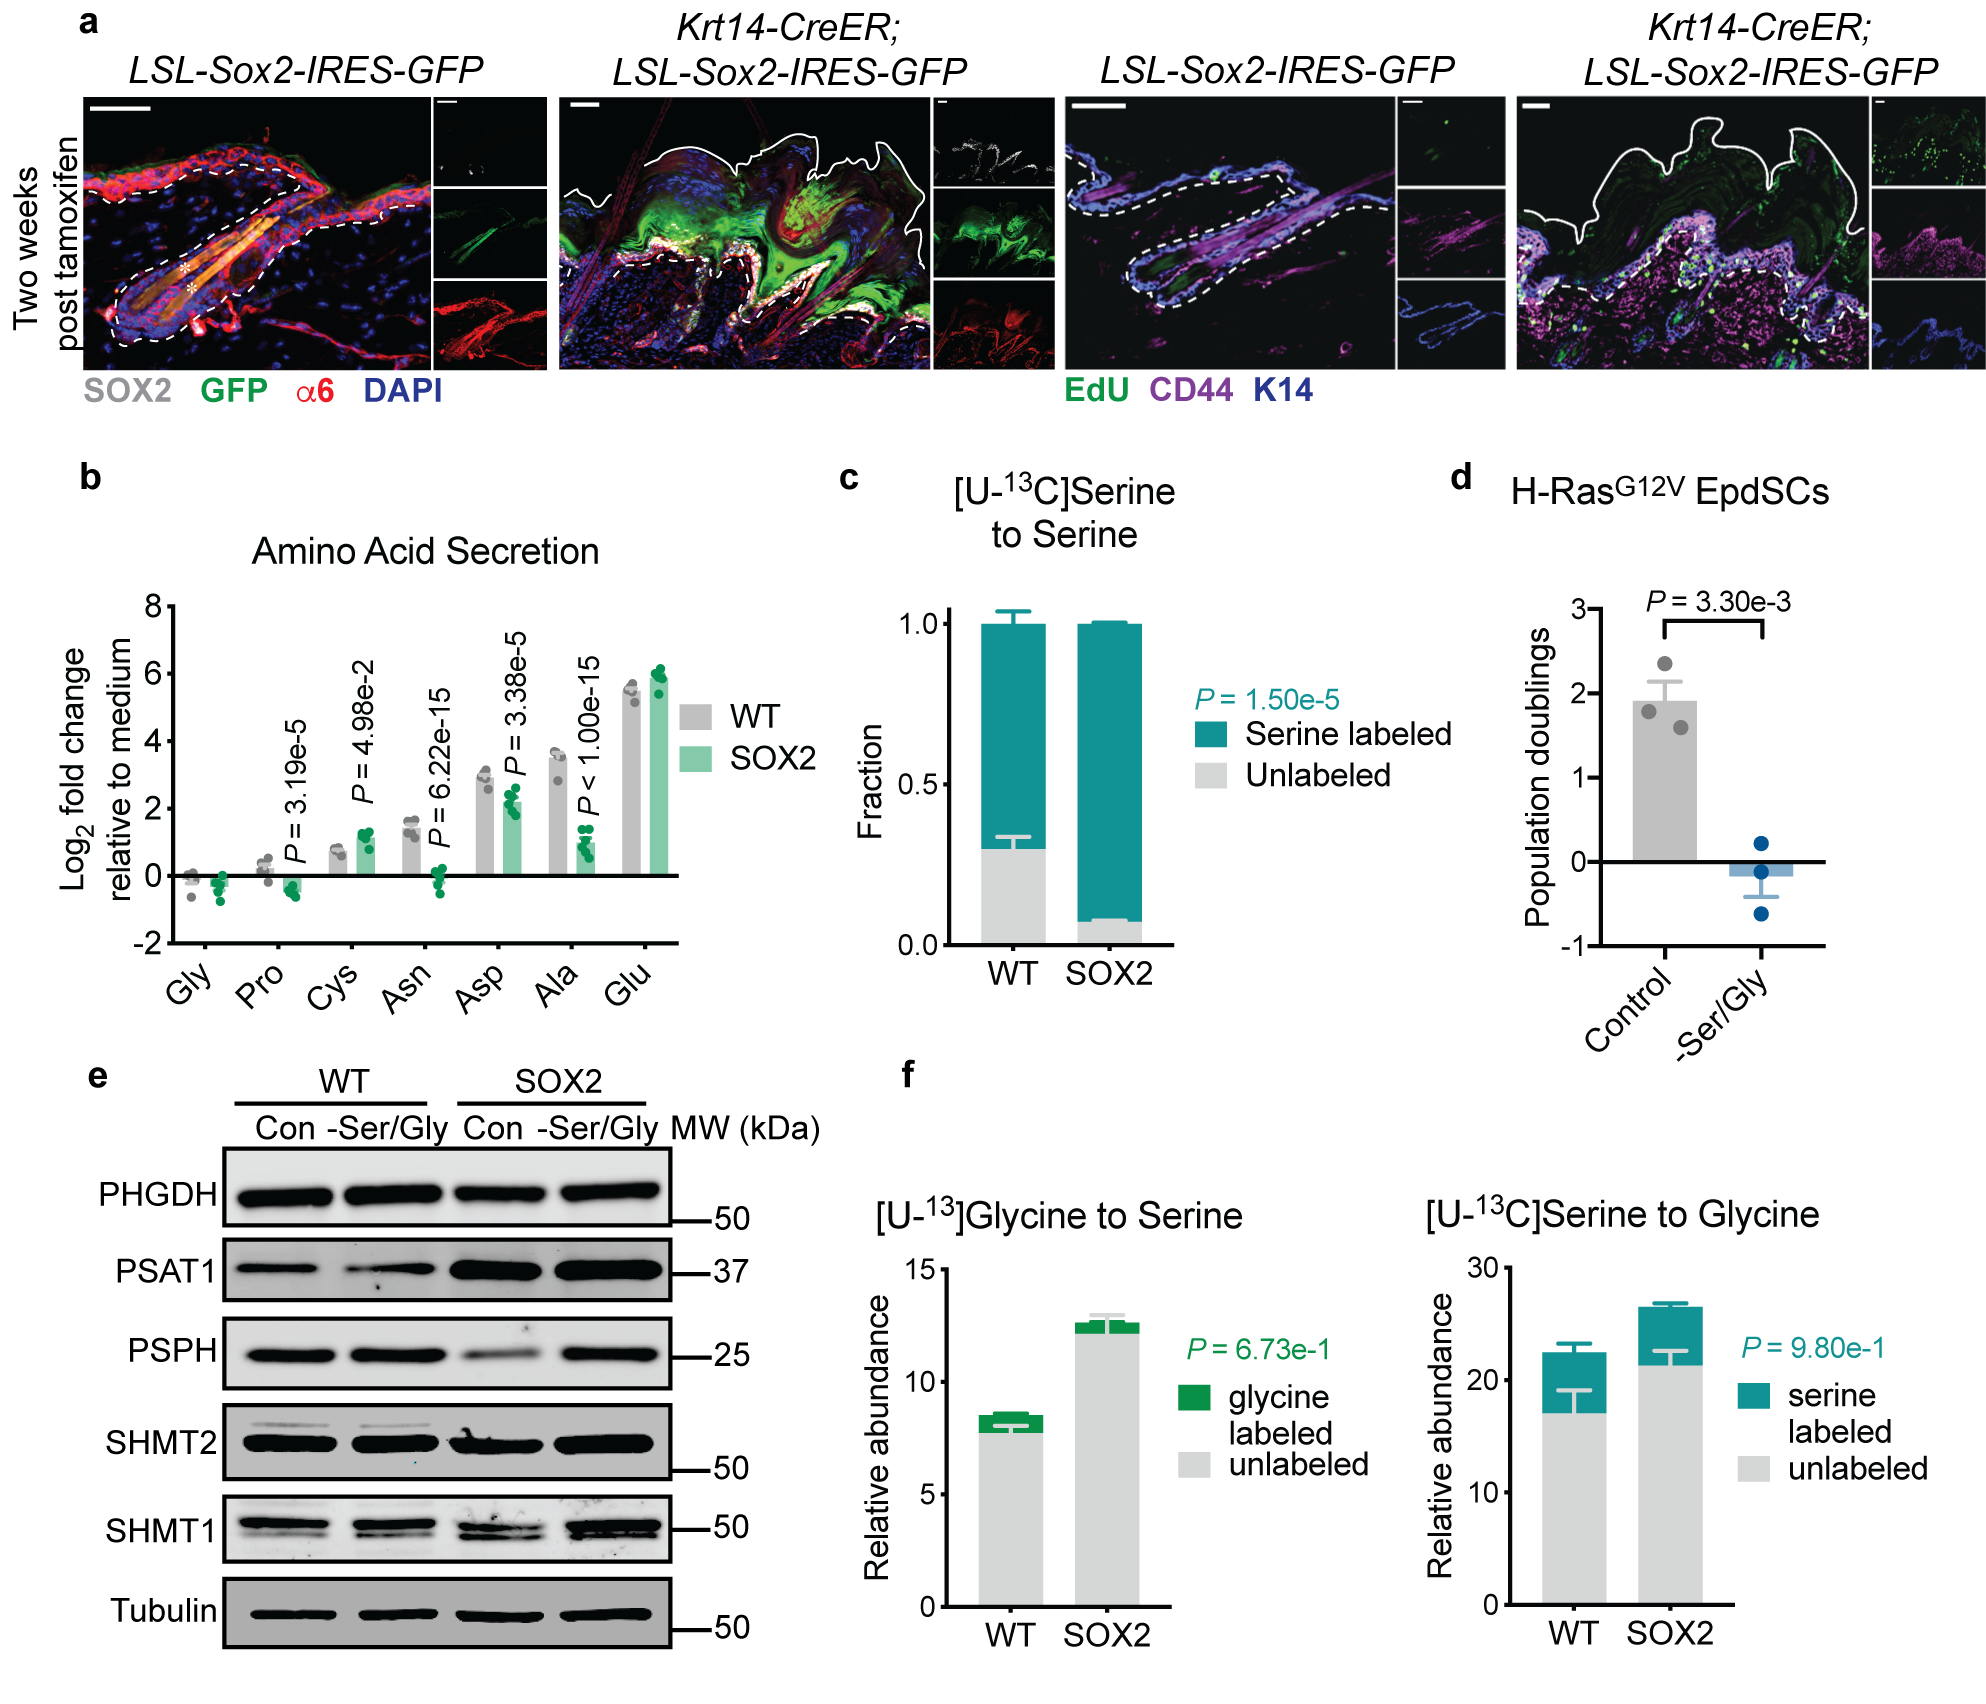
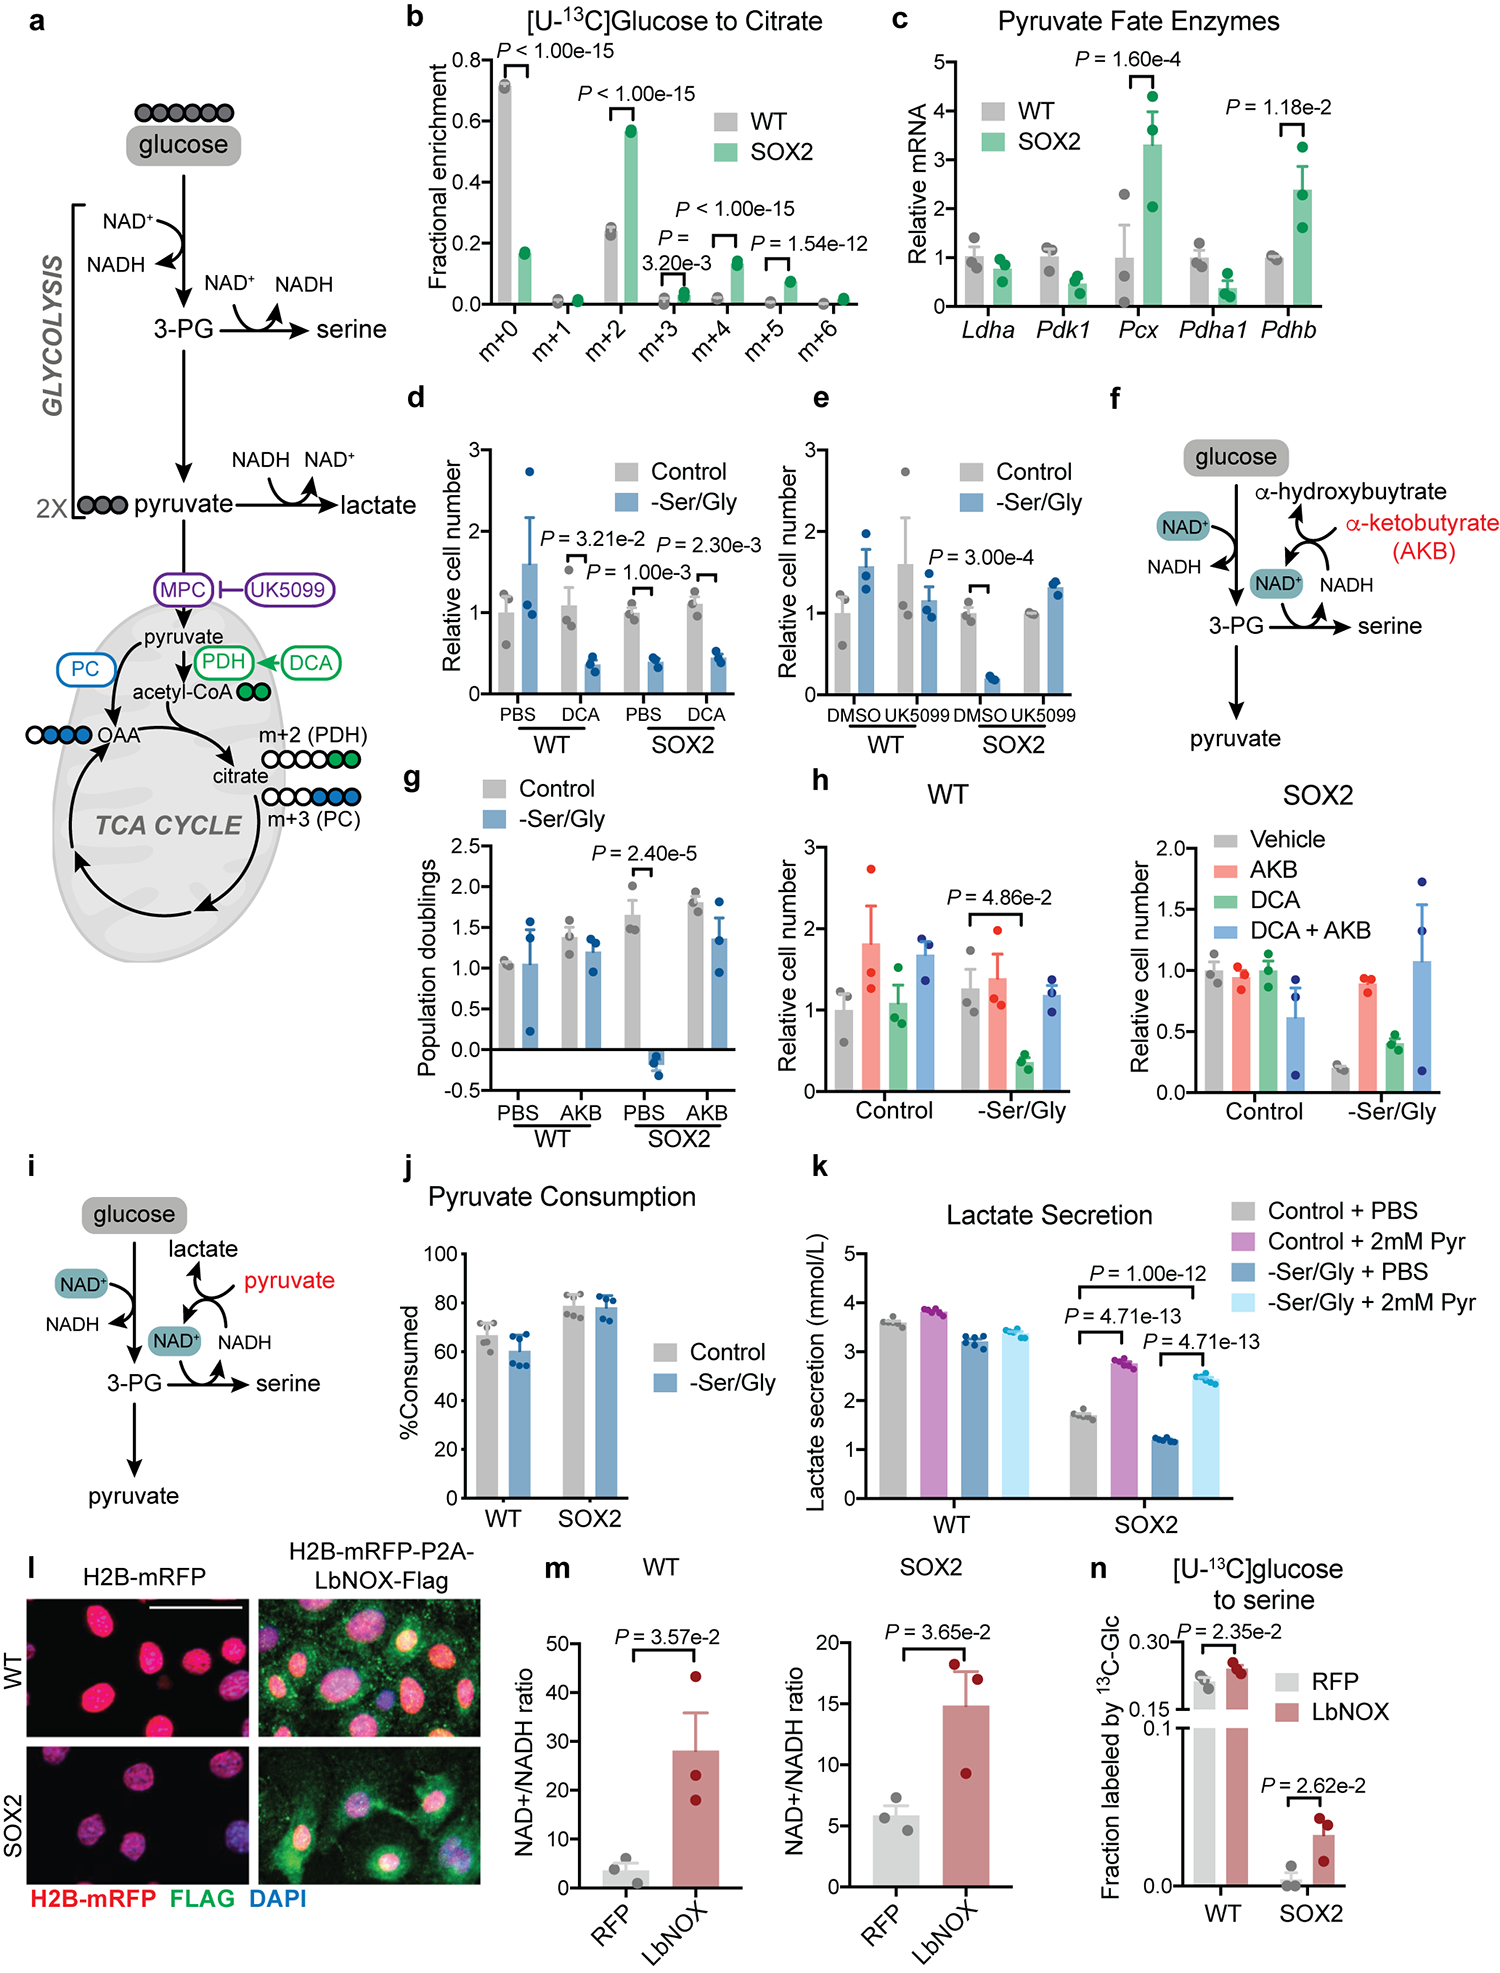
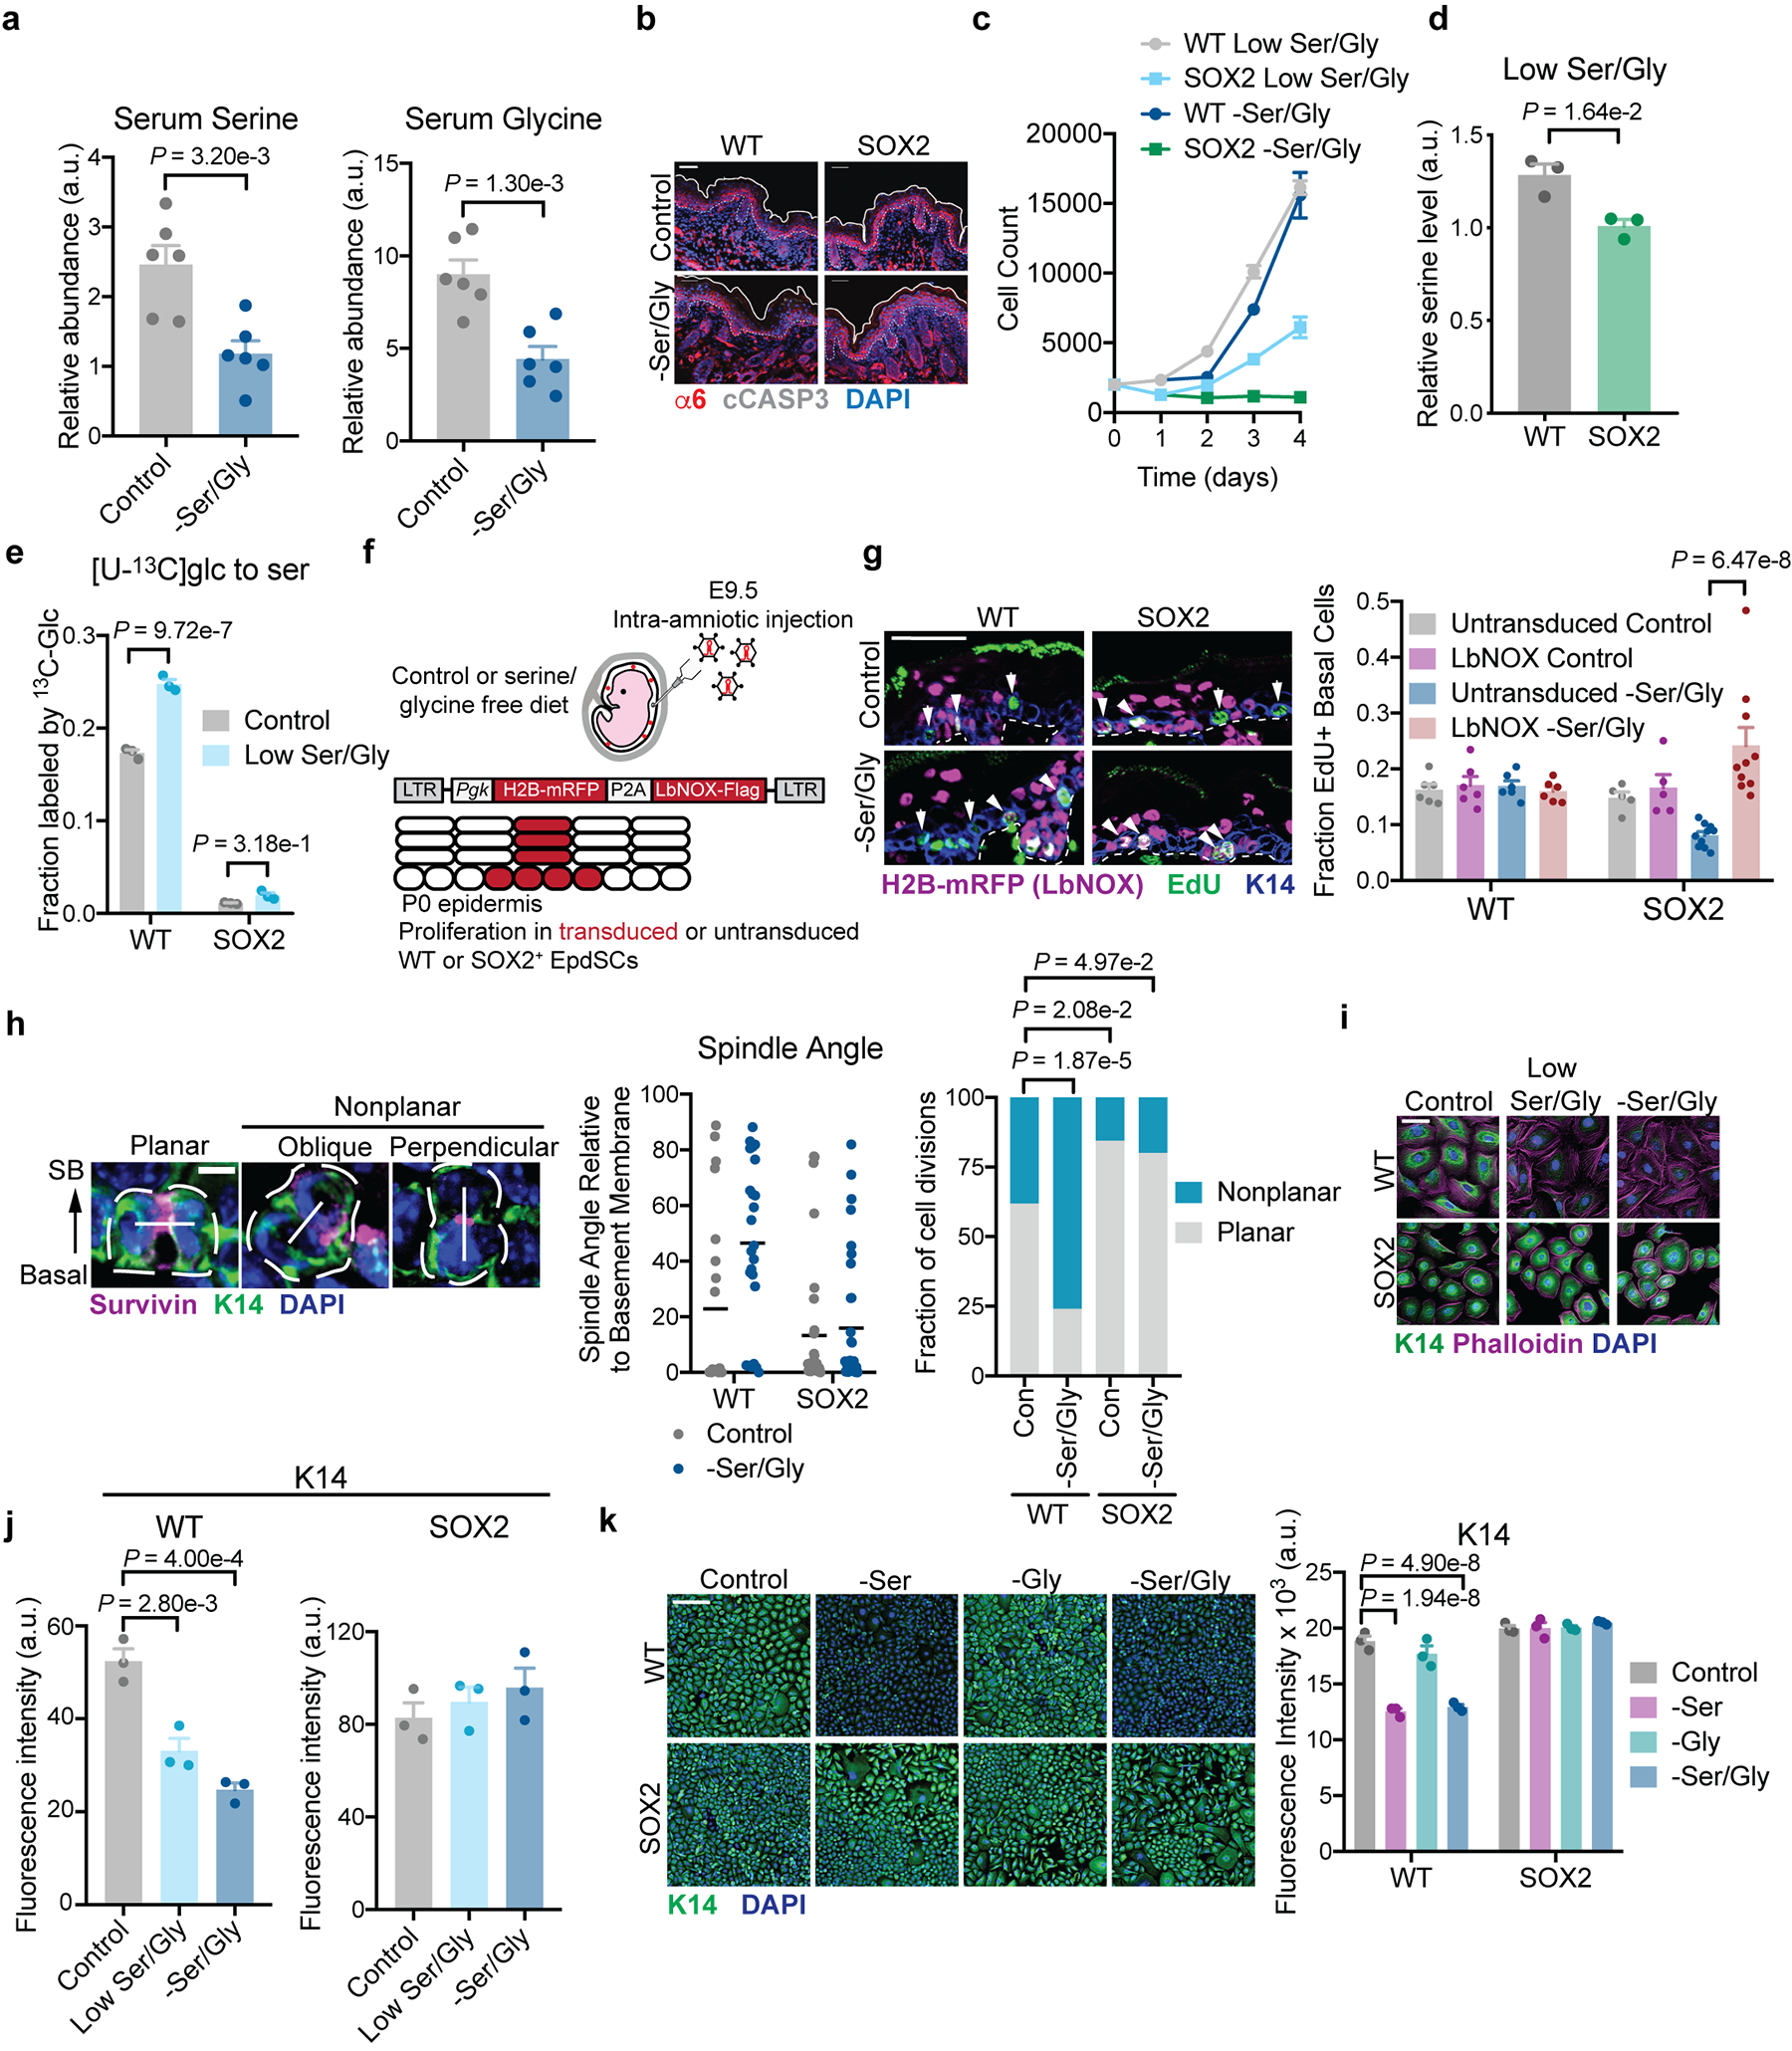
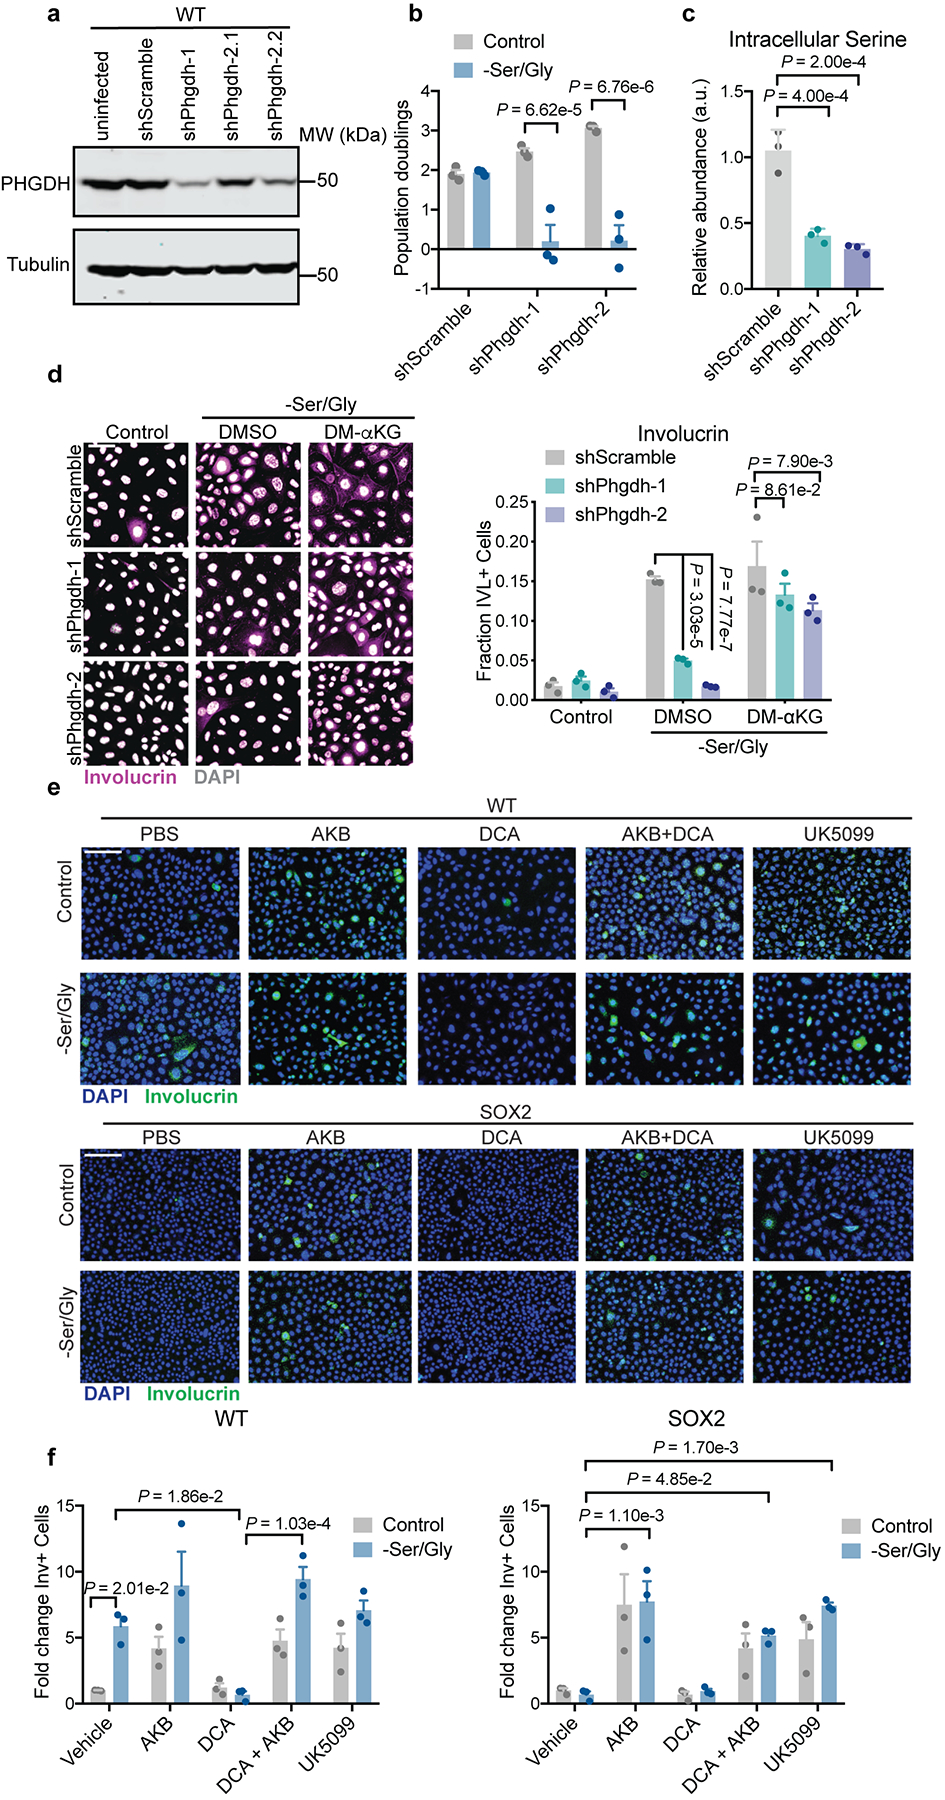
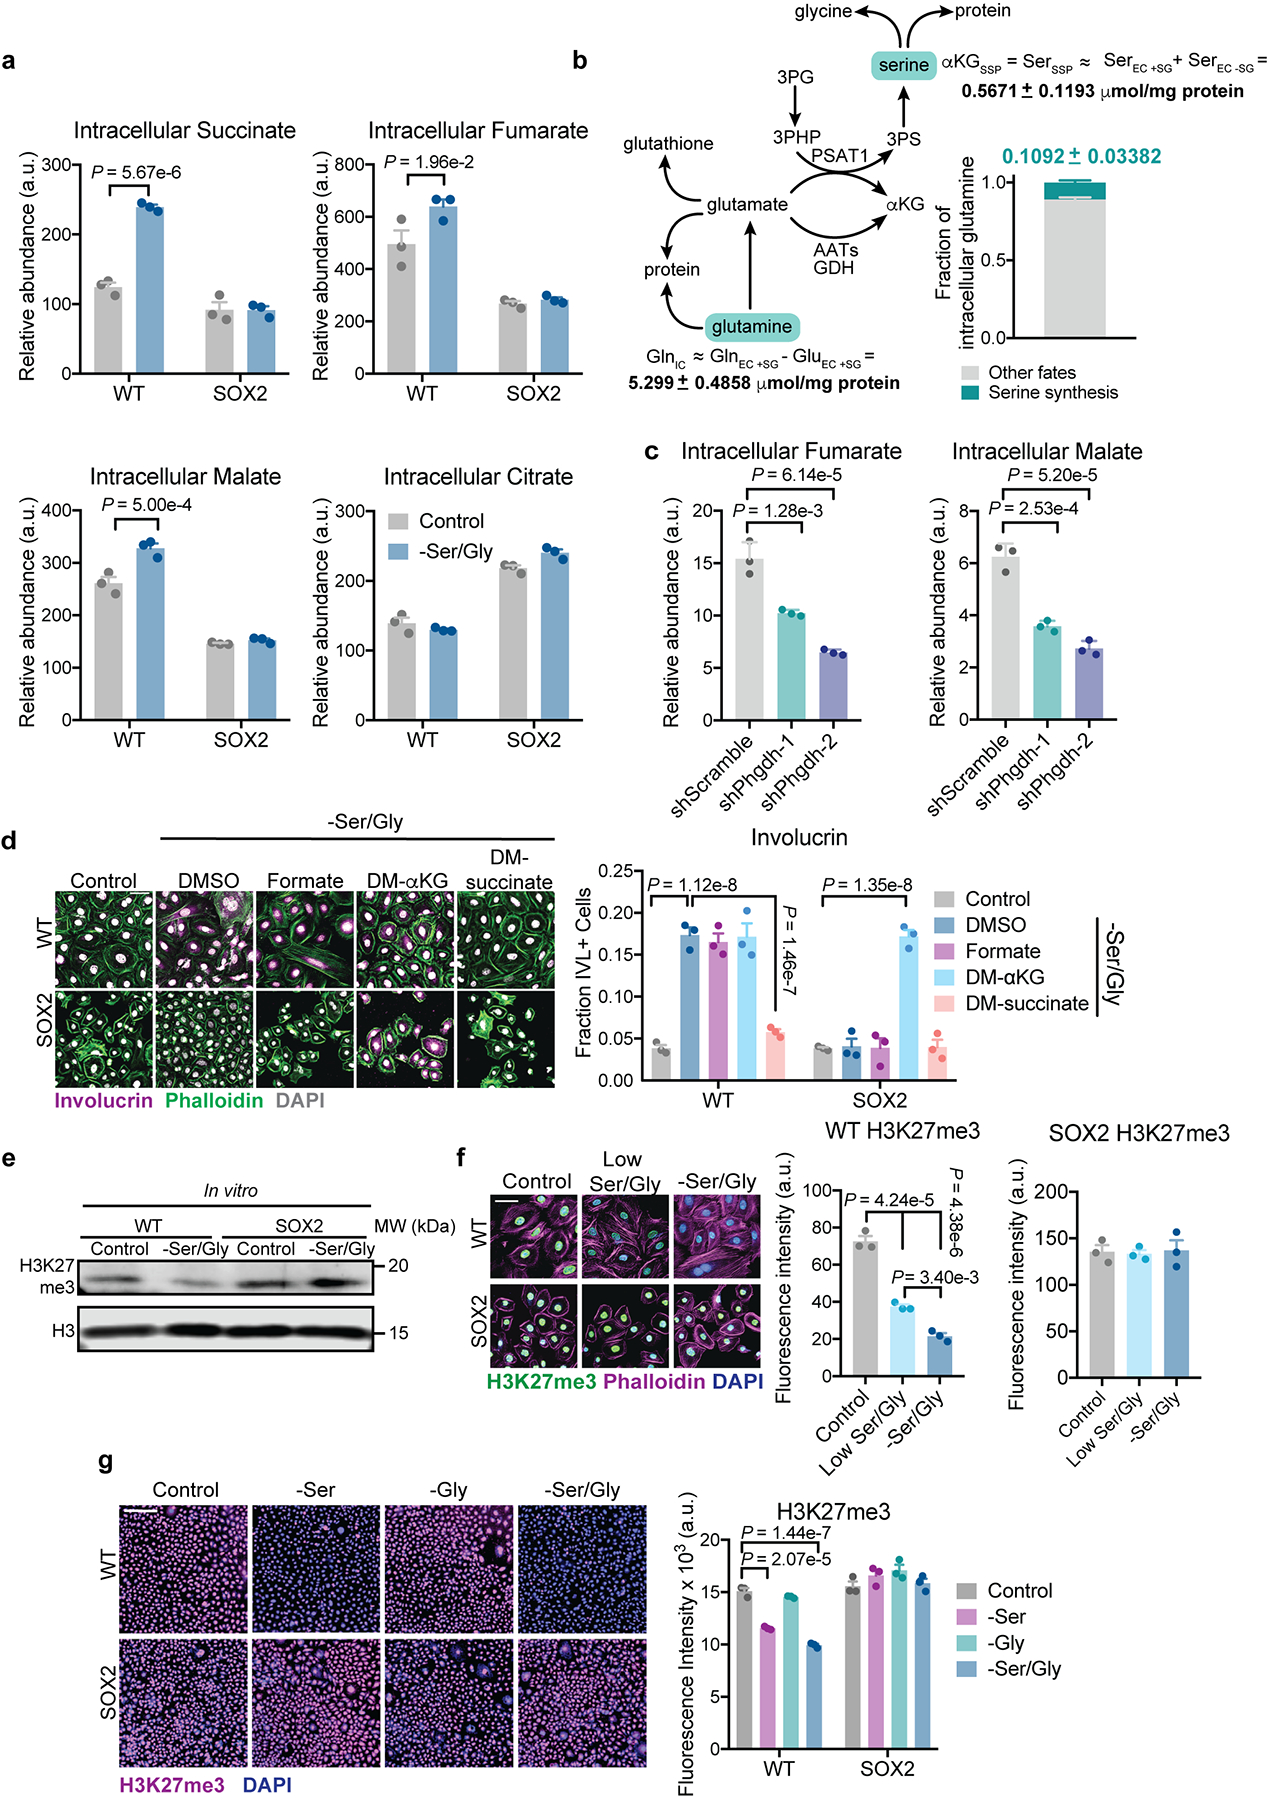
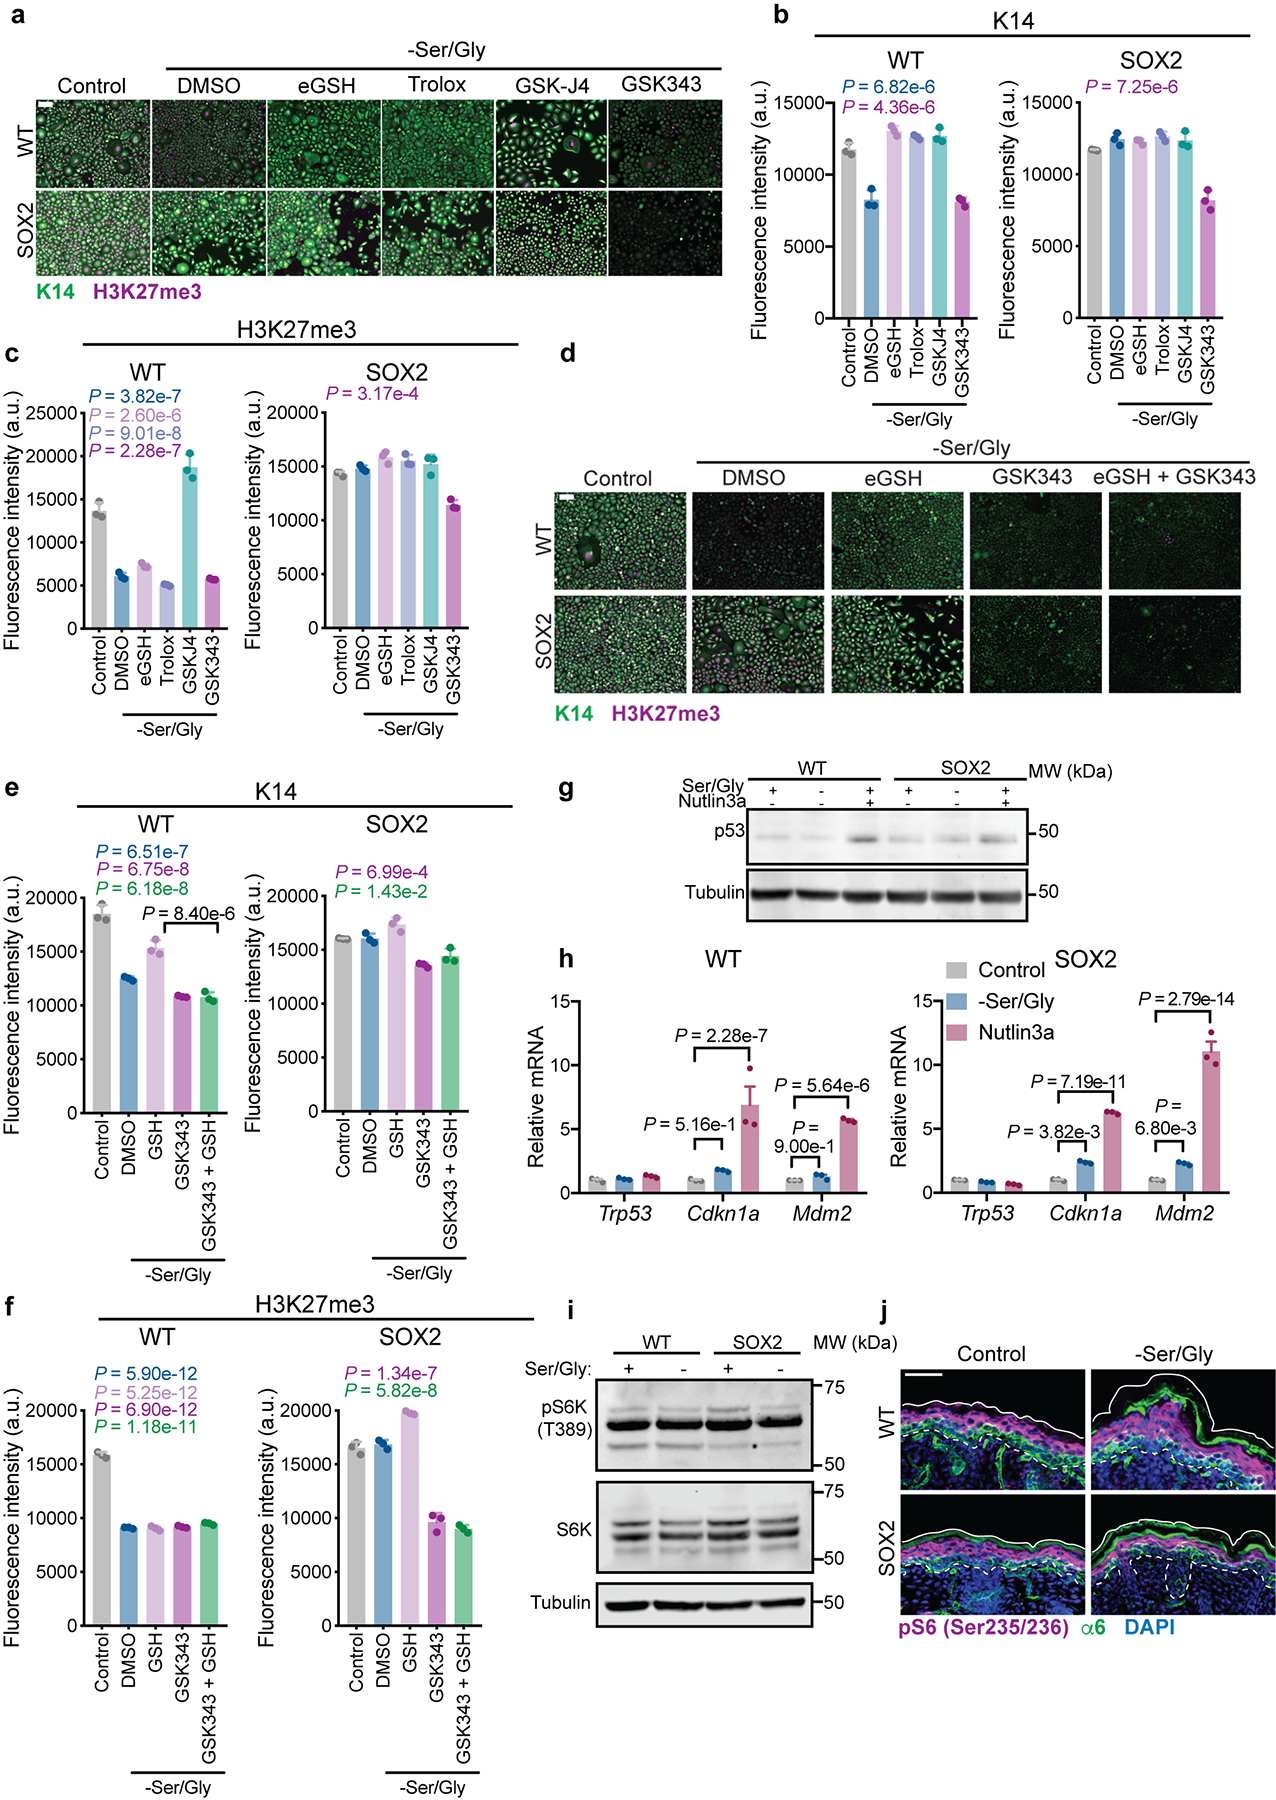
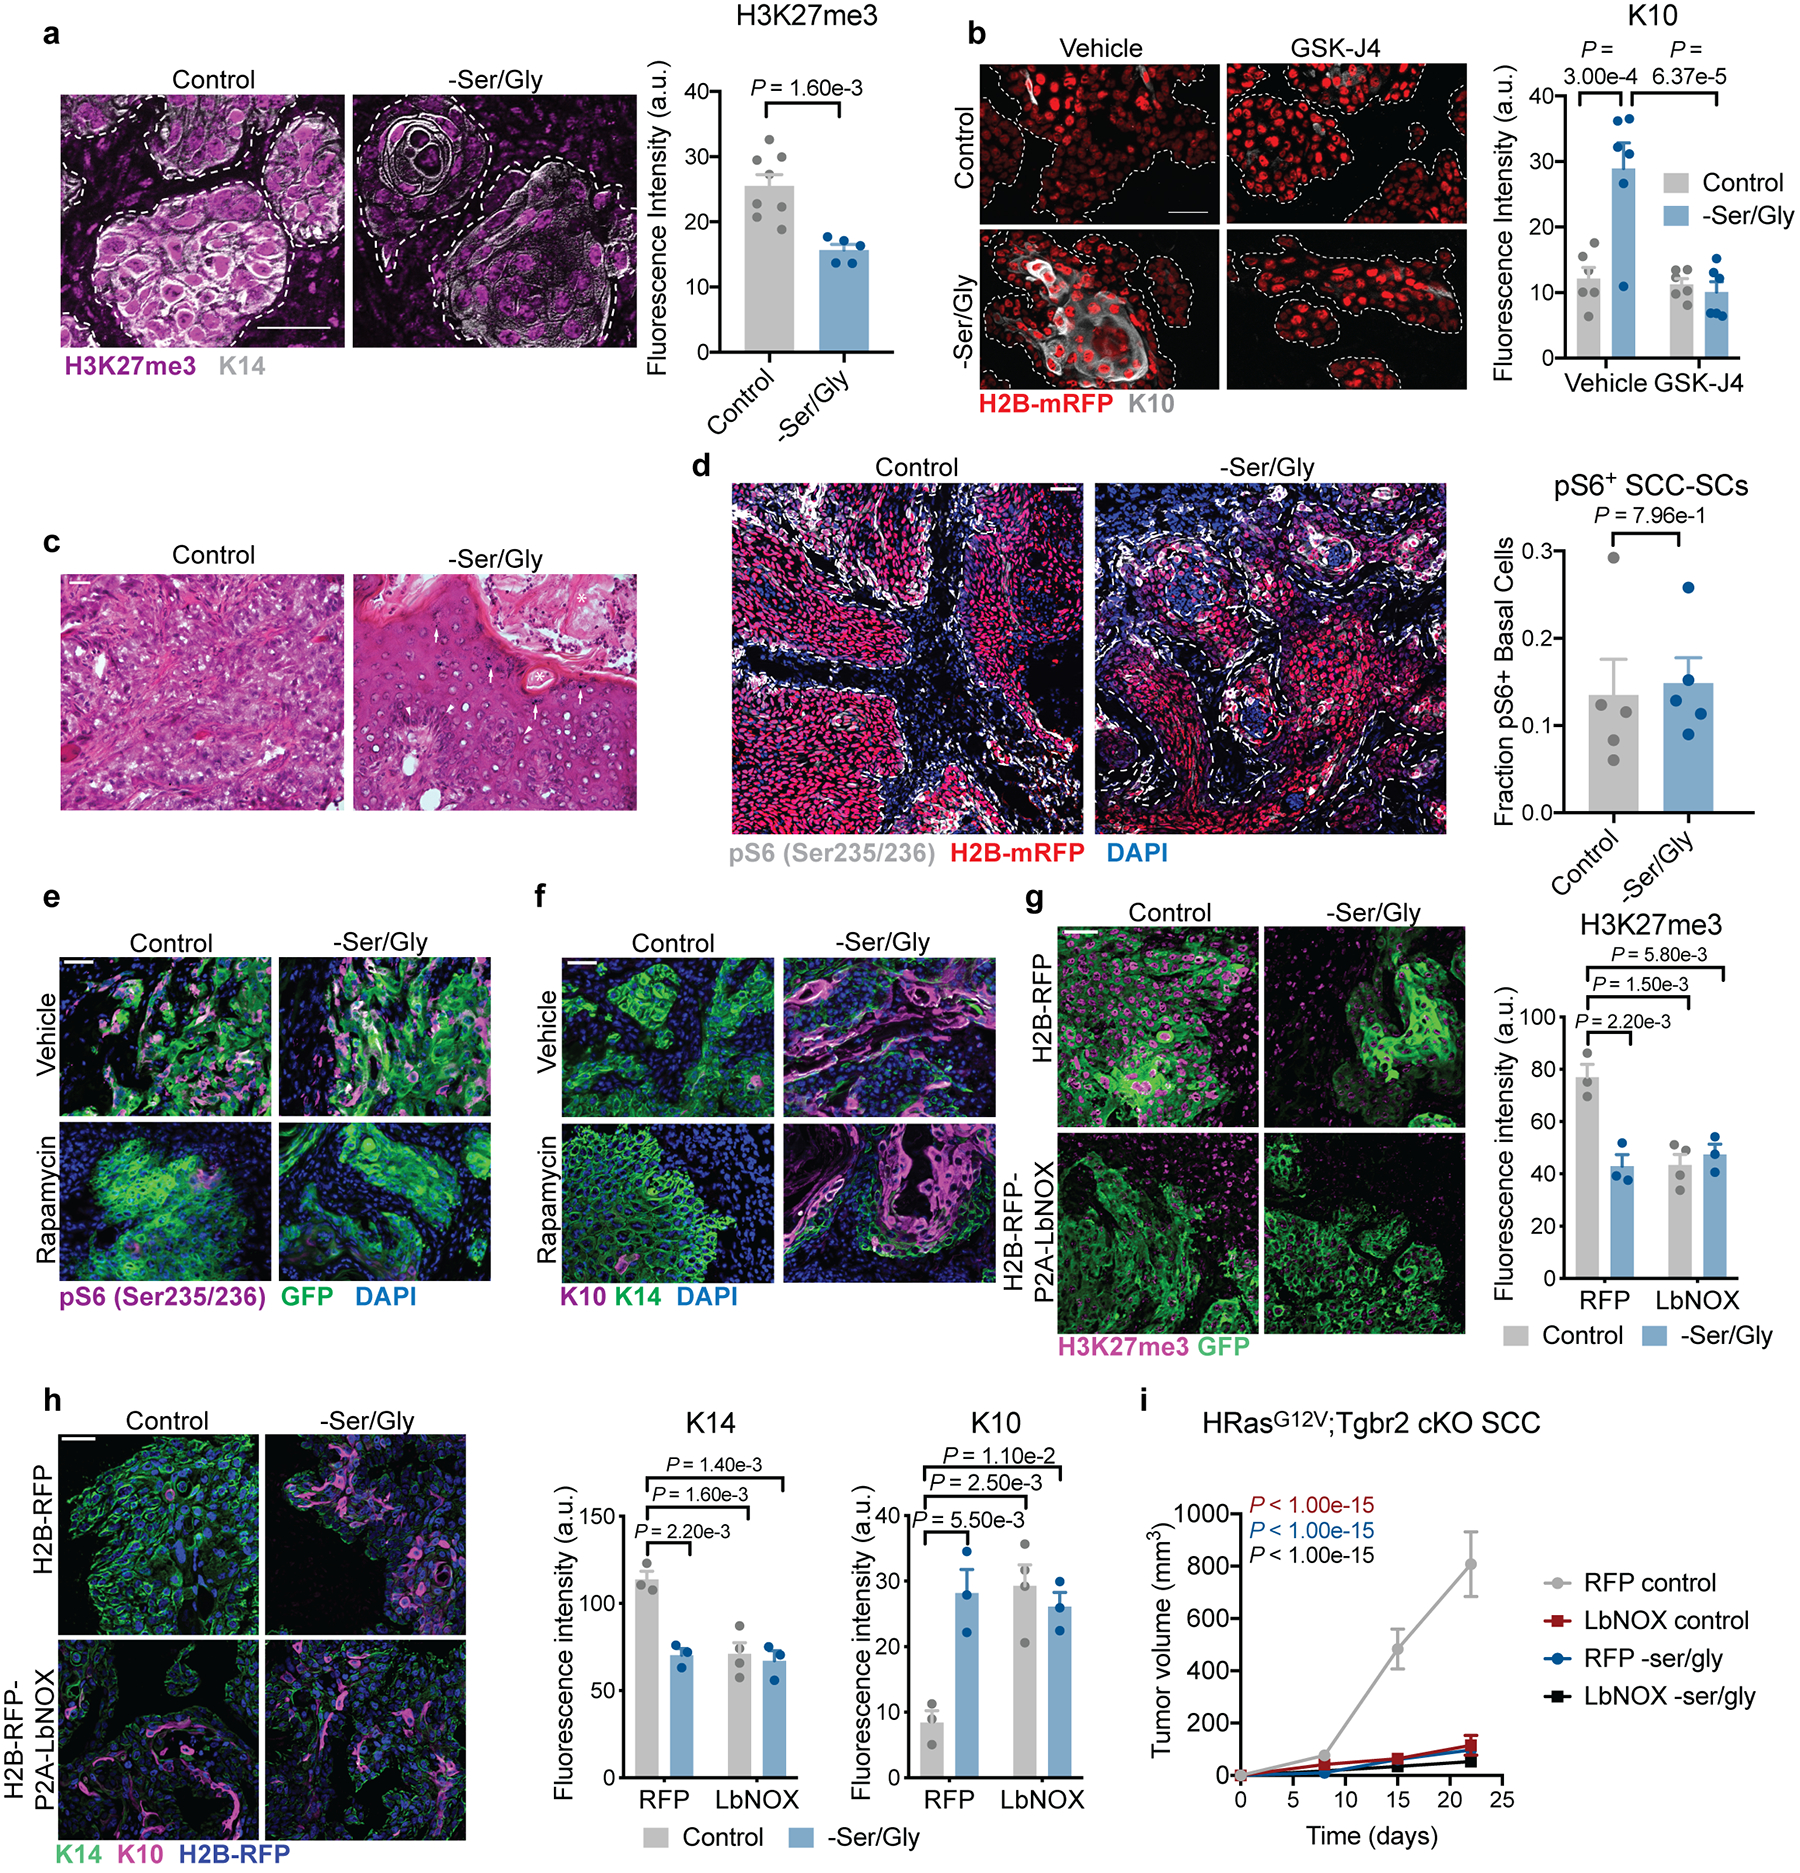
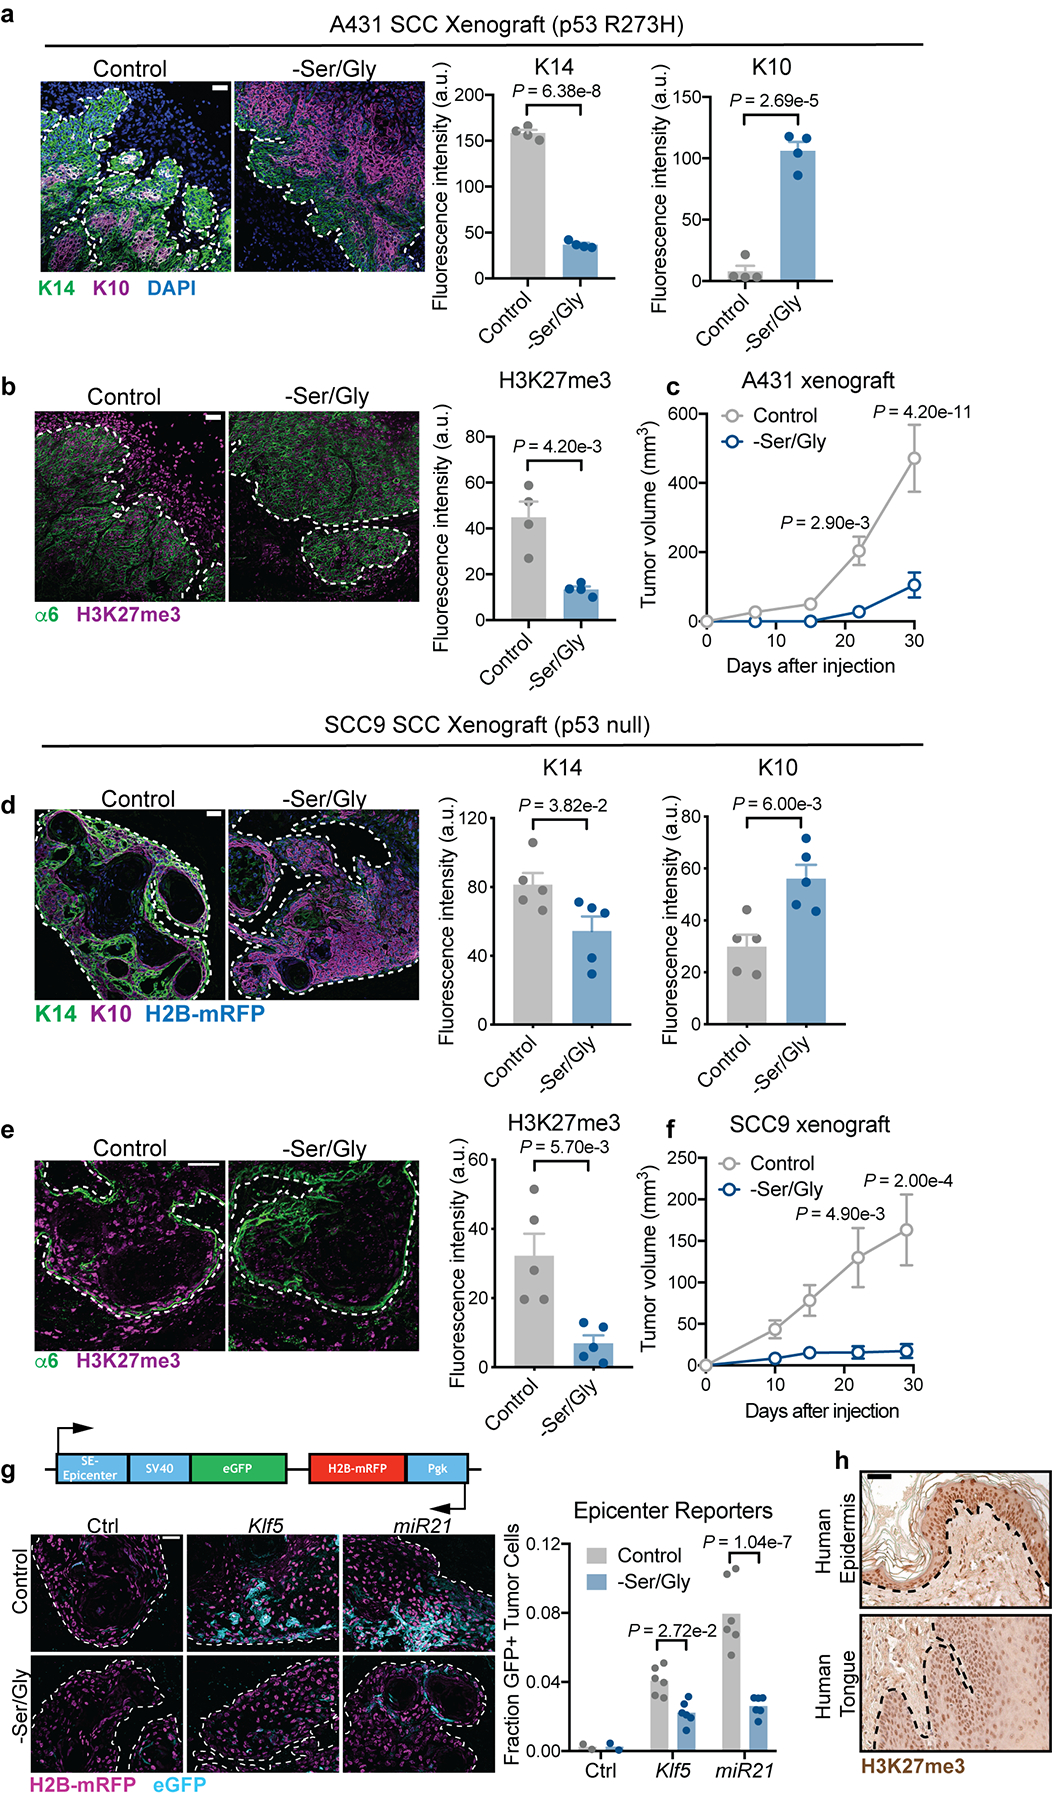
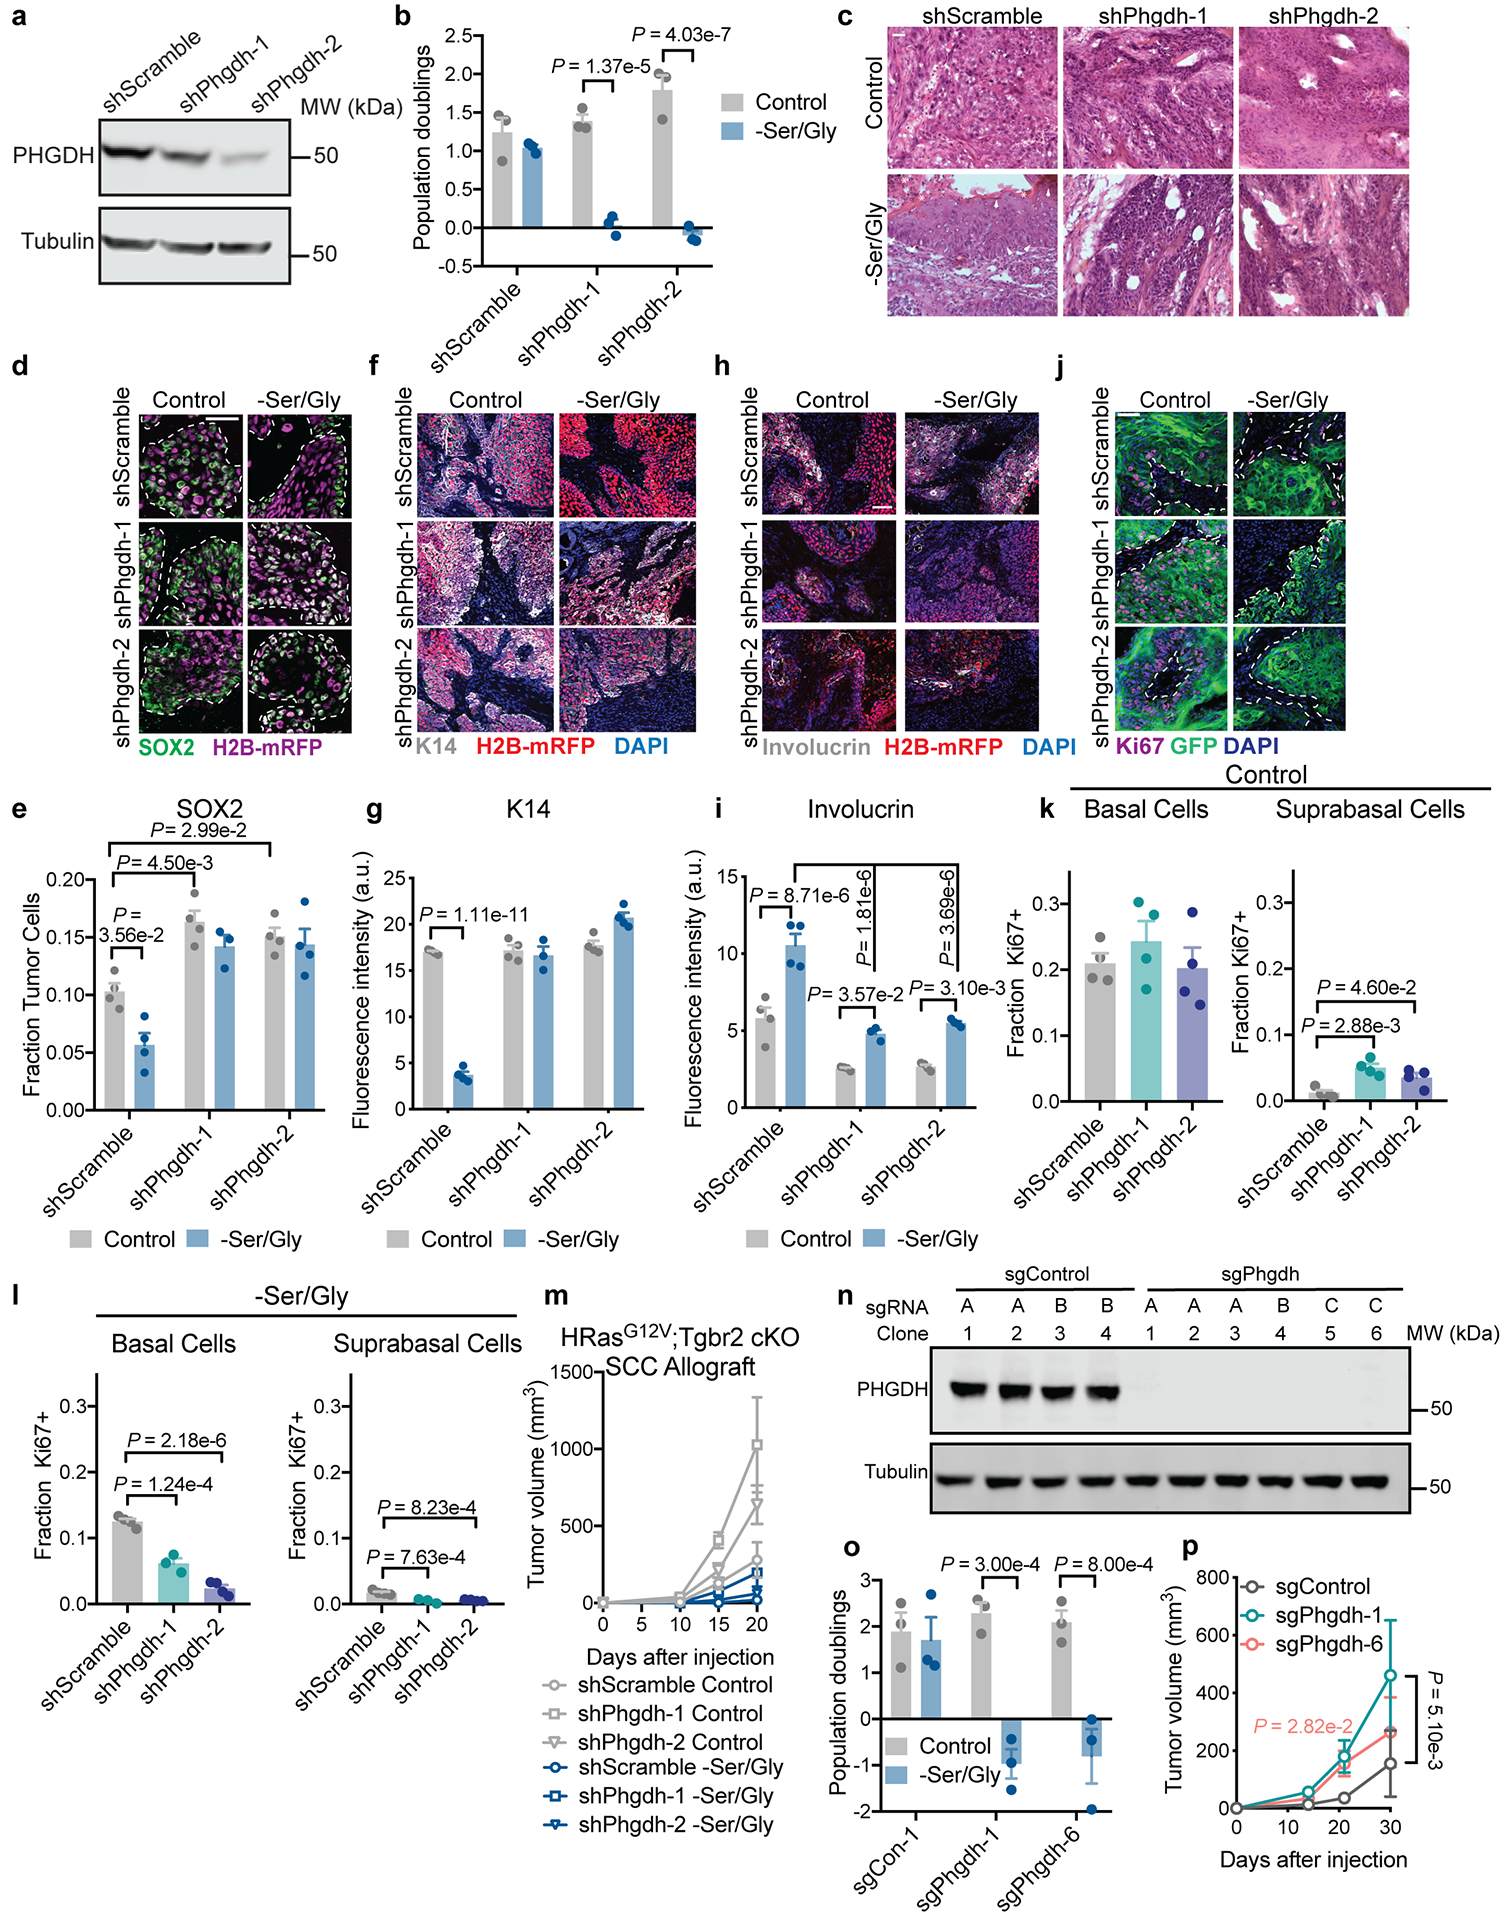
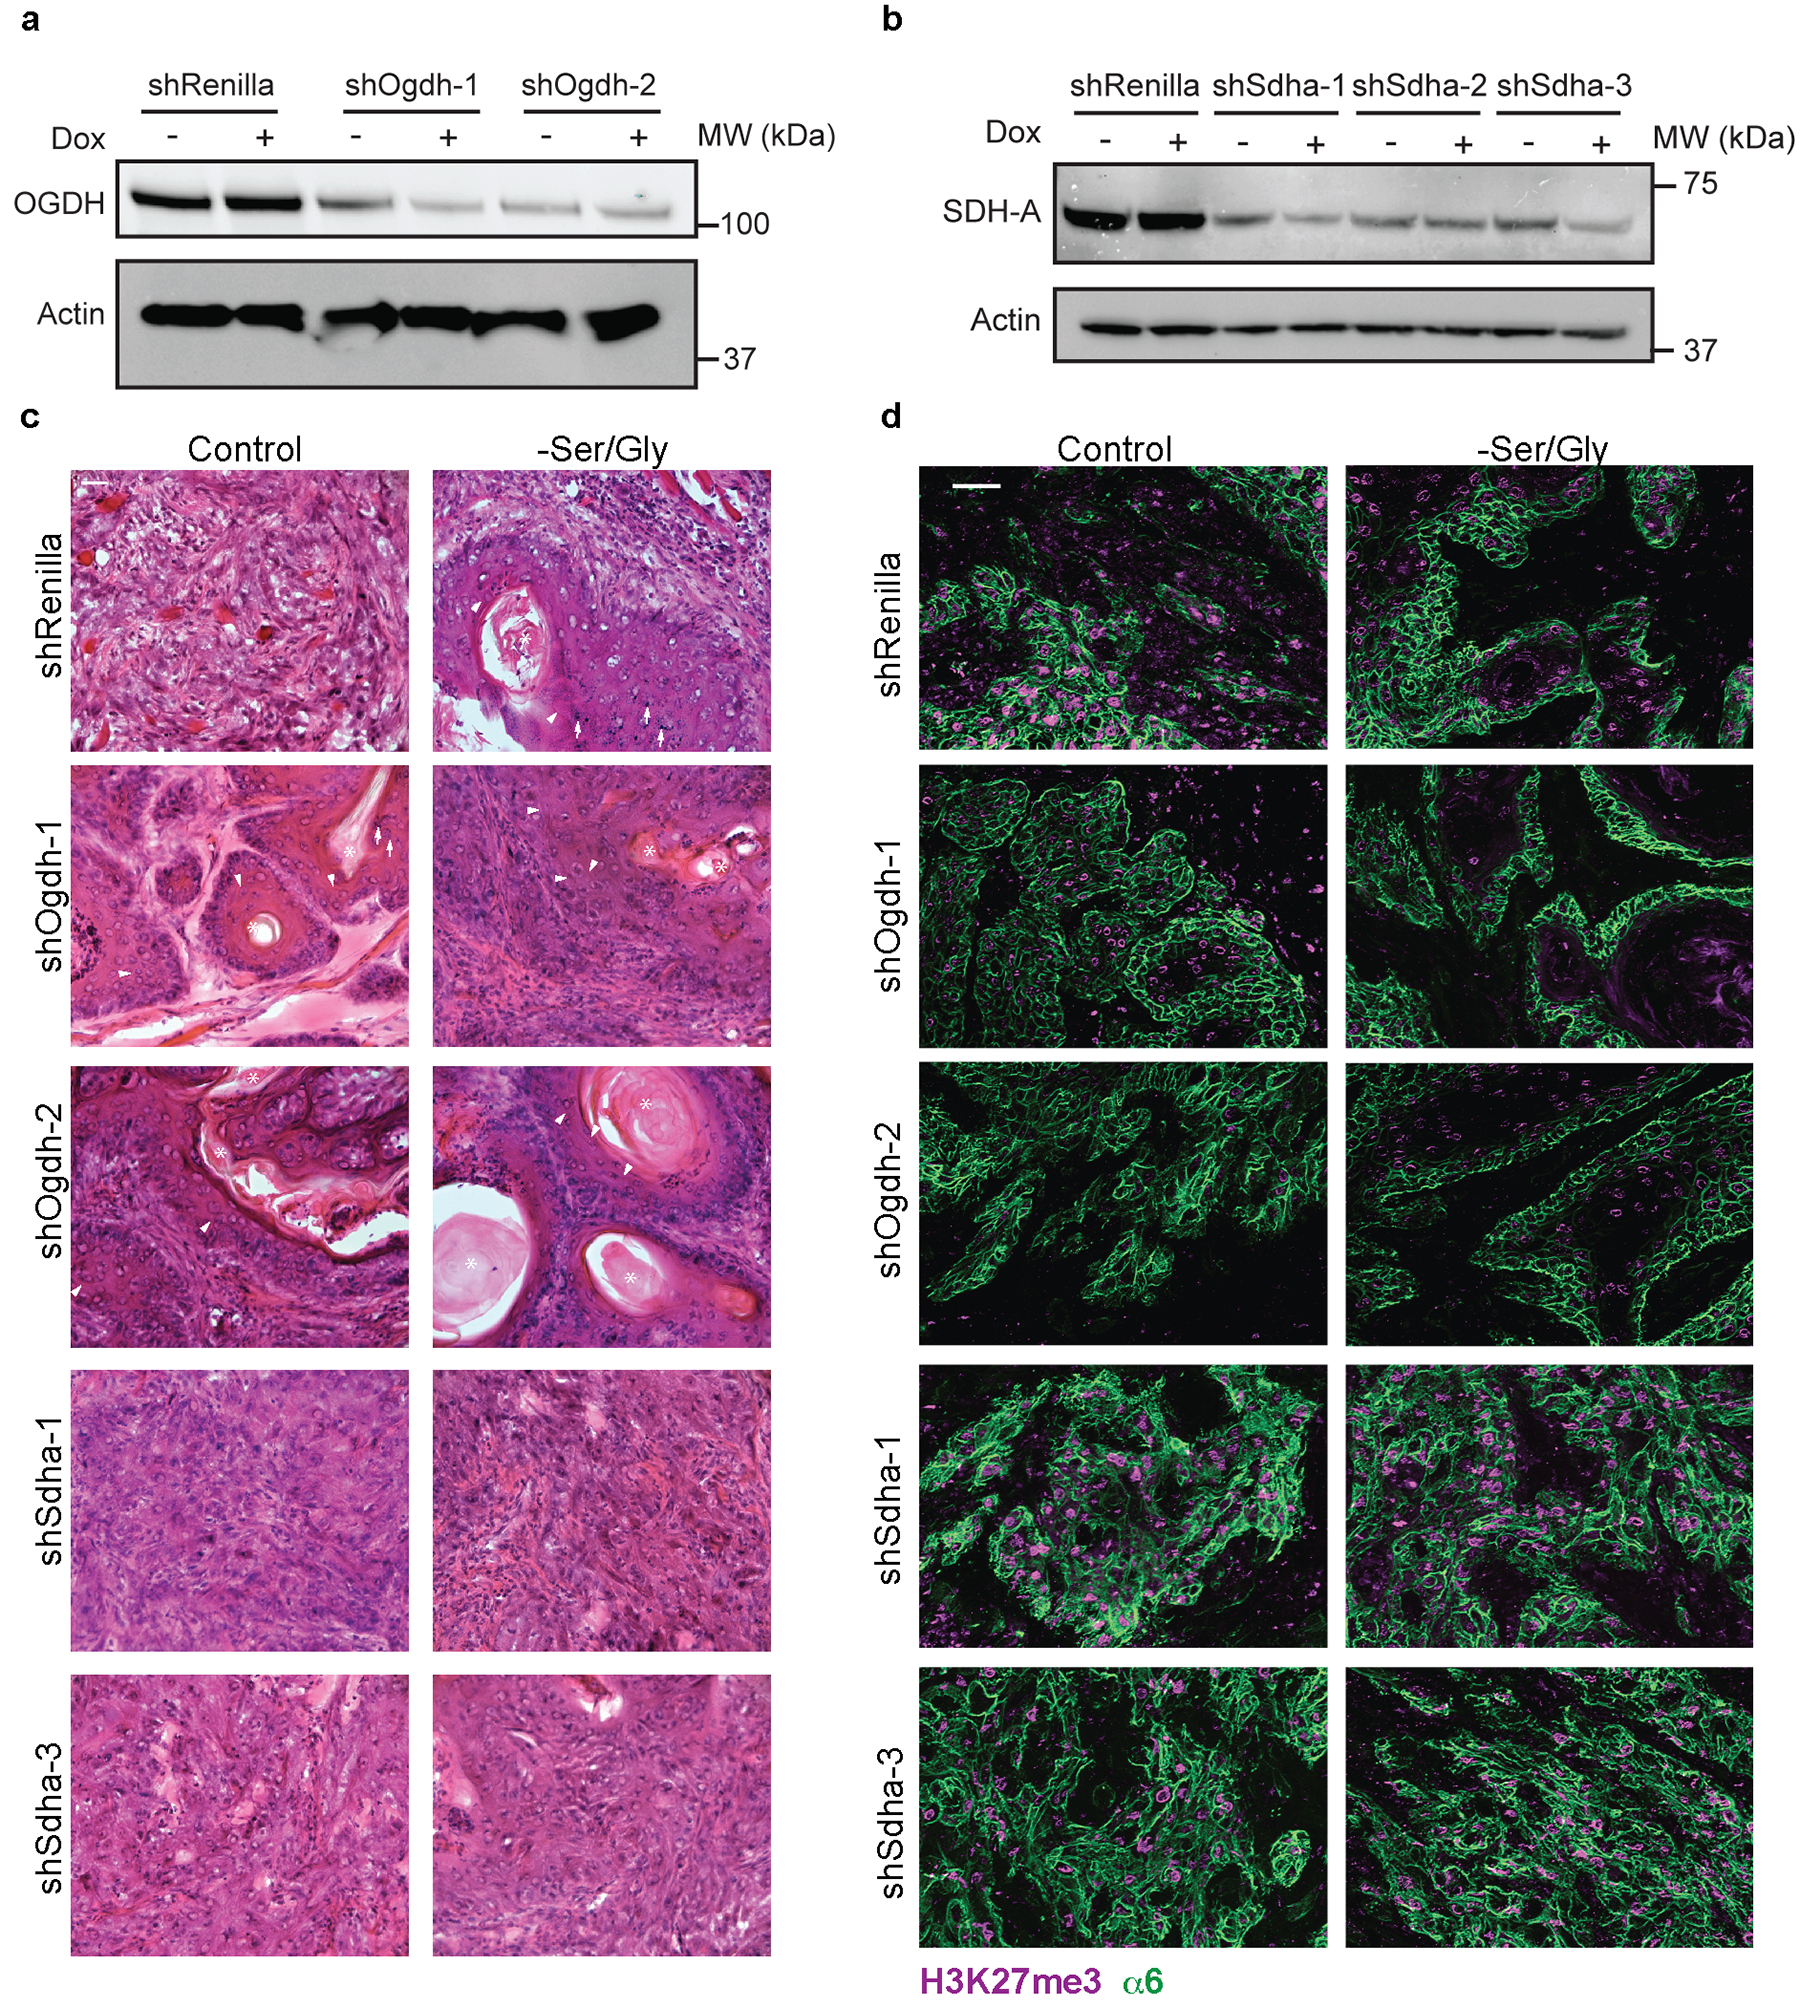
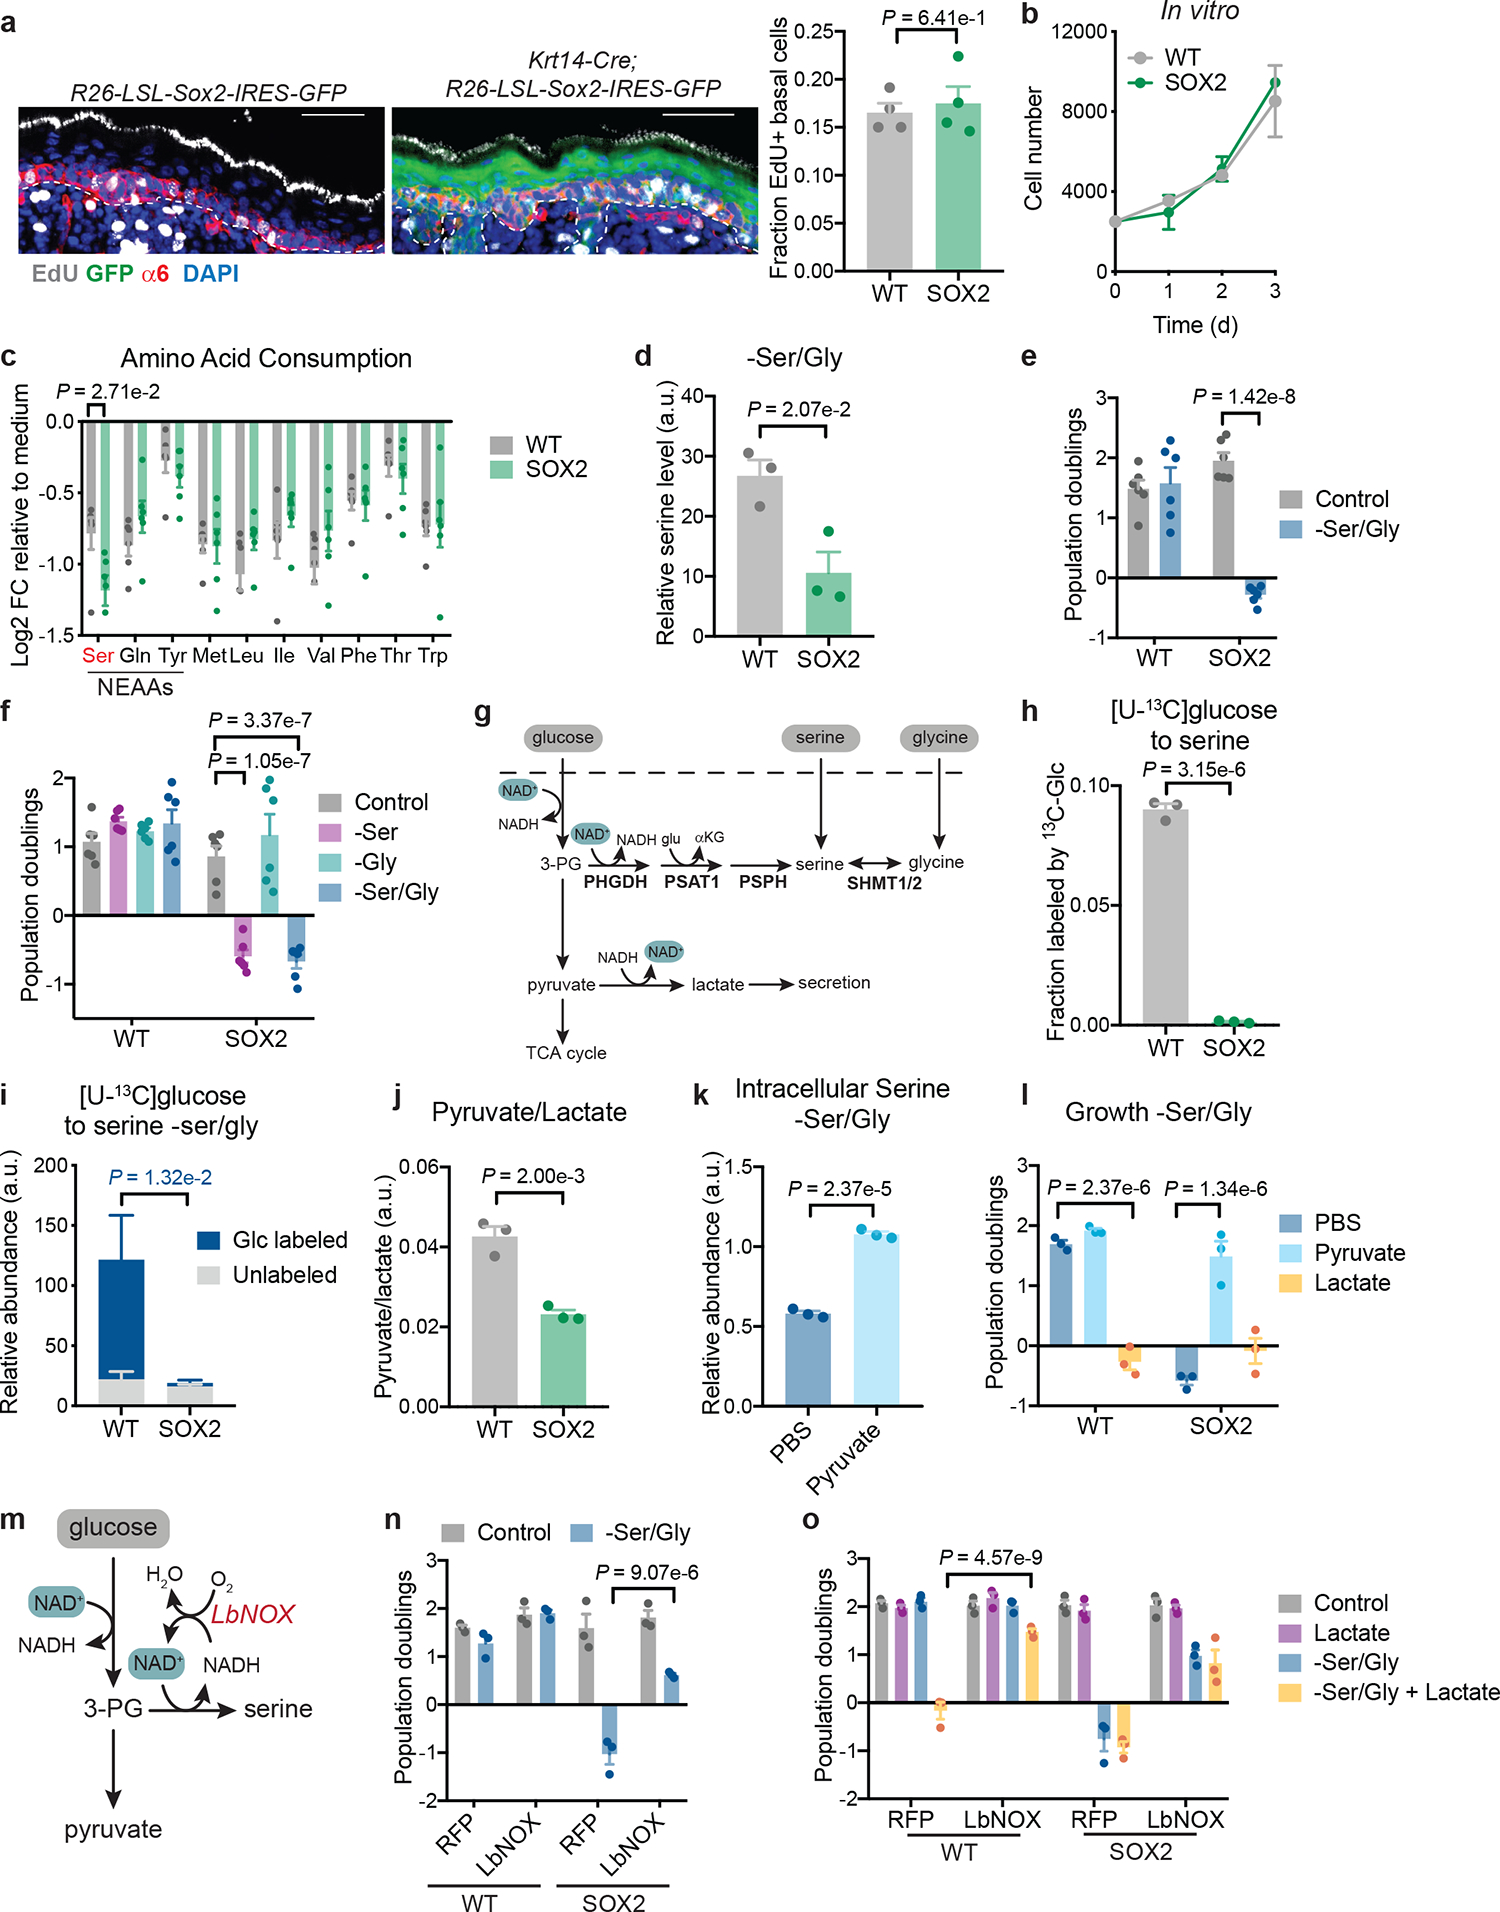
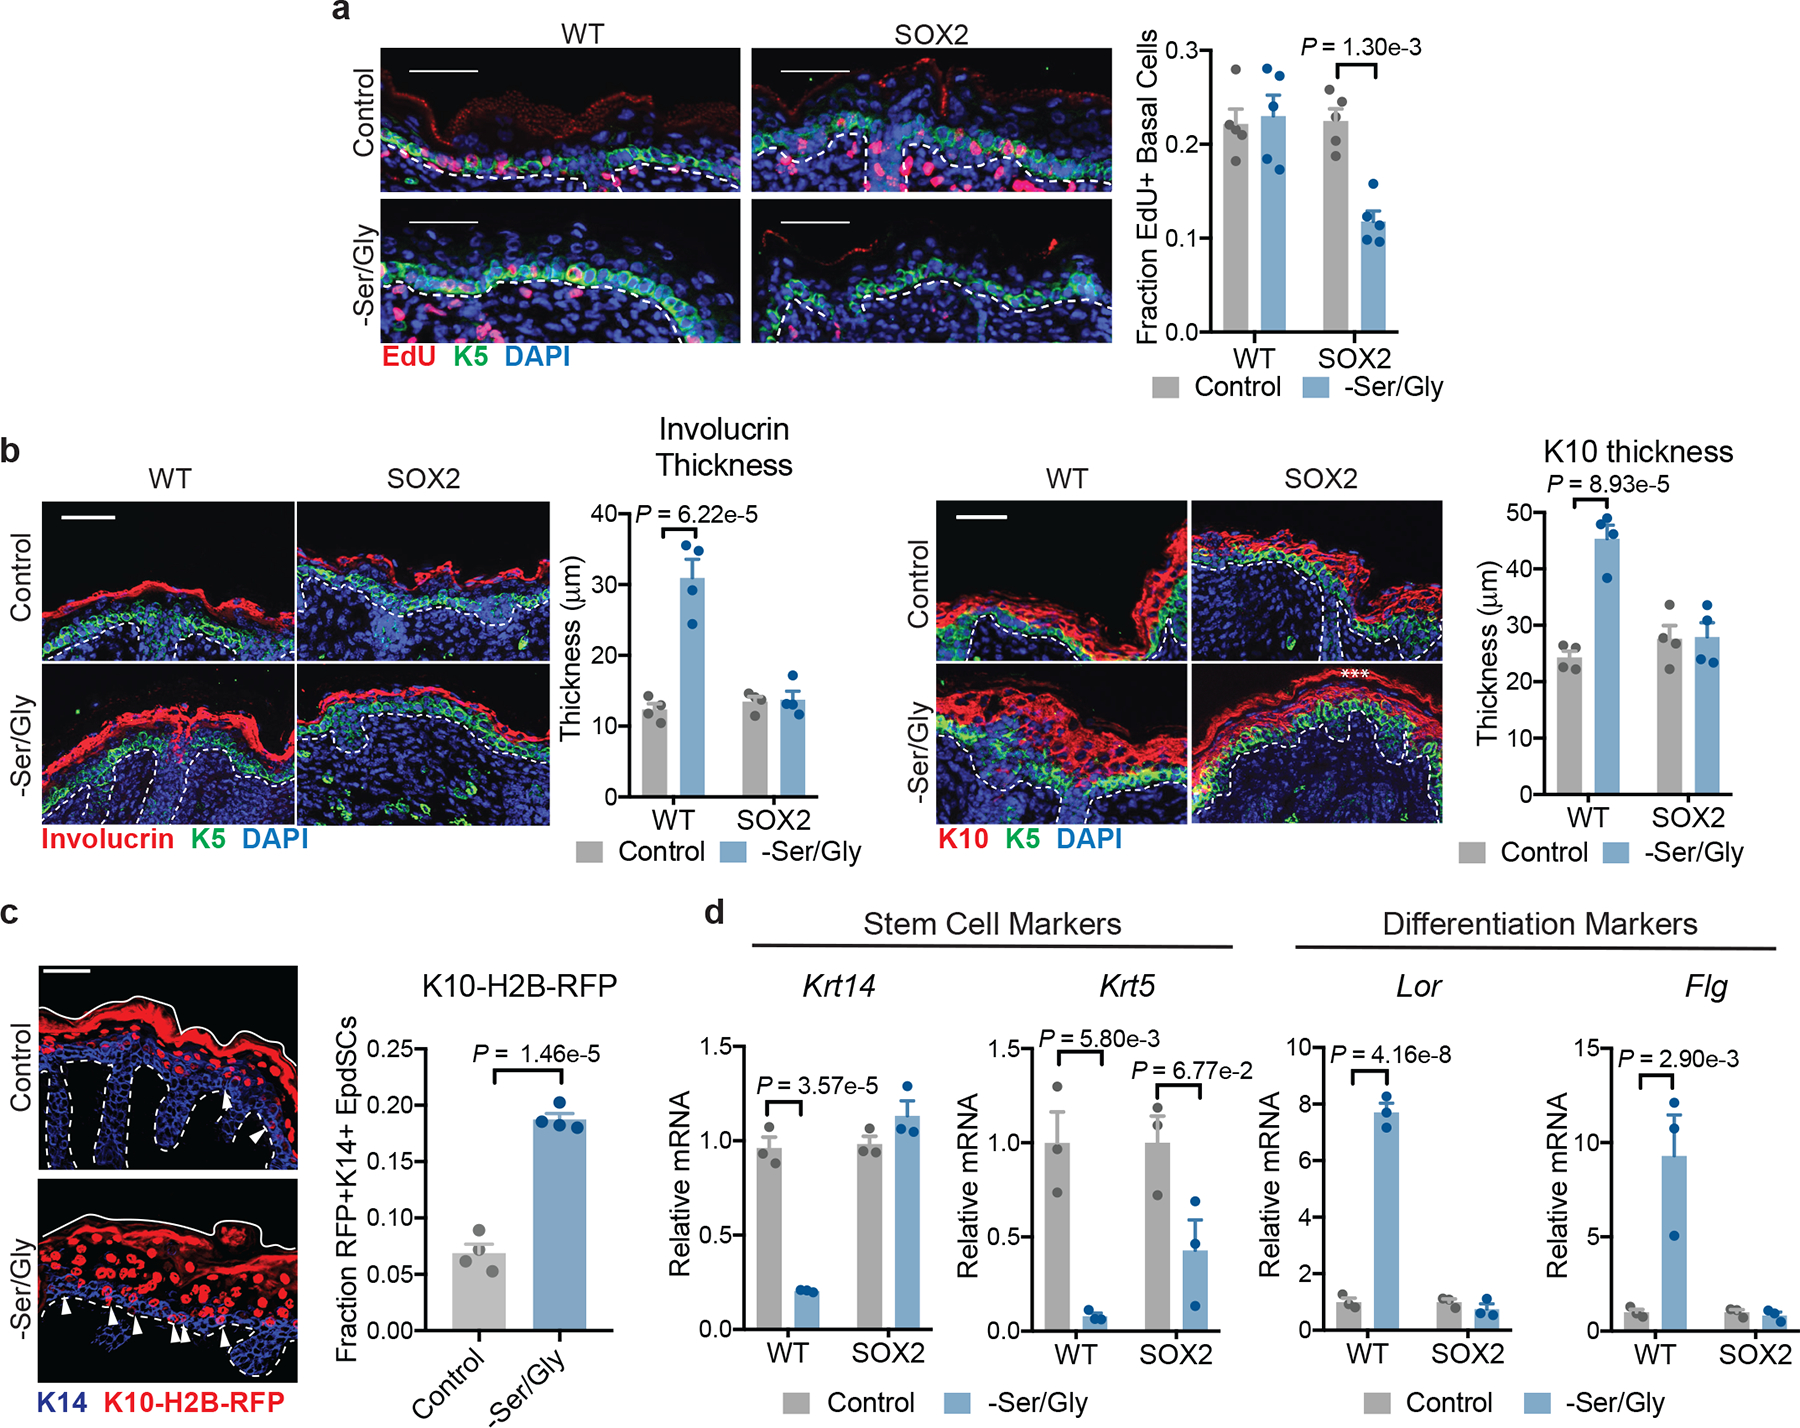
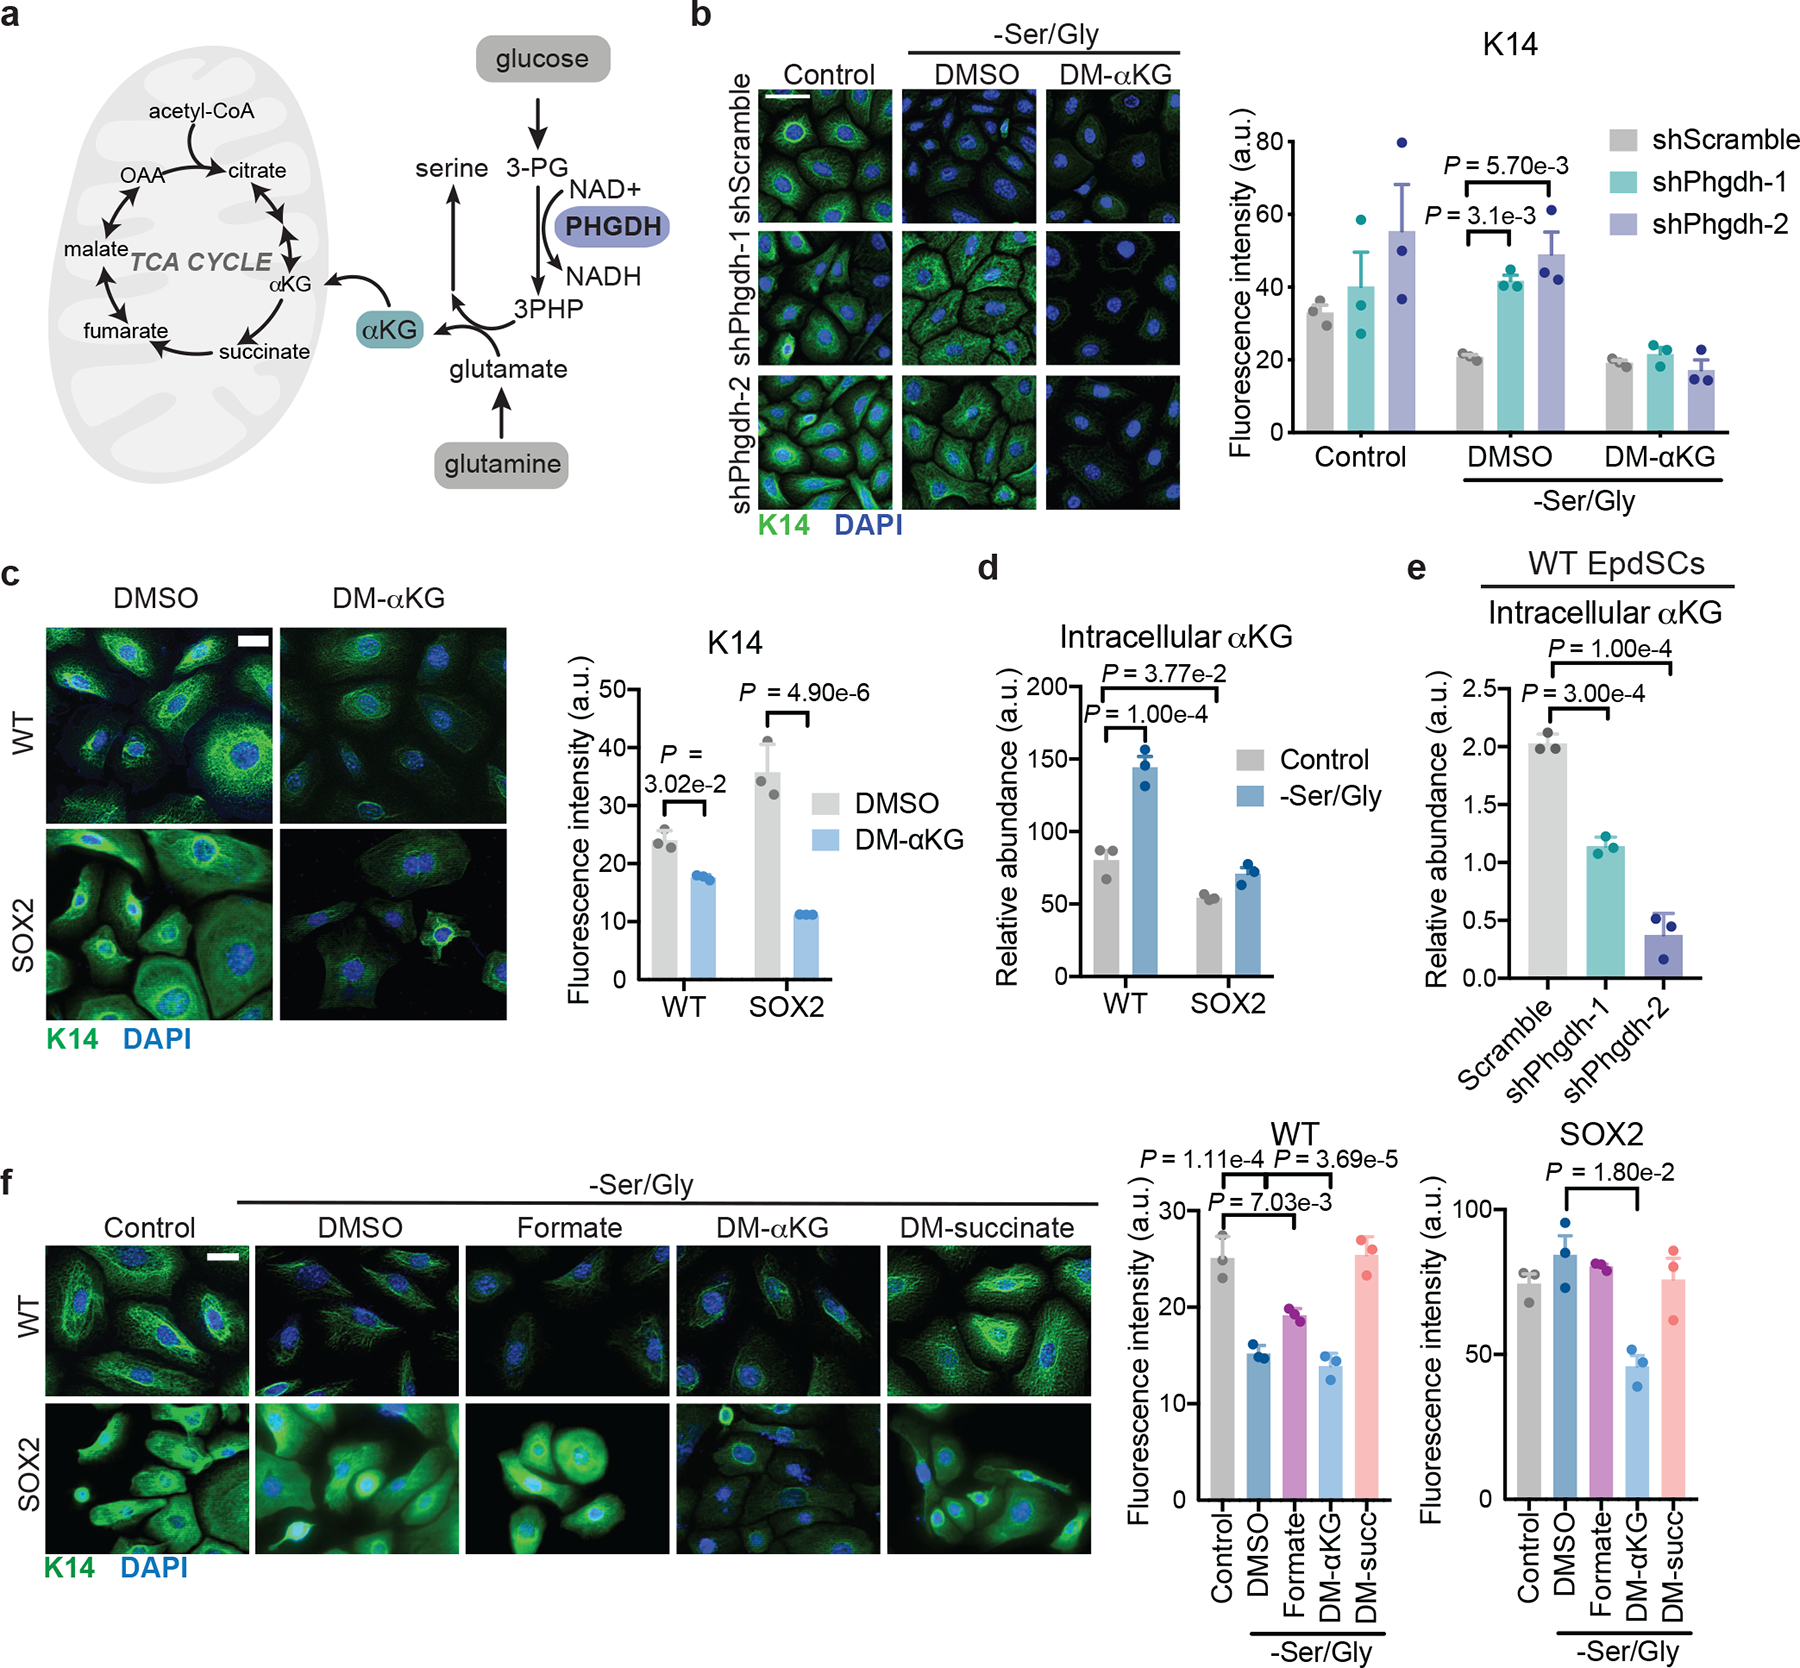
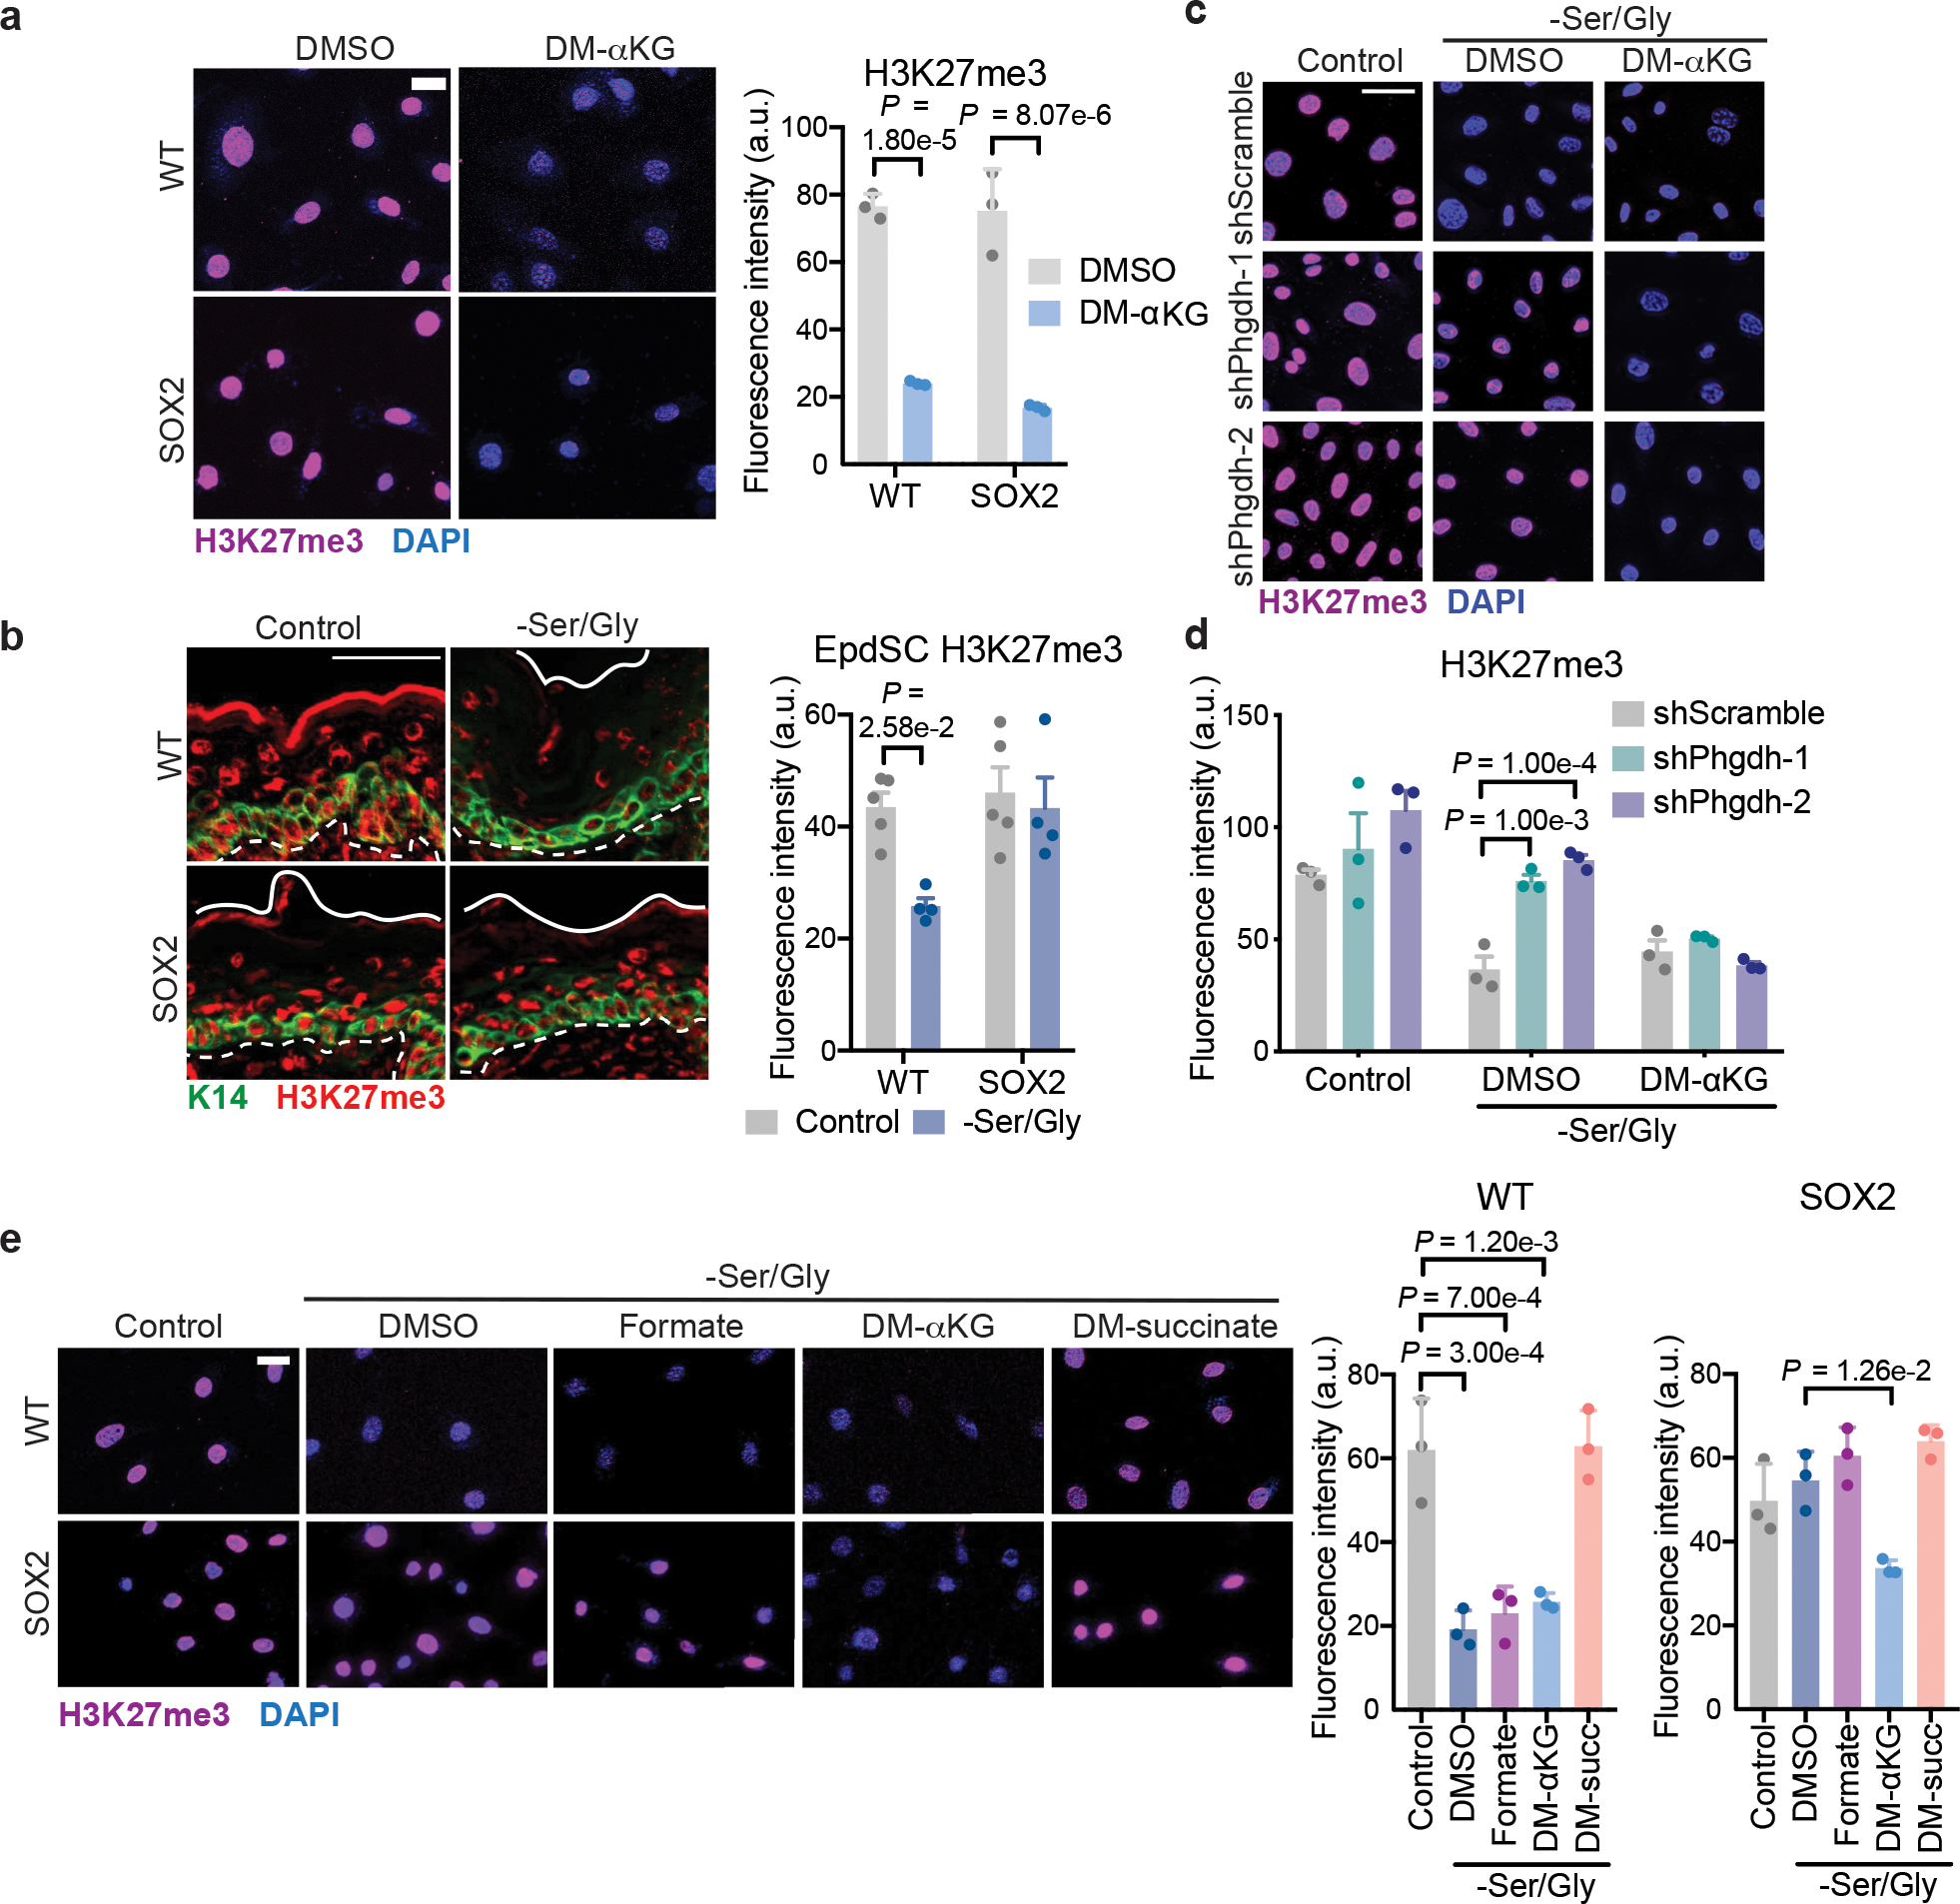
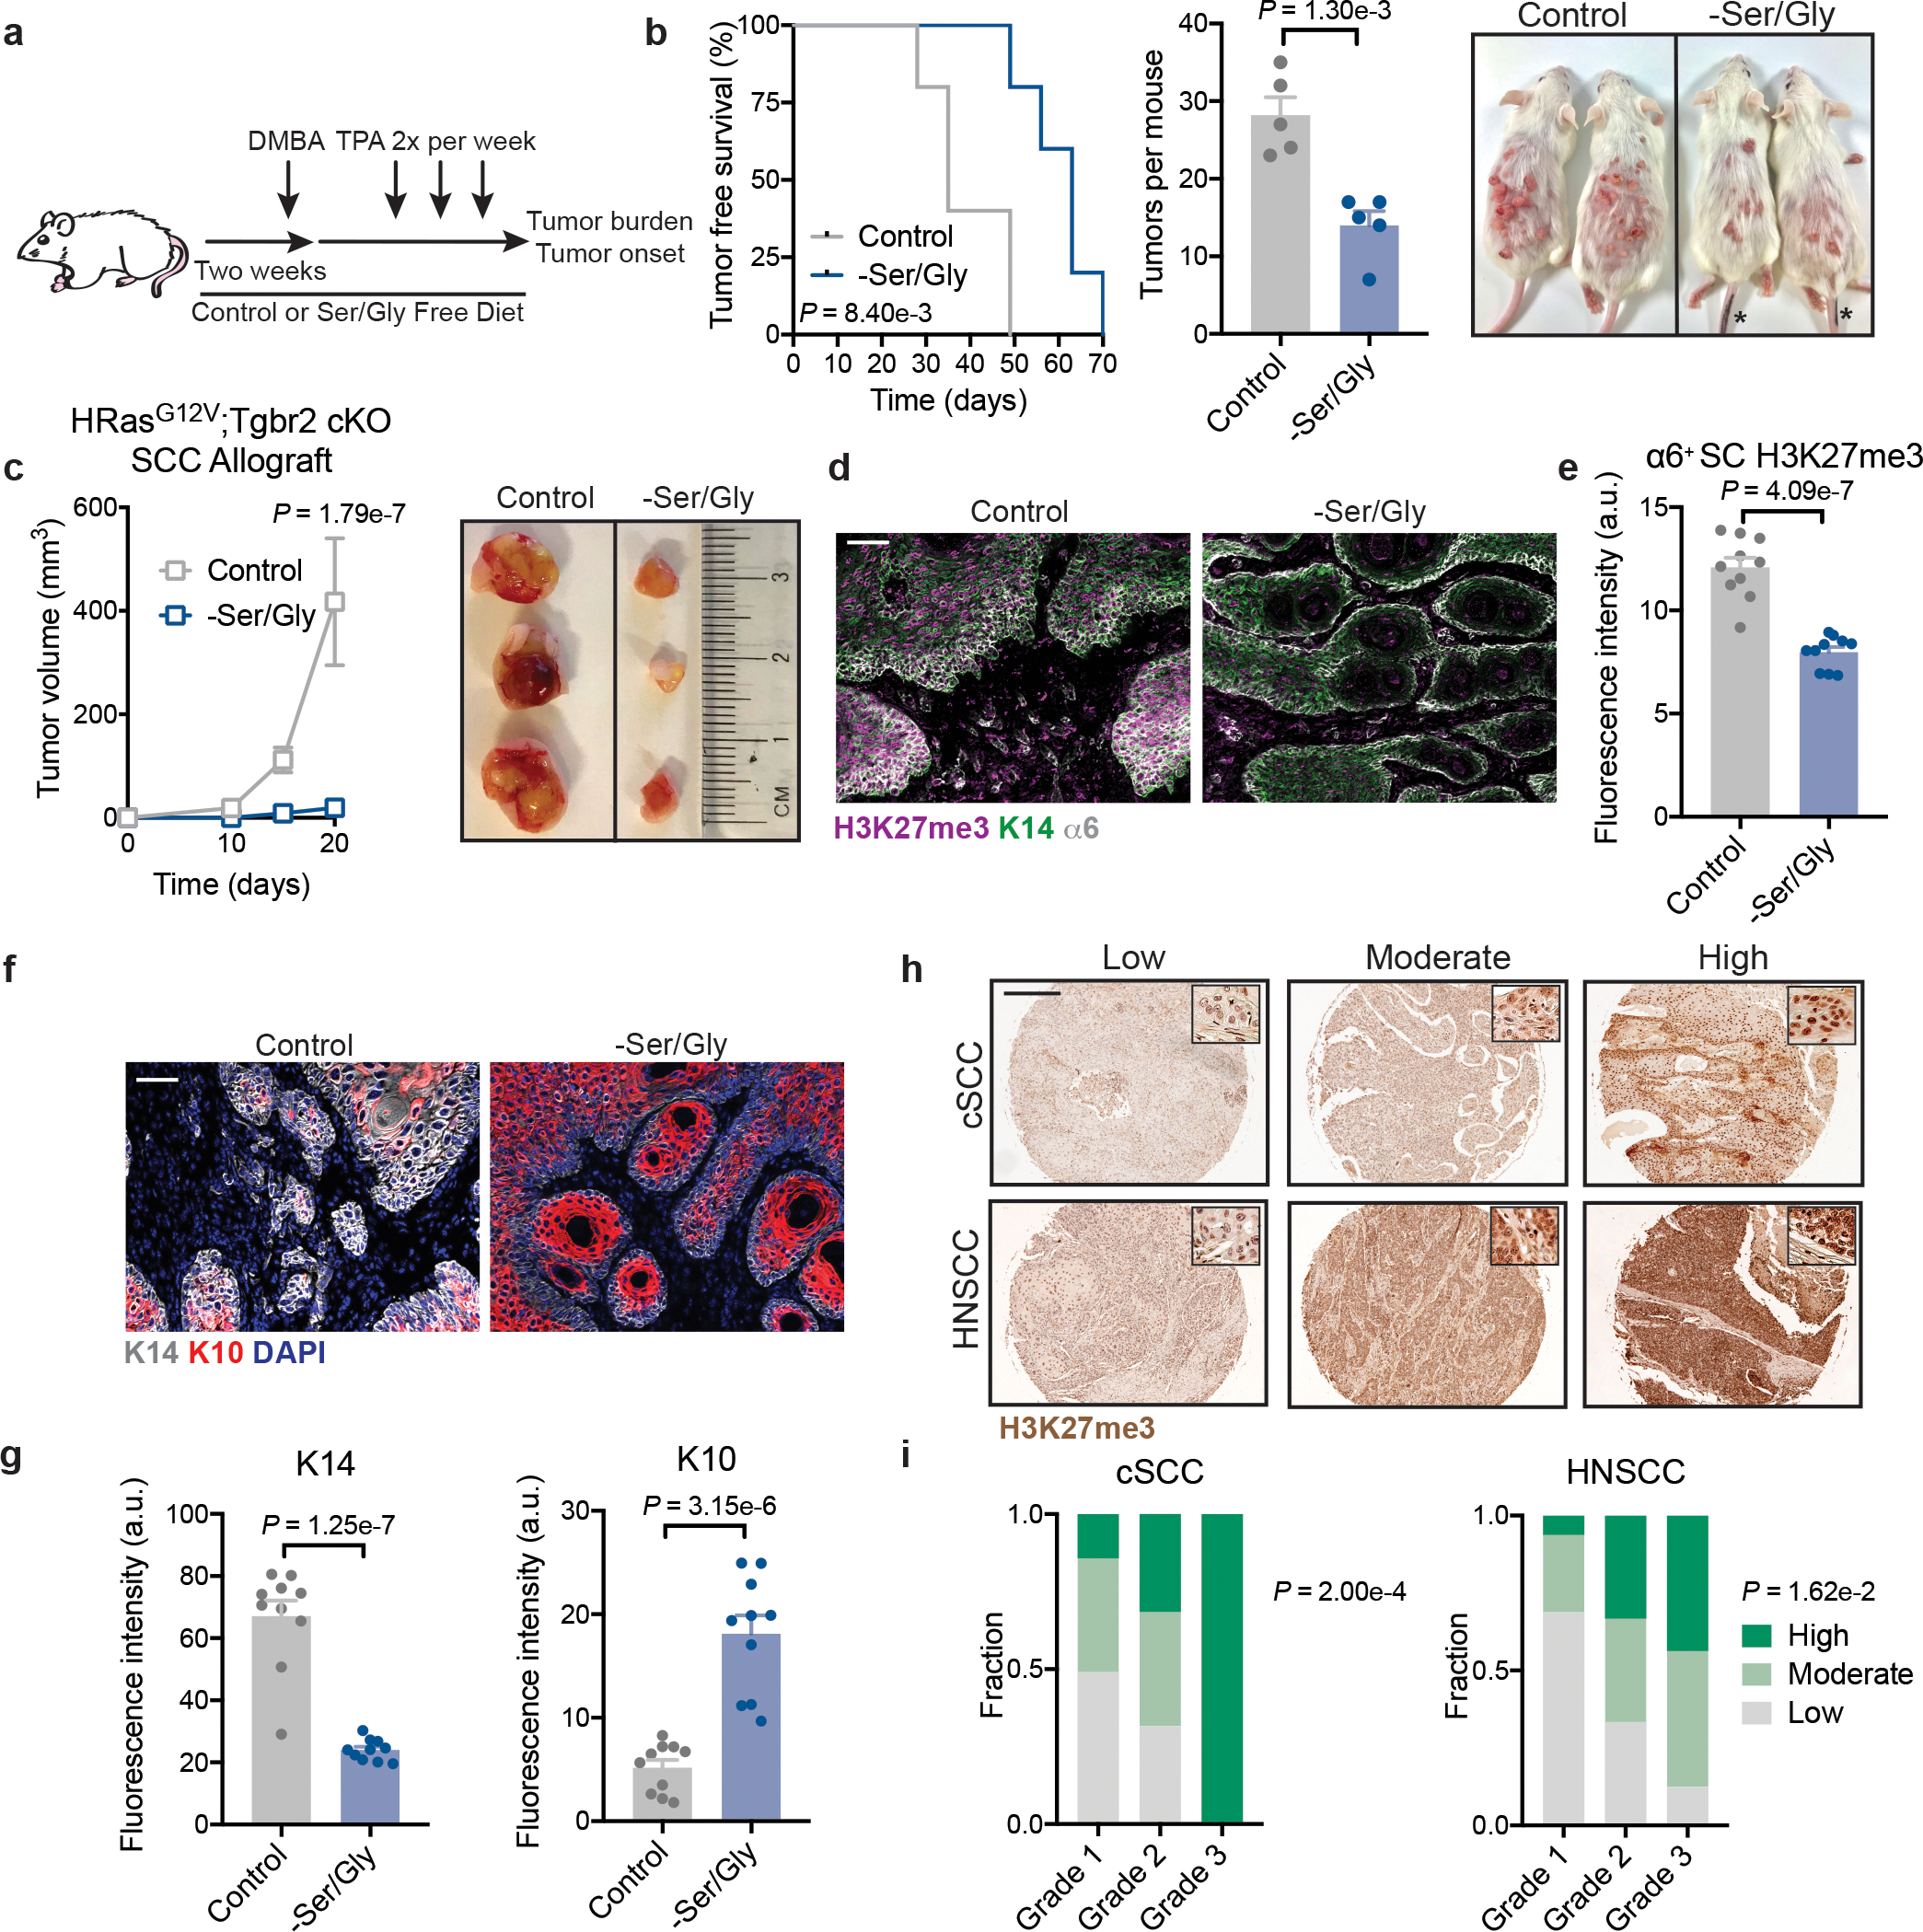
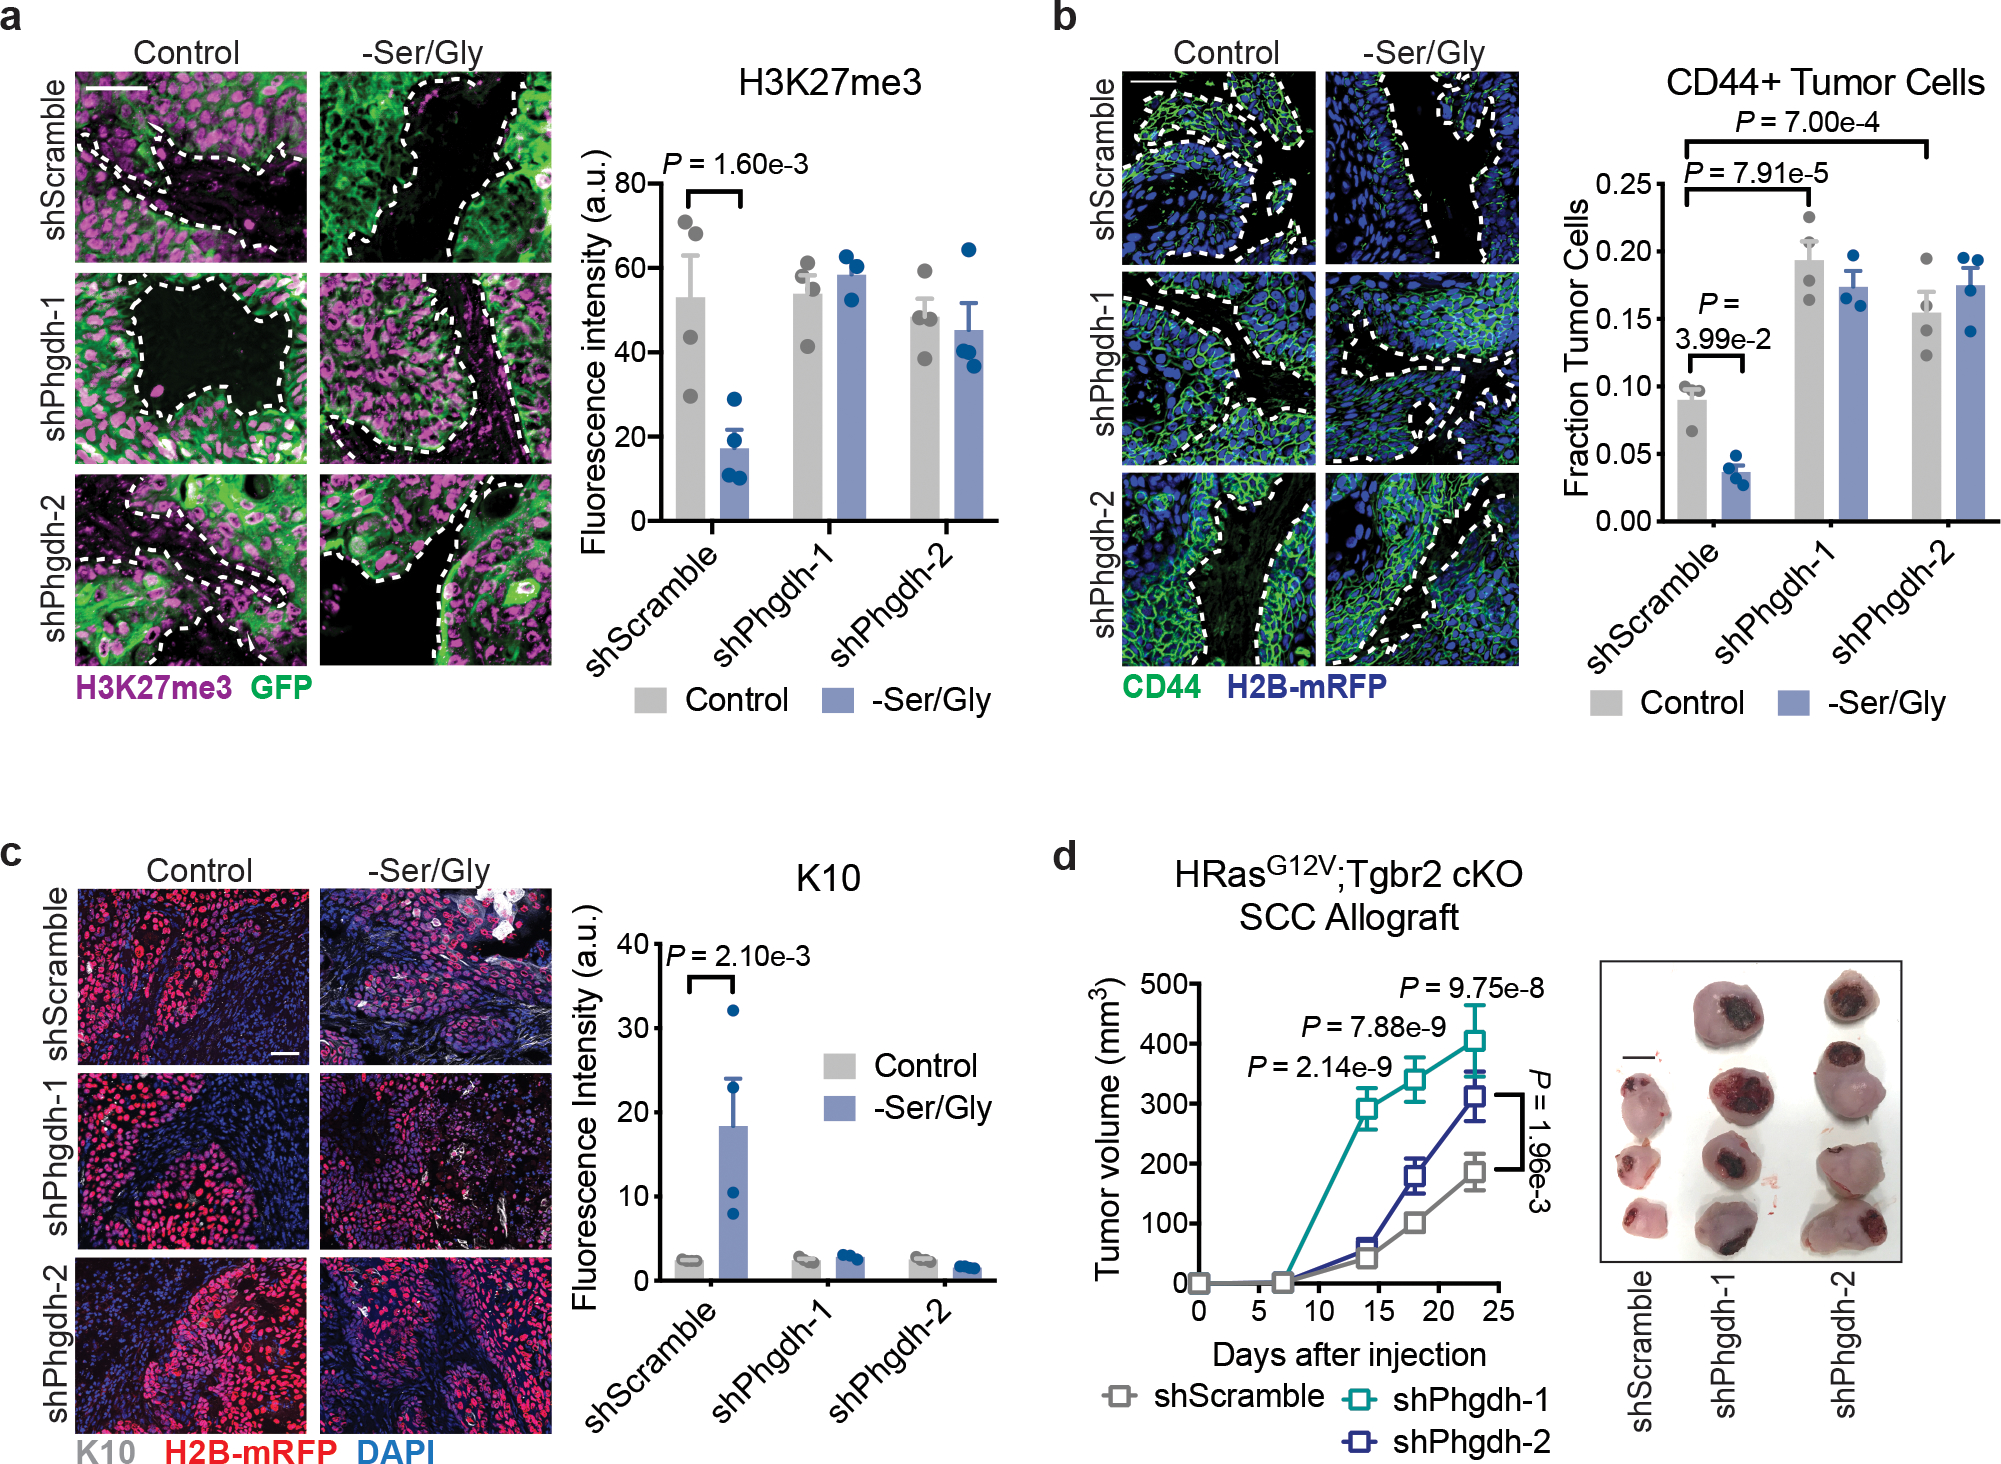
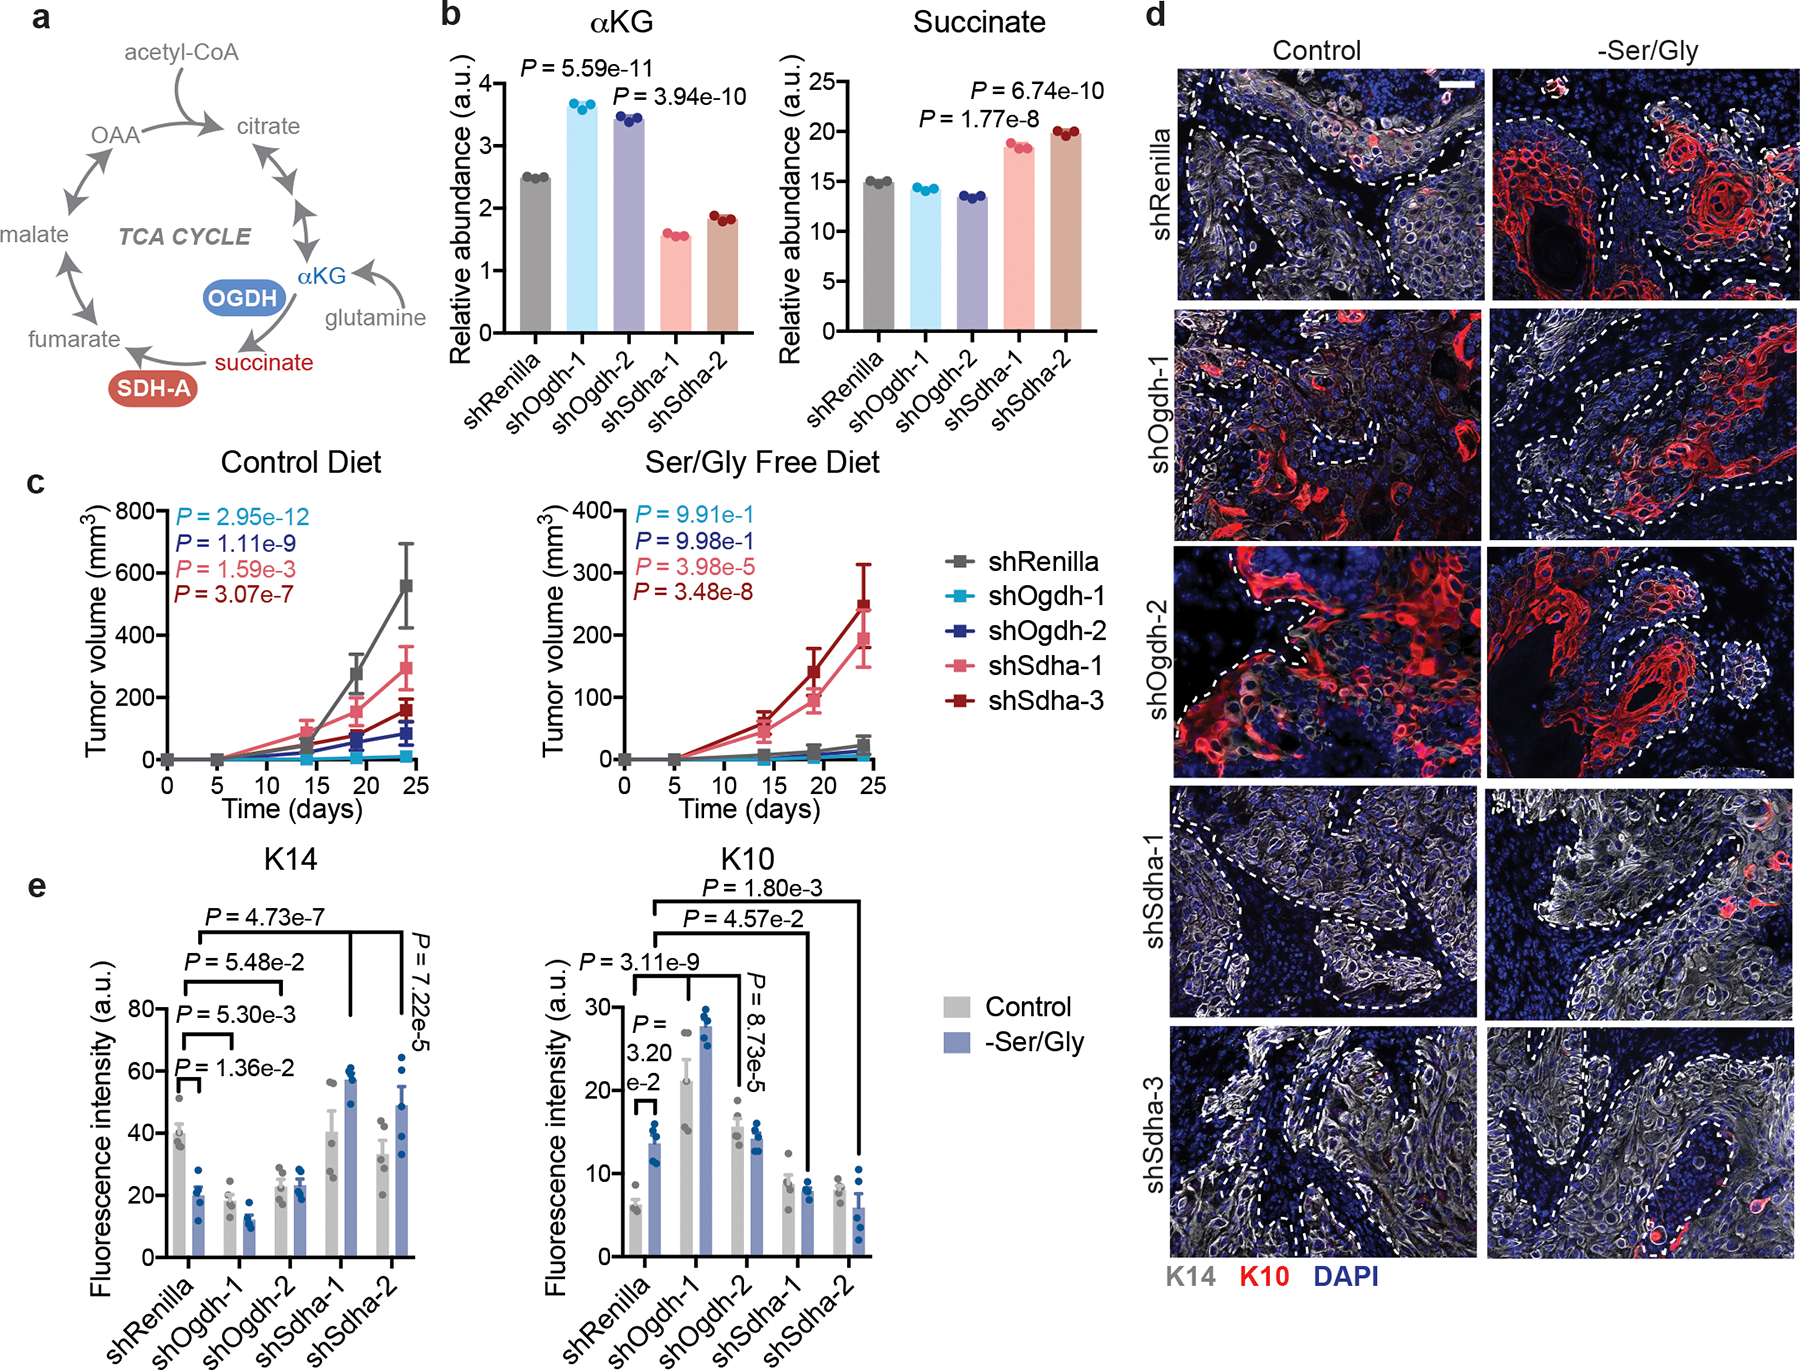
Tissue stem cells are the cell of origin for many malignancies. Metabolites regulate the balance between self-renewal and differentiation, but whether endogenous metabolic pathways or nutrient availability predispose stem cells towards transformation remains unknown. Here, we address this question in epidermal stem cells (EpdSCs), which are a cell of origin for squamous cell carcinoma. We find that oncogenic EpdSCs are serine auxotrophs whose growth and self-renewal require abundant exogenous serine. When extracellular serine is limited, EpdSCs activate de novo serine synthesis, which in turn stimulates α-ketoglutarate-dependent dioxygenases that remove the repressive histone modification H3K27me3 and activate differentiation programmes. Accordingly, serine starvation or enforced α-ketoglutarate production antagonizes squamous cell carcinoma growth. Conversely, blocking serine synthesis or repressing α-ketoglutarate-driven demethylation facilitates malignant progression. Together, these findings reveal that extracellular serine is a critical determinant of EpdSC fate and provide insight into how nutrient availability is integrated with stem cell fate decisions during tumour initiation.


Conflict of interest statement

Declaration of competing interests.

Authors declare no competing interests.

Figures

Extended Data Fig. 1
Extended Data Fig. 1. Pre-malignant EpdSCs are serine auxotrophs.
a. Representative immunofluorescence of progenitor markers α6 and K14 and tumor SC markers CD44 and SOX2 in K14-CreER;SOX2+ pre-tumorigenic lesions in second telogen mice two weeks after tamoxifen administration. Three mice per genotype were analyzed with similar results. Scale bars = 50 μm. b, Relative levels of amino acids from conditioned medium relative to unconditioned medium measured by GC-MS (n=6 biologically independent samples). Data are mean ±SEM. c, Fractional labeling of intracellular serine from [U-13C]serine (n=3 biologically independent samples). Data are mean ±SD. d, Population doublings of H-RasG12V-expressing pre-malignant keratinocytes following 48 h of Ser/Gly starvation (n=3 biologically independent samples). Data are mean ±SD. e, Immunoblot of serine synthesis enzymes in WT and SOX2+ cells following 24 h of culture in control or Ser/Gly-free medium. See Supplementary Table 1 for quantification of immunoblot from triplicate independent experiments. f, Labeling of intracellular serine from [U-13C]glycine (left) and intracellular glycine from [U-13C]serine (right) (n=3 biologically independent samples). Data are mean ±SD. Statistical significance was determined using a two-way ANOVA with Sidak’s multiple comparison test for panels b, c, and f, and an unpaired two-tailed student’s t-test for panel d. Scanned images of unprocessed blots are shown in Source Data Extended Fig. 1. Numerical data are provided in Statistics Source Data Extended Fig. 1.
Extended Data Fig. 2
Extended Data Fig. 2. NAD+ regeneration regulates serine auxotrophy.
a, Schematic of glucose metabolism via glycolysis and the TCA cycle, including associated inhibitors. b, Isotopologues of citrate formed from [U-13C]glucose (n=3 biologically independent samples). Data are mean ±SD. M+0 represents the fraction of citrate not labeled by glucose-derived carbons. Heavier isotopologues are formed when glucose is used to generate citrate through either PDH (M+2) or PC (M+3). Higher weight isotopologues are derived from successive turns around the TCA cycle. c, RT-qPCR for pyruvate metabolism genes (n=3 independent experiments). Data are mean ±SEM. d-e, Relative cell number with dichloroacetate (DCA) (n=3 biologically independent samples) (d) or UK-5099 (n=3 biologically independent samples) (e). Data are mean ±SD. f, Mechanism of action of α-ketobutyrate (AKB). g, Proliferation with AKB (n=3 biologically independent samples). Data are mean ±SD. h, Relative cell number with indicated compounds (n=3). Data are mean ±SEM. i, Schematic of pyruvate mechanism of action. j, Percentage of pyruvate consumed after 24 h (n=5 for SOX2+ –Ser/Gly, otherwise n=6 biologically independent samples). Data are mean ±SEM. k, 24 hr lactate secretion into medium (n=6 biologically independent samples). Data are mean ±SEM. l, Representative immunofluorescence of transduced EpdSCs, performed in triplicate independent experiments with similar results. m, Quantification of the whole cell NAD+/NADH ratio (n=3 biologically independent samples). Data are mean ±SEM. n, [U-13C]glucose labeling of serine following 16 h of Ser/Gly starvation (n=3 biologically independent samples). Data are mean ±SEM. Scale bars = 10 μm. Statistical significance was determined using an unpaired two-tailed student’s t-test for panels m, an unpaired two-tailed student’s t-test using the Holm-Sidak method for multiple comparisons in panels d, e and n, a two-way ANOVA with Sidak’s multiple comparison test for panels b, c, g and k, and Dunnett’s multiple comparison test for panel h. Numerical data are provided in Statistics Source Data Extended Fig. 2.
Extended Data Fig. 3
Extended Data Fig. 3. Effects of serine starvation on epidermal growth and differentiation.
a, Serum serine and glycine in female mice maintained on indicated chow for 2 weeks (n=6 mice per condition). Data are mean ±SD. b, Representative immunofluorescence of cleaved caspase 3 in P0 WT and SOX2+ mice. Analysis was performed on 3 mice/condition with similar results. c, Growth curve in indicated media (n=3 biologically independent samples). d-e, Intracellular serine pools (d) and 4-hr fractional labeling from glucose (e) following 24 h of low Ser/Gly culture (n=3 biologically independent samples). f, Schematic of in vivo LbNOX expression experiment. g, Proliferation in P0 mice on control or Ser/Gly-free diet (n=6 WT control, 5 WT –Ser/Gly, 6 SOX2+ control, 10 SOX2+ –Ser/Gly mice). h, Immunofluorescence of cell division classes based on Survivin staining (left), quantification of spindle angle relative to the basement membrane in P0 WT and SOX2+ SCs on control or Ser/Gly-free diet (middle, data are mean), and binning of spindle axes in WT control (n=21 mitoses), WT –Ser/Gly (n=25 mitoses), SOX2+ control (n=32 mitoses) and SOX2+ -Ser/Gly (n=35 mitoses) (right). Mitoses were counted across three animals per condition. Scale bar = 5 μm. SB = suprabasal. i-j, Immunofluorescence (i) and quantification (j) of K14 in indicated media (n=3 independent experiments). Scale bar = 50 μm k, Immunofluorescence of K14 in indicated media (n=3 independent experiments). Scale bar = 50 μm. Unless indicated all data are mean ±SEM. Statistical analysis was performed by an unpaired two-tailed student’s t-test for panels a and d, a two-way ANOVA with Sidak’s multiple comparison test for panels e and g and Tukey’s multiple comparison test in panel k, a parts of whole Chi-Square analysis in panel h, and a one-way ANOVA with Tukey’s multiple comparison test in panel j. Numerical data are provided in Statistics Source Data Extended Fig. 3.
Extended Data Fig. 4
Extended Data Fig. 4. Serine synthesis promotes differentiation.
a, Western blot of Phgdh knockdown in WT EpdSCs. shPhgdh2.1 and shPhgdh2.2 represent independent transductions with same shRNA and in subsequent experiments, shPhgdh2.2 is referred to as shPhgdh2. Experiment was performed twice with similar results. shRNA sequences can be found in Supplementary Table 5. b, 48 hour population doublings of shPhgdh WT cells (n=3 biologically independent samples). Data are mean ±SEM. c, Intracellular serine pools upon Ser/Gly starvation (n=3 biologically independent samples). Data are mean ±SEM. d, Involucrin immunofluorescence in shPhgdh lines cultured with DMSO or DM-αKG following 24 hours of Ser/Gly starvation (n=3 independent experiments). Data are mean ±SEM. e-f, Representative immunofluorescence (e) and quantification (f) of Involucrin in indicated conditions (n=3 independent experiments). Data are mean ±SEM. Statistical significance was determined using a two-way ANOVA with Sidak’s multiple comparison test in panels b and f, Tukey’s multiple comparison test in panel d, and an ordinary one-way ANOVA with Dunnett’s multiple comparison test in panel c. Scanned images of unprocessed blots are shown in Source Data Extended Fig. 4. Numerical data are provided in Statistics Source Data Extended Fig. 4.
Extended Data Fig. 5
Extended Data Fig. 5. Glucose-derived serine synthesis supports the TCA cycle and αKG-driven differentiation.
a, Metabolite pools following 16 h of Ser/Gly starvation (n=3 biologically independent samples). Data are mean ±SEM. b, Estimation of serine synthesis contribution to αKG pools (n=6 biologically independent samples, serine uptake data from Fig. 1c) See Methods and Supplementary Tables 2 and 3 for more information. αKGSSP = αKG produced from SSP; SerSSP = serine produced from SSP; SerEC +SG = serine consumed in the presence of extracellular Ser/Gly; SerEC –SG = serine secreted in the absence of extracellular Ser/Gly; GlnIC = available intracellular glutamine pool; GlnEC +SG = glutamine consumed in the presence of extracellular Ser/Gly; GluEC +SG = glutamate secreted in the presence of extracellular Ser/Gly. Data are mean ±SEM. c, Intracellular fumarate and malate in WT EpdSCs expressing indicated hairpins following 16 h Ser/Gly deprivation (n=3 biologically independent samples). Data are mean ±SEM. d, Involucrin staining in cells supplemented with 1 mM formate, 4 mM DM-αKG or 4 mM DM-succinate (n=3 independent experiments). Data are mean ±SEM. e, Representative immunoblot for H3K27me3 levels. See Supplementary Table 4 for quantification of immunoblot in triplicate independent experiments. f, Immunofluorescence for H3K27me3 upon culture in low Ser/Gly or Ser/Gly-free medium (n=3 independent experiments). Data are mean ±SEM. g, Immunofluorescence for H3K27me3 upon culture in serine free, glycine free, or Ser/Gly-free medium (n=3 independent experiments). Data are mean ±SEM. Statistical significance was determined using a two-way ANOVA with Sidak’s multiple comparison test for panel a, with Tukey’s multiple comparison test for panel d and g, and an ordinary one-way ANOVA with Tukey’s multiple comparison test for panels c and f. Scanned images of unprocessed blots are shown in Source Data Extended Fig. 5. Numerical data are provided in Statistics Source Data Extended Fig. 5.
Extended Data Fig. 6
Extended Data Fig. 6. Role of ROS, p53 and mTORC1 signaling in serine starvation response.
a-c, Representative immunofluorescence (a) and quantification of K14 (b) and H3K27me3 (c) in WT and SOX2+ cells cultured with cell-permeable esterified reduced glutathione (eGSH), the antioxidant Trolox, the JMJD3 inhibitor GSK-J4, or the EZH2 inhibitor GSK343, performed in triplicate. (n = 3 independent experiments). d-f, Representative immunofluorescence (d) and quantification of K14 (e) and H3K27me3 (f) in WT and SOX2+ cells in indicated conditions, (n = 3 independent experiments). g, Representative immunoblot of p53 stabilization upon 24 h Ser/Gly starvation or treatment with 10 μM of the MDM2 inhibitor Nutlin-3a, performed in duplicate. Experiment was performed in triplicate with similar results. h, RT-qPCR for expression of canonical p53 target genes (n=3 independent experiments). i, Representative immunoblot for phosphorylation of the mTORC1 target S6K following 24 h Ser/Gly starvation, performed in duplicate. Experiment was performed in triplicate with similar results. j, S6 phosphorylation in P0 mice on a control or Ser/Gly-free diet (n = 3 animals analyzed per condition). Scale bar = 50 μm. All data are mean ±SEM. Statistical significance was determined using an ordinary one-way ANOVA with Tukey’s multiple comparison test for panels b, c, e and f (P-values are relative to control) and a two-way ANOVA with Sidak’s multiple comparison test for panel h. Scanned images of unprocessed blots are shown in Source Data Extended Fig. 6. Numerical data are provided in Statistics Source Data Extended Fig. 6.
Extended Data Fig. 7
Extended Data Fig. 7. Mouse SCCs are sensitive to Ser/Gly starvation in vivo.
a. H3K27me3 levels in mouse SCCs grown in Nude mice on control or Ser/Gly-free diet (n=8 control tumors, n=5 –Ser/Gly tumors) Data are mean ±SEM. b, K10 expression in SCCs grown in Nude mice on control or Ser/Gly-free diet treated with 10 mg/kg GSK-J4 (n=6 tumors per condition). Data are mean ±SEM. c, Representative hematoxylin & eosin (H&E) of SCCs. Asterisks denote keratin pearls, arrows denote keratohyalin granules, arrowheads denote intercellular bridges, all signs of differentiation in SCCs. Three tumors were analyzed per condition with similar results. d, pS6 staining in SCCs (n=5 tumors per condition). Data are mean ±SEM. e-f, pS6 staining (e) and K10 staining (f) in SCCs grown in Nude mice treated with 4 mg/kg rapamycin. Three tumors were analyzed per condition with similar results. g, H3K27me3 staining in SCCs expressing RFP or LbNOX-Flag (n=3 tumors per condition). Data are mean ±SEM. h, K14 and K10 staining in SCCs expressing RFP or LbNOX-Flag (n=3 tumors per condition). Data are mean ±SEM. i, Tumor growth of SCCs expressing RFP or LbNOX-Flag (n=20 tumors per condition). Data are mean ±SEM. P-values are comparison to RFP control at end point. Statistical significance was determined using an unpaired two-tailed student’s t-test for panels a and d, and a two-way ANOVA with Tukey’s multiple comparison test for panels b, g, h and i. Numerical data are provided in Statistics Source Data Extended Fig. 7.
Extended Data Fig. 8
Extended Data Fig. 8. Human SCCs are sensitive to Ser/Gly starvation regardless of p53 status in vivo.
a-c, K14/K10 (a), H3K27me3 (b) and growth (c) of p53 mutant A431 human SCCs grown in Nude mice (n=4 tumors per condition for immunofluorescence analysis, n=20 tumors per condition for growth). Data are mean ±SEM. d-f K14/K10 (d), H3K27me3 (e) and growth (f) of p53 null SCC9 human SCCs grown in Nude mice (n=4 tumors per condition for immunofluorescence analysis, n=20 tumors per condition for growth). Data are mean ±SEM. g, Super-enhancer epicenter reporter expression in SCC9 SCCs grown in Nude mice (n=2 control reporter tumors, 6 mir21 tumors, 6 Klf5 tumors per condition). Data are mean. h, Immunohistochemistry of H3K27me3 in normal human skin and tongue. Statistical analysis was determined using an unpaired two-tailed student’s t-test for panels a, b, d and e, a two-way ANOVA with Tukey’s multiple comparison test for panels c and f, and with Sidak’s multiple comparison test for panel g. Numerical data are provided in Statistics Source Data Extended Fig. 8.
Extended Data Fig. 9
Extended Data Fig. 9. Glucose-derived serine synthesis suppresses tumorigenesis.
a, Representative PHGDH knockdown efficiency in mouse SCC cells. Experiment performed in duplicate independent experiments with similar results. b, Population doublings of shPhgdh SCC cells in vitro during 48 h of Ser/Gly starvation (n=3 biologically independent samples). c, Representative H&E of shScramble and shPhgdh SCCs. Asterisks denote keratin pearls, arrows denote keratohyalin granules, arrowheads denote intercellular bridges, all signs of differentiation in SCCs. Three tumors analyzed per condition with similar results. d-l, Immunofluorescence and analysis of SOX2 (d,e), K14 (f,g), Involucrin (h,i) and Ki67 (j-l) in shScramble and shPhgdh SCCs (n=3 tumors for shPhgdh-1 –Ser/Gly, n=4 tumors for all other conditions). m, Growth of SCCs (n=4 tumors per condition). n, Verification of Phgdh knockout by immunoblot in SCC cells. Experiment was performed in duplicate with similar results. sgRNA sequence information can be found in Supplementary Table 6. o, Population doublings of sgPhgdh SCC cells in vitro during 48 h of Ser/Gly starvation (n=3 biologically independent samles). p, Growth of sgPhgdh SCC cells orthotopically grafted into Nude mice (n=8 tumors for days 1–30, n=24 tumors for days 1–24). Scale bar = 50 μm. All data are mean ±SEM. Statistical significance was determined using a two-way ANOVA with Sidak’s multiple comparison test in panels b and o, with Tukey’s multiple comparison test in e, g and i, with Dunnett’s multiple comparison test in panel p, and an ordinary one-way ANOVA with Tukey’s multiple comparison test in panels k and l. Scanned images of unprocessed blots are shown in Source Data Extended Fig. 9. Numerical data are provided in Statistics Source Data Extended Fig. 9.
Extended Data Fig. 10
Extended Data Fig. 10. Serine starvation drives αKG-dependent demethylation in vivo.
a-b, OGDH (a) and SDHA (b) protein knockdown efficiency in SCC cells following 24 h in culture with or without doxycycline. Western blots performed in duplicate with similar results. shRNA sequences can be found in Supplementary Table 5. c, H&E of SCCs. Asterisks denote keratin pearls, arrows denote keratohyaline granules, arrowheads denote intercellular bridges, all signs of differentiation in SCCs. Three tumors were analyzed per condition with similar results. d, Bulk H3K27me3 levels in shRenilla, shOgdh and shSdha SCCs grafted into Nude mice on control or Ser/Gly-free diet. Three tumors were analyzed per condition with similar results. Scale bar = 50 μm. Scanned images of unprocessed blots are shown in Source Data Extended Fig. 10.
Fig. 1.
Fig. 1.. Pre-malignant epidermal stem cells are serine auxotrophs.
a, EdU incorporation into integrin-α6+ EpdSCs in P4 WT (R26-LSL-Sox2-IRES-eGFP) and SOX2+ (K14-Cre+/wt;R26-LSL-Sox2-IRES-eGFP) mice (n=4 mice per genotype). Data are mean ±SD. b, Growth of independently derived WT-1,2,3 and SOX2+−1,2,3 EpdSC cultures (n=3 independent experiments). Data are mean ±SD. c, Gas chromatography-mass spectrometry (GC-MS) of conditioned medium relative to control medium (n=6 biologically independent samples). Data are mean ±SEM. NEAA indicates non-essential amino acids that are consumed. d, Intracellular serine pools following 16 h of Ser/Gly starvation (n=3 biologically independent samples). Data are mean ±SEM. e, Proliferation of WT-1,2,3,4,5,6 and SOX2+−1,2,3,4,5,6 lines during 48 h of growth in indicated medium (n=6 independent experiments). Data are mean ±SEM. f, Population doublings of WT-1,2,3,4,5,6 and SOX2+−1,2,3,4,5,6 lines during 48 h of growth in indicated medium (n=6 independent experiments). Data are mean ±SEM. g, Schematic of intracellular serine sources. h-i, Labeling of serine from [U-13C]glucose in complete medium (n=3 biologically independent samples) (h) or in Ser/Gly-free medium (n=3 independent experiments) (i). Data are mean ±SD. j, GC-MS of the intracellular pyruvate/lactate ratio (n=3 biologically independent samples). Data are mean ±SEM. k, GC-MS of intracellular serine pools of SOX2 cells –Ser/Gly with or without 2 mM pyruvate (n=3 biologically independent samples). Data are mean ±SEM. l, Population doublings of EpdSCs cultured for 48 h in Ser/Gly-free medium with addition of PBS, 2 mM lactate or 2 mM pyruvate (n=3 biologically independent samples). Data are mean ±SEM. m, Schematic of LbNOX mechanism of action. n, Population doublings of EpdSCs expressing either RFP control or LbNOX during 48 h of Ser/Gly starvation (n=3 biologically independent samples). Data are mean ±SEM. o, Population doublings of EpdSCs expressing either RFP or LbNOX during 48 h of culture in indicated medium (n=3 biologically independent samples). Data are mean ±SEM. Scale bar = 50 μm. Statistical significance was determined using unpaired two-tailed student’s t-test for panels a, c d, h, j and k; two-way ANOVA with Sidak’s multiple comparison test in panels e and i, and two-way ANOVA with Tukey’s multiple comparison test in panel f, l, n, and o. Numerical data are provided in Statistics Source Data Fig. 1.
Fig. 2.
Fig. 2.. Restricting extracellular serine and glycine induces epidermal differentiation.
a, Imaging (left) and quantification (right) of EdU incorporation into K5+ EpdSCs in P0 WT and SOX2+ mice where mothers were maintained on control or Ser/Gly-free diet (n=5 mice per condition). Data are mean ±SEM. b, Immunofluorescence of the differentiated cell markers Involucrin (left) and K10 (right) in P0 mice on control or Ser/Gly-free diet (n=4 mice per condition). Data are mean ±SEM. Asterisk represents autofluorescence. c, Immunofluorescence (left) and quantification (right) of the differentiation reporter Krt10-H2B-mRFP in EpdSCs of P0 WT mice on control or Ser/Gly-free diet (n=4 mice per condition). Data are mean ±SEM. d, qPCR for the stem cell markers Krt5 and Krt14 (left) and differentiated cell markers Lor and Flg (right) following 24 h of Ser/Gly starvation (n=3 independent experiments). Data are mean ±SEM. Scale bar = 50 μm. Statistical significance was determined using a two-way ANOVA with Tukey’s multiple comparison test for panels a, b and d, and an unpaired two-tailed student’s t-test for panel c. Numerical data are provided in Statistics Source Data Fig. 2.
Fig. 3.
Fig. 3.. Serine synthesis drives α-ketoglutarate-dependent differentiation.
a, Schematic of serine synthesis and its byproducts. b, Immunofluorescence of K14 in WT shScramble or shPhgdh EpdSCs upon Ser/Gly starvation with DMSO or 4 mM DM-αKG (n=3 independent experiments). Data are mean ±SEM. Scale bar = 50 μm. c, Immunofluorescence of K14 in cells cultured with 4 mM DM-αKG in complete medium (n=3 independent experiments). Scale bar = 5 μm. Data are mean ±SEM. d-e, Intracellular αKG pools of WT and SOX2+ cells (d) or WT cells expressing the indicated hairpins (e) following 16 h of Ser/Gly starvation (n=3 biologically independent samples). Data are mean ±SEM. f, Immunofluorescence and quantification of K14 in cells cultured with DMSO, 1 mM formate, 4 mM DM-αKG, or 4 mM DM-succinate for 24 h (n=3 independent experiments). Data are mean ±SEM. Scale bar = 5 μm. Statistical significance was determined using a two-way ANOVA with Dunnett’s multiple comparison tests for panel b, with Sidak’s multiple comparison test for panel c, and with Tukey’s multiple comparison test for panel d. An ordinary one-way ANOVA with Dunnett’s multiple comparison test was used for panel e, and with Tukey’s multiple comparison test for panel f. Numerical data are provided in Statistics Source Data Fig. 3.
Fig. 4.
Fig. 4.. Serine synthesis drives αKG-dependent H3K27me3 loss.
a, Immunofluorescence and quantification of bulk H3K27me3 in cells cultured with DMSO or 4 mM DM-αKG for 24 h (n=3 independent experiments). Scale bar = 5 μm. Data are mean ±SEM. b, Immunofluorescence and quantification of bulk H3K27me3 in K14+ EpdSCs in P0 mice on control or Ser/Gly-free diet (n=5 control, 4 –Ser/Gly mice). Scale bar = 50 μm. Data are mean ±SEM. c-d, Immunofluorescence (c) and quantification (d) of H3K27me3 in WT shScramble or shPhgdh cells with our without 4 mM DM-αKG (n=3 independent experiments). Scale bar = 50 μm. Data are mean ±SEM. e, Immunofluorescence and quantification of bulk H3K27me3 in cells cultured with vehicle, 1 mM formate, 4 mM DM-αKG, or 4 mM DM-succinate for 24 h (n=3 independent experiments). Scale bar = 5 μm. Data are mean ±SEM. Statistical significance was determined using two-way ANOVA with Sidak’s multiple comparison test for panels a and b and Dunnett’s multiple comparison test for panel d. An ordinary one-wav ANOVA with Tukey’s multiple comparisons test was used in panel e. Numerical data are provided in Statistics Source Data Fig. 4.
Fig. 5.
Fig. 5.. Serine and glycine starvation suppresses tumor initiation and stem cell maintenance.
a, Schematic of DMBA/TPA tumor initiation study. b, Tumor free survival (left), tumor burden fourteen weeks after protocol initiation (middle), and representative mice 14 weeks after protocol initiation (right) of DMBA/TPA treated animals on control or Ser/Gly-free diet (n=5 mice per condition). Data are mean ±SEM. Asterisk are marker identification of tails. c, Tumor growth (left) and representative tumors (right) of SCC lines orthotopically grafted into Nude mice on control or Ser/Gly-free diet (n=8 tumors per condition). Data are mean ±SEM. d-e, Representative immunofluorescence (d) and quantification (e) of bulk H3K27me3 in DMBA/TPA derived tumors. (n=10 tumors per condition). Data are mean ±SEM. f-g, Representative immunofluorescence (f) and quantification (g) of stem cell (K14) and differentiation (K10) markers in DMBA/TPA derived (n=10 tumors per condition). Data are mean ±SEM. h-i, Representative immunohistochemistry (h) and scoring (i) for H3K27me3 levels in human cutaneous and head and neck SCCs (cSCC and HNSCC, respectively). See methods for detailed description of scoring method. For cSCCs n=49 grade 1, 19 grade 2, 6 grade 3. For HNSCCs, n=16 grade 1, 33 grade 2, 16 grade 3. Scale bar = 200 μm. Inset shows 20x image from core demonstrating nuclear staining in tumor cells. Scale bar = 50 μm unless otherwise noted. Statistical significance was determined using a log-rank (Mantel Cox) test for survival analysis in panel b, unpaired two-tailed student’s t-test for tumor burden in panel b, unpaired two-tailed student’s t-test for panels e and g, a two-way ANOVA with Sidak’s multiple comparison test in panel c, and a Chi-Square test in panel i. Numerical data are provided in Statistics Source Data Fig. 5.
Fig. 6.
Fig. 6.. Glucose-derived serine synthesis drives SCC differentiation.
a. Immunofluorescence and quantification of H3K27me3 (n=3 tumors for shPhgdh –Ser/Gly, all others n=4 tumors). Data are mean ±SEM. b, Immunofluorescence analysis and quantification of the stem cell marker CD44 (n=3 tumors for shPhgdh –Ser/Gly, all others n=4 tumors). Data are mean ±SEM. c, Immunofluorescence and quantification of the differentiated cell markers Keratin-10 in shScramble or shPhgdh SCC lines orthotopically grafted into Nude mice on control or Ser/Gly-free diet (n=3 tumors for shPhgdh –Ser/Gly, all others n=4 tumors). Data are mean ±SEM. d, Growth (left) and representative tumors (right) of shScramble or shPhgdh SCC lines orthotopically grafted into Nude mice (n=8 tumors per condition). Scale bar = 5 mm. Data are mean ±SEM. Scale bar = 50 μm unless otherwise noted. Statistical significance was determined using a two-way ANOVA with Tukey’s multiple comparison test for panels a, b and c, and Sidak’s multiple comparison test for panel d. Numerical data are provided in Statistics Source Data Fig. 6.
Fig. 7.
Fig. 7.. αKG drives SCC differentiation.
a, Schematic of TCA cycle highlighting OGDH and SDHA reactions. b, Representative GC-MS of intracellular αKG and succinate levels in mouse HRasG12V;Tgfbr2cKO SCC cells (n=3 biologically independent samples). Data are mean ±SEM. P-values are comparison to shRenilla values. c, Growth of shRenilla, shSdha, and shOgdh SCCs orthotopically grafted into Nude mice maintained on control (left) or Ser/Gly-free (right) diets (n=12 tumors). Data are mean ±SEM. P-values represent comparison to shRenilla tumor volume at end point. d-e, Representative immunofluorescence (d) and quantification (e) of stem cell (K14) and differentiation (K10) markers in shRenilla, shSdha, and shOgdh SCCs (n=5 tumors per condition). Data are mean ±SEM. Scale bar = 50 μm. Statistical significance was determined using a two way ANOVA with Tukey’s multiple comparison test in panels c and e, and an ordinary one-way ANOVA with Sidak’s multiple comparison test in panel a. Numerical data are provided in Statistics Source Data Fig. 7.

Comment in

References

    1. Ge Y & Fuchs E Stretching the limits: from homeostasis to stem cell plasticity in wound healing and cancer. Nat. Rev. Genet 19, 311–325 (2018). - PMC - PubMed
    1. Martincorena I et al. High burden and pervasive positive selection of somatic mutations in normal human skin. Science (80-.). 348, (2015). - PMC - PubMed
    1. Martincorena I et al. Somatic mutant clones colonize the human esophagus with age. Science eaau3879 (2018). doi: 10.1126/science.aau3879 - DOI - PMC - PubMed
    1. Blokzijl F et al. Tissue-specific mutation accumulation in human adult stem cells during life. Nature 538, 260–264 (2016). - PMC - PubMed
    1. Jaiswal S et al. Age-Related Clonal Hematopoiesis Associated with Adverse Outcomes. N. Engl. J. Med 371, 2488–2498 (2014). - PMC - PubMed

Publication types