. 2020 May 25;10(1):8629.
doi: 10.1038/s41598-020-65043-8.

RISK6, a 6-gene transcriptomic signature of TB disease risk, diagnosis and treatment response

Collaborators, Affiliations

RISK6, a 6-gene transcriptomic signature of TB disease risk, diagnosis and treatment response

Adam Penn-Nicholson et al. Sci Rep. .

Abstract

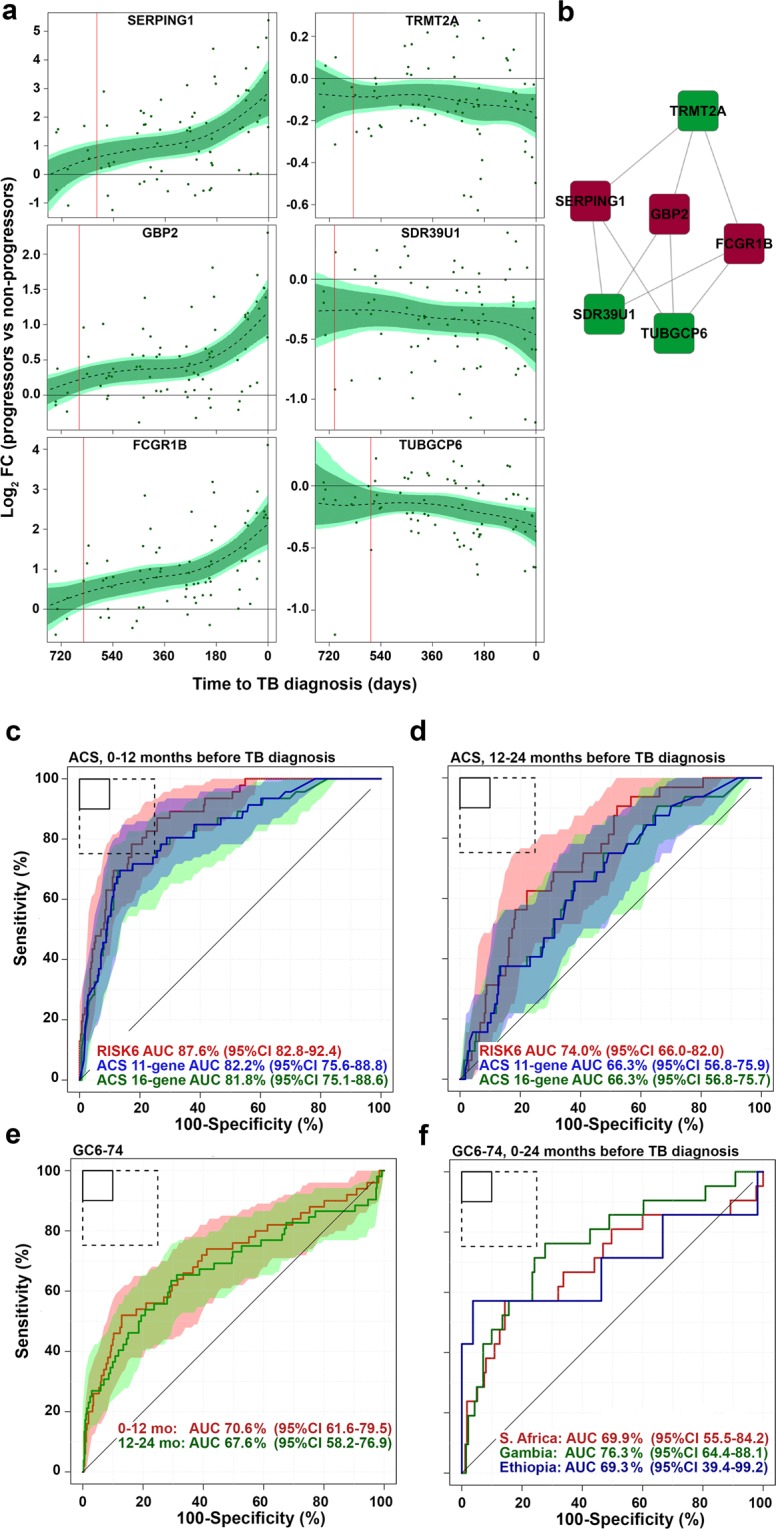
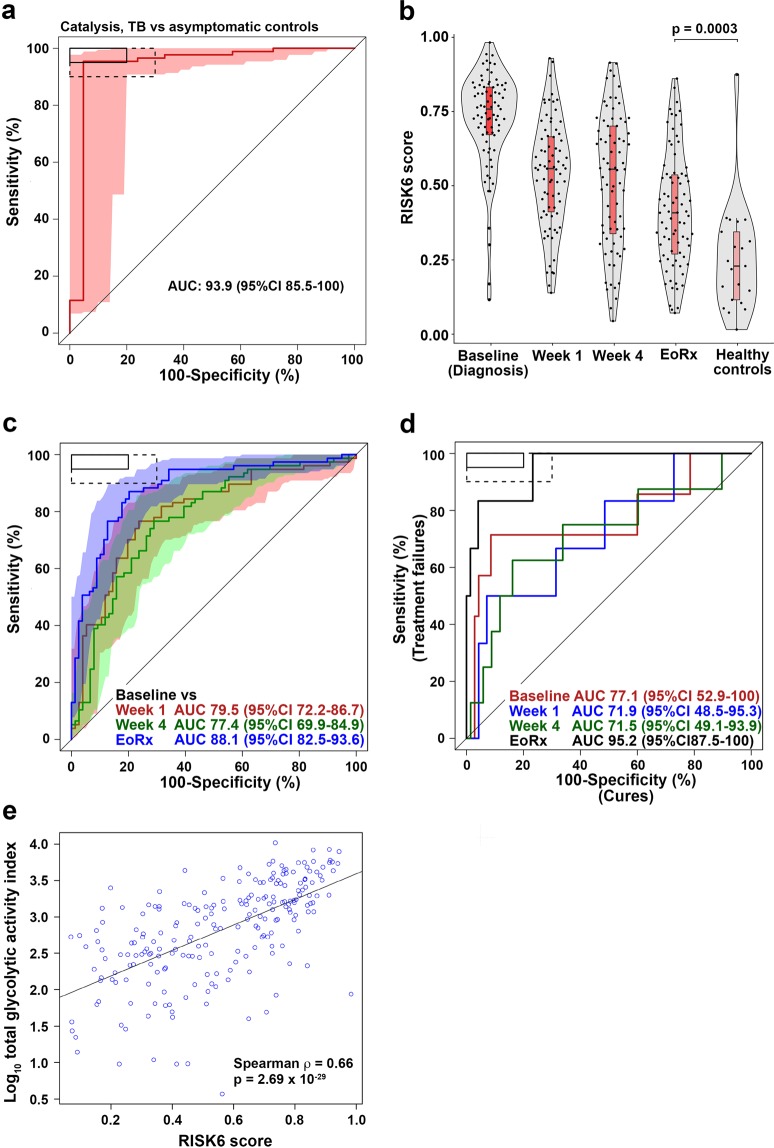
Improved tuberculosis diagnostics and tools for monitoring treatment response are urgently needed. We developed a robust and simple, PCR-based host-blood transcriptomic signature, RISK6, for multiple applications: identifying individuals at risk of incident disease, as a screening test for subclinical or clinical tuberculosis, and for monitoring tuberculosis treatment. RISK6 utility was validated by blind prediction using quantitative real-time (qRT) PCR in seven independent cohorts. Prognostic performance significantly exceeded that of previous signatures discovered in the same cohort. Performance for diagnosing subclinical and clinical disease in HIV-uninfected and HIV-infected persons, assessed by area under the receiver-operating characteristic curve, exceeded 85%. As a screening test for tuberculosis, the sensitivity at 90% specificity met or approached the benchmarks set out in World Health Organization target product profiles for non-sputum-based tests. RISK6 scores correlated with lung immunopathology activity, measured by positron emission tomography, and tracked treatment response, demonstrating utility as treatment response biomarker, while predicting treatment failure prior to treatment initiation. Performance of the test in capillary blood samples collected by finger-prick was noninferior to venous blood collected in PAXgene tubes. These results support incorporation of RISK6 into rapid, capillary blood-based point-of-care PCR devices for prospective assessment in field studies.


Conflict of interest statement

A.P.N., E.T., W.A.H., D.Z. and T.J.S. are co-inventors of a patent on RISK6. All other authors declare no competing interests.

Figures

Figure 1
Figure 1
Discovery of the RISK6 signature. (a) Expression kinetics of the six transcripts in RISK6 signature over time, measured by RNA-sequencing and expressed as log2 fold change between matched adolescent progressors and controls and modelled as non-linear splines (dotted lines). Light green shading represents 95% CI for the temporal trends, computed by performing 2000 spline fitting iterations after bootstrap resampling from the full dataset. Transcripts that are upregulated during TB progression are on the left and those that are downregulated on the right. (b) RISK6 comprises nine pairs that each link a transcript that is upregulated during TB progression with one that is downregulated, relative to healthy controls. Lines indicate pairing (refer to Table 1 for TaqMan primer-probe sets that match the transcripts). Transcripts that are upregulated in progressors are in red nodes and those that are downregulated in progressors are in green. (c and d) Receiver operating characteristic (ROC) curves depicting the performance (model fit) of RISK6, relative to the ACS 11-gene and ACS 16-gene signatures, measured by qRT-PCR on RNA from whole blood samples collected from participants of the ACS cohort within one year of TB disease diagnosis (c), or 1–2 years before TB diagnosis (d). Shaded areas depict the 95% CI. (e) Receiver operating characteristic (ROC) curves depicting prognostic performance, by blind prediction of RISK6, measured by qRT-PCR on RNA from whole blood RNA collected from participants of the GC6-74 cohort of household contacts. Shaded areas depict the 95% CI. (f) Prognostic performance of RISK6 for incident TB in household contacts from South Africa, The Gambia or Ethiopia, measured by qRT-PCR on RNA from whole blood RNA collected within 1 year of TB diagnosis from participants of the GC6-74 cohort. The boxes in the top left corner represent the optimal (solid line) and minimum (dotted line) criteria set out in the target product profile for an incipient TB test. Performance on 0–2 years before TB diagnosis is shown in Table 1.
Figure 2
Figure 2
Diagnostic performance of RISK6 as a triage test. (a and b) ROC curves depicting diagnostic performance of RISK6 (a) and the ACS 11-gene signature (b), for discrimination between active TB cases and Mtb-infected controls in HIV-negative or HIV-positive individuals. RISK6 was measured by qRT-PCR on RNA from whole blood. Shaded areas depict the 95% CI. The boxes in the top left corner represent the optimal (solid line) and minimum (dotted line) criteria set out in the target product profile for a screening/triage test for TB. (c) Comparison of RISK6 signature scores in Mtb-infected controls and active TB cases in HIV-negative or HIV-positive individuals. P-values were calculated using the Mann-Whitney U test. Horizontal lines represent medians; boxes represent the IQR and whiskers the range. Dots represent individual sample scores. (d) Relative differences in RISK6 transcript expression levels between HIV-negative and HIV-positive Mtb-infected controls (green) or active TB cases (orange). Dots depict medians and error bars the 95% CI, calculated from 1000 bootstrapped Ct values. The dashed line represents zero. (e) Comparison of RISK6 signature scores, by blind prediction, in patients with definite TB (with rigorous microbiological confirmation), patients with probable TB and in patients with other respiratory diseases (ORD). Horizontal lines depict medians, boxes the IQR and the whiskers the range. Violin plots depict the density of data points. P-values were computed by Mann-Whitney U test. (f) Receiver operating characteristic (ROC) curve depicting discrimination between diagnostic performance, by blind prediction of RISK6, measured by qRT-PCR in definite TB patients and patients with other respiratory diseases (ORD). Shaded areas depict the 95% CI. (g) ROC curves depicting RISK6 discrimination between definite TB and ORD participants of the ScreenTB and AE-TBC cohorts stratified into participants with no history of prior TB (black), or in those with a history of prior TB (red). Shaded areas depict the 95% CI.
Figure 3
Figure 3
Treatment monitoring using the RISK6 signature in the Catalysis TB Treatment Cohort. (a) ROC curve depicting diagnostic performance of RISK6 for discriminating between active TB cases (irrespective of treatment outcome), sampled prior to treatment initiation (baseline, n = 87), and controls (n = 21) from the Catalysis Cohort. Shaded areas depict the 95% CI. The boxes in the top left corner represent the optimal (solid line) and minimum (dotted line) criteria set out in the target product profile for a screening/triage test for TB. (b) Comparison of RISK6 signature scores in cases (irrespective of treatment outcome) from the Catalysis Cohort at baseline and week 1 or week 4 after treatment initiation and after treatment completion (EoRx). Also shown are the RISK6 signature scores in healthy controls. Horizontal lines depict medians, the boxes the IQR and the whiskers the range. Violin plots depict the density of data points. The p-value, computed by Mann-Whitney U test, compares RISK6 signature scores after treatment completion with those in controls. (c) ROC curves depicting performance of RISK6 for discriminating between baseline (pre-treatment) samples and samples collected after week 1, week 4 or completion of TB treatment. (d) Prediction of treatment failure using RISK6. ROC curves depict discrimination between cases with cure (n = 70) and those with treatment failure (n = 7) in samples collected at treatment initiation (Baseline, red), at week 1 (blue), week 4 (green) and after treatment completion (EoRx, black). (e) RISK6 scores plotted versus total glycolytic activity index measured by PET-CT for all available samples.
Figure 4
Figure 4
Diagnostic performance and treatment monitoring in South American cohorts. (a-b) ROC curve depicting diagnostic performance of RISK6 for discriminating between (a) culture-positive active TB cases (n = 48) and QuantiFERON-negative controls (n = 47), or between (b) culture-positive active TB cases (n = 48) and QuantiFERON-positive controls (n = 49) from the Peru Cohort. Shaded areas depict the 95% CI. The boxes in the top left corner represent the optimal (solid line) and minimum (dotted line) criteria set out in the target product profile for a screening/triage test for TB. (c) ROC curve depicting diagnostic performance of RISK6 for discriminating between culture-positive active TB cases, sampled prior to treatment initiation (baseline, n = 51), and controls (n = 99) from the RePORT-Brazil Cohort. (d) Comparison of RISK6 signature scores in TB cases at baseline, week 8 after treatment initiation and after treatment completion (Post Rx). Also shown are the RISK6 signature scores in healthy controls from Brazil. Horizontal lines depict medians, the boxes the IQR and the whiskers the range. Violin plots depict the density of data points. The p-value, computed by Mann-Whitney U test, compares RISK6 signature scores after treatment completion with those in controls. (e) ROC curves depicting performance of RISK6 for discriminating between healthy control samples and samples collected from TB cases before treatment initiation (baseline), at week 8 after treatment initiation, or completion of TB treatment (Post Rx). (f) ROC curves depicting performance of RISK6 for discriminating between baseline samples from TB cases and samples collected 8 weeks after treatment initiation, or upon completion of TB treatment (Post Rx).
Figure 5
Figure 5
Treatment monitoring using the RISK6 signature in the IMPRESS cohort. (a) Comparison of RISK6 signature scores in HIV-infected TB cases (irrespective of treatment outcome) from the IMPRESS cohort at baseline, month 2 after treatment initiation, at treatment completion (EoRx) and 6–8 months after treatment completion (Post Rx). Horizontal lines depict medians, the boxes the IQR and the whiskers the range. Violin plots depict the density of data points. (b) ROC curves depicting performance of RISK6 for discriminating between baseline (pre-treatment) samples and samples collected at month 2 after treatment initiation, at treatment completion (EoRx) and 6–8 months after treatment completion (Post Rx). Shaded areas depict the 95% CI. The boxes in the top left corner represent the optimal (solid line) and minimum (dotted line) criteria set out in the target product profile for a screening/triage test for TB. (c) ROC curve depicting performance of RISK6, measured at 2 months on TB treatment, for discriminating between TB cases who converted their sputum to negative by 2 months (early converters) and those who converted after 2 months. (d) Comparison of RISK6 signature scores in IMPRESS participants stratified by detectable (>400 RNA copies/mL plasma) vs. undetectable plasma HIV load (<400 RNA copies/mL plasma). Horizontal lines depict medians, the boxes the IQR and the whiskers the range. Violin plots depict the density of data points. The effect size is the relative difference in median plasma viral load and the p-value was calculated using Mann-Whitney U test.
Figure 6
Figure 6
Robustness of RISK6. (a) ROC AUC values for discrimination between HIV-uninfected TB cases and asymptomatic controls in the CTBC cohort by the full 6-gene RISK6 signature (9 pairs formed between 6 transcripts, far left), or after removing 1, 2, 3 or 4 of the transcripts such that every combination of the pairs (represented by individual blue dots) was tested. The grey bar graph represents the mean and the error bar the 95% CI. (b–d) ROC curves depicting performance of RISK6 for discriminating between TB cases and controls in the capillary blood cohort. Green curves represent RISK6 measured on 2.5 mL venous blood collected in PAXgene tubes. Blue curves represent RISK6 measured on 20 μL (b), 50 μL (c) or 100 μL (d) capillary blood collected by finger stick. Shaded areas depict the 95% CI. The Spearman correlation coefficients and associated p-values for comparison of RISK6 scores measured by 2.5 mL venous blood versus each capillary blood volume are shown. Only individuals with paired venous and capillary blood results were included in each comparison (i.e. venous blood results in those with a missing capillary blood value were excluded from each graph). ROC curves were compared using the DeLong paired test in R and resulting p-values are shown.

References

    1. World Health Organization. The end TB strategy. (2014).
    1. Churchyard GJ. A stratified approach to tuberculosis treatment. Nature medicine. 2018;24:1639–1641. doi: 10.1038/s41591-018-0244-y. - DOI - PubMed
    1. Imperial MZ, et al. A patient-level pooled analysis of treatment-shortening regimens for drug-susceptible pulmonary tuberculosis. Nature medicine. 2018;24:1708–1715. doi: 10.1038/s41591-018-0224-2. - DOI - PMC - PubMed
    1. World Health Organization. FIND. Development of a Target Product Profile (TPP) and a framework for evaluation for a test for predicting progression from tuberculosis infection to active disease. (2017).
    1. World Health Organization. High-priority target product profiles for new tuberculosis diagnostics: report of a consensus meeting. (2014).

Publication types

MeSH terms