. 2020 Jul;52(7):740-747.
doi: 10.1038/s41588-020-0631-4. Epub 2020 May 25.

Mendelian randomization accounting for correlated and uncorrelated pleiotropic effects using genome-wide summary statistics

Affiliations

Mendelian randomization accounting for correlated and uncorrelated pleiotropic effects using genome-wide summary statistics

Jean Morrison et al. Nat Genet. 2020 Jul.

Erratum in

Abstract

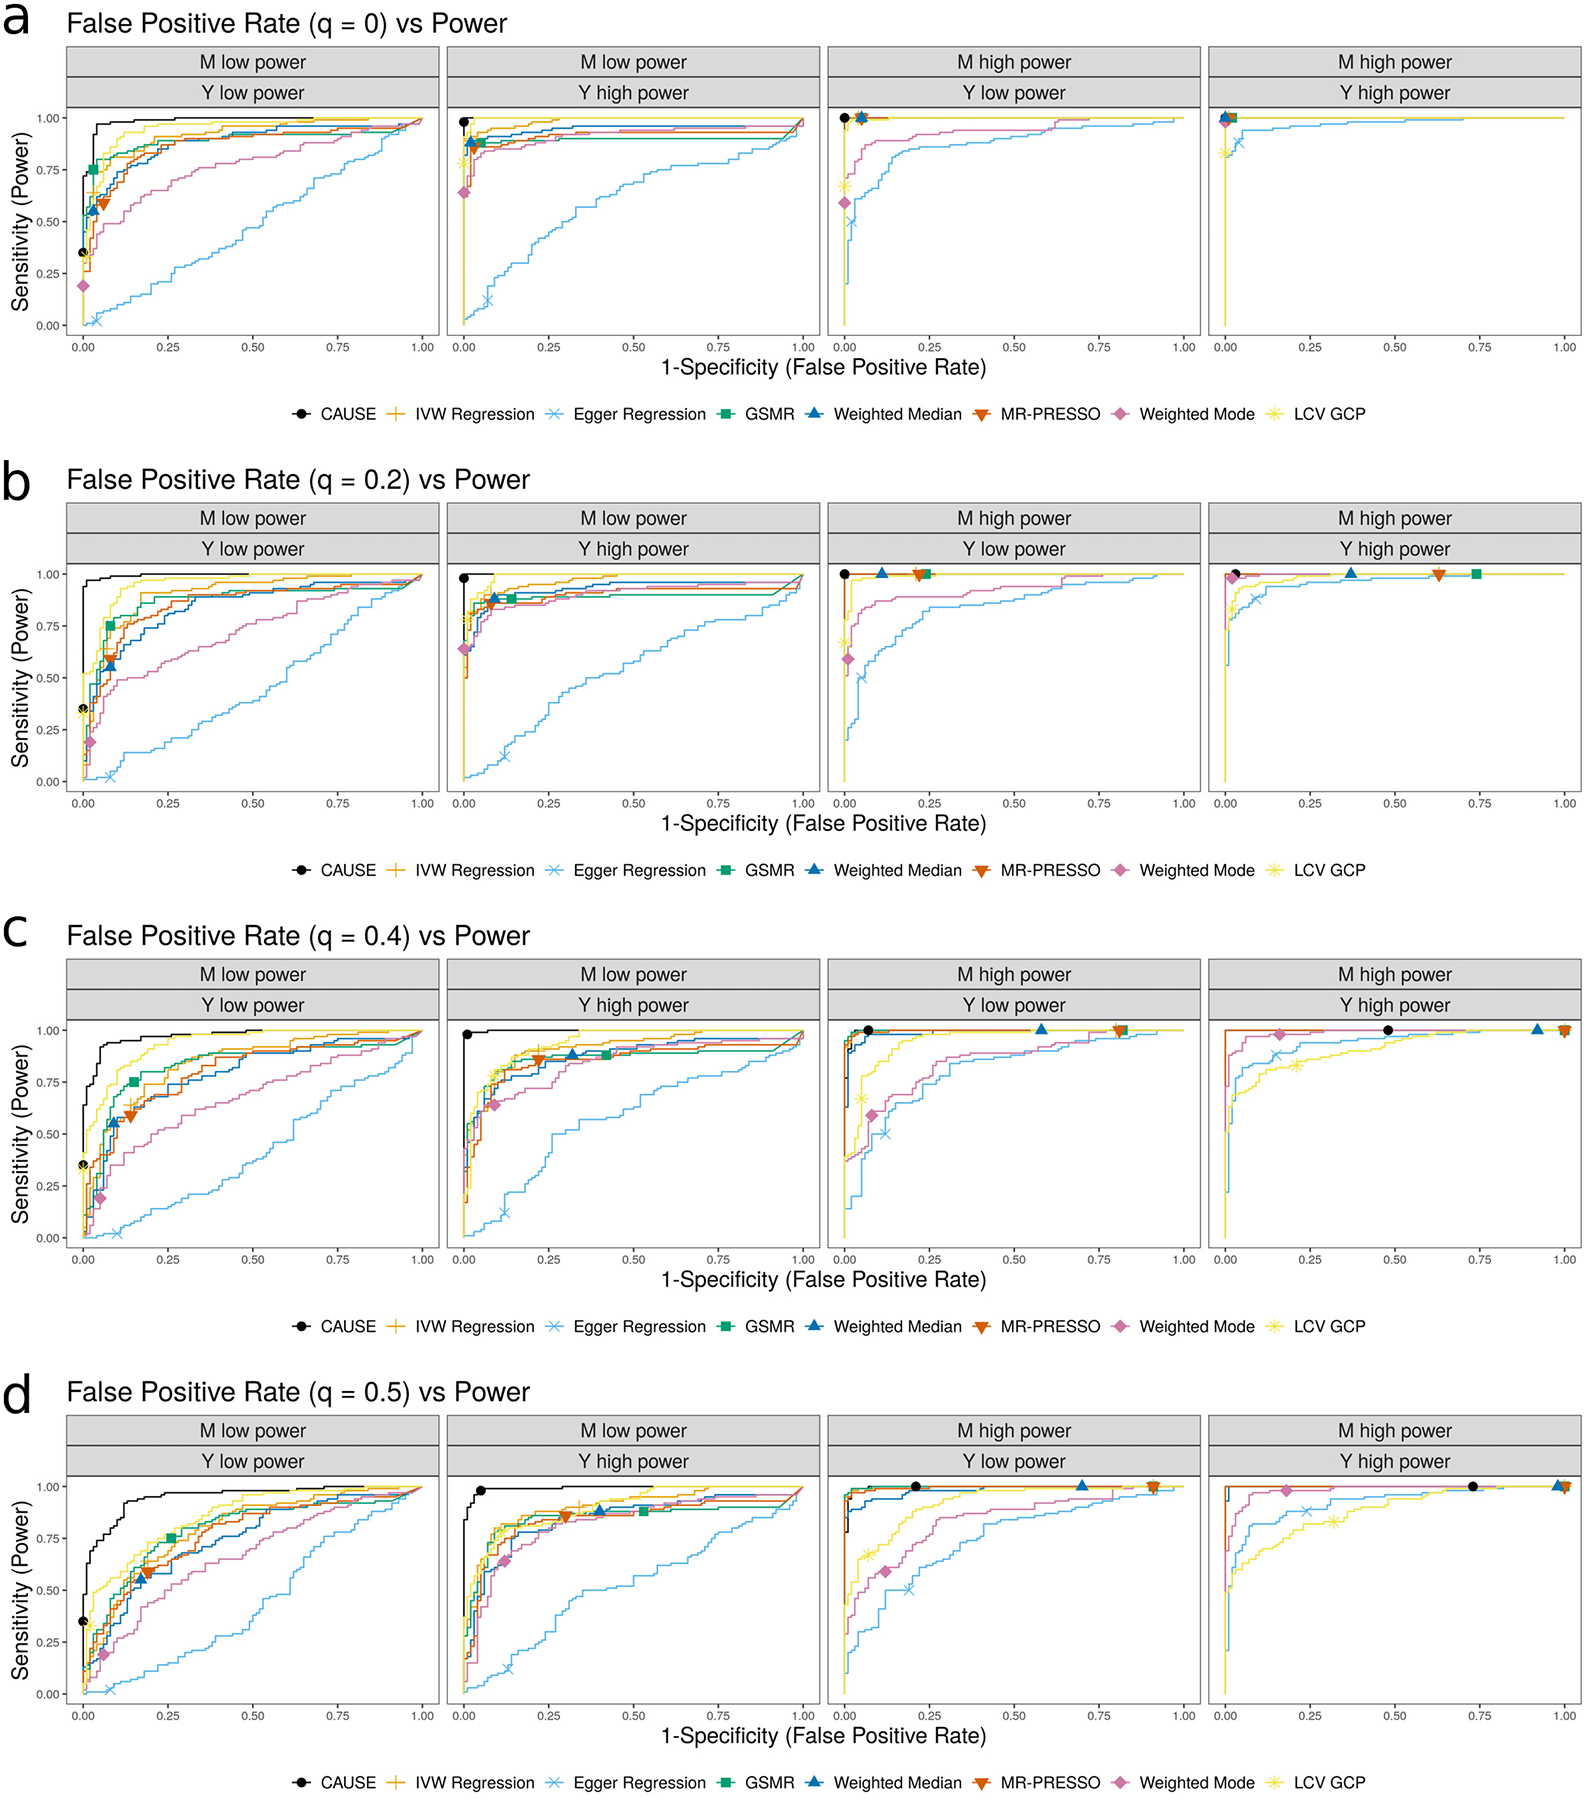
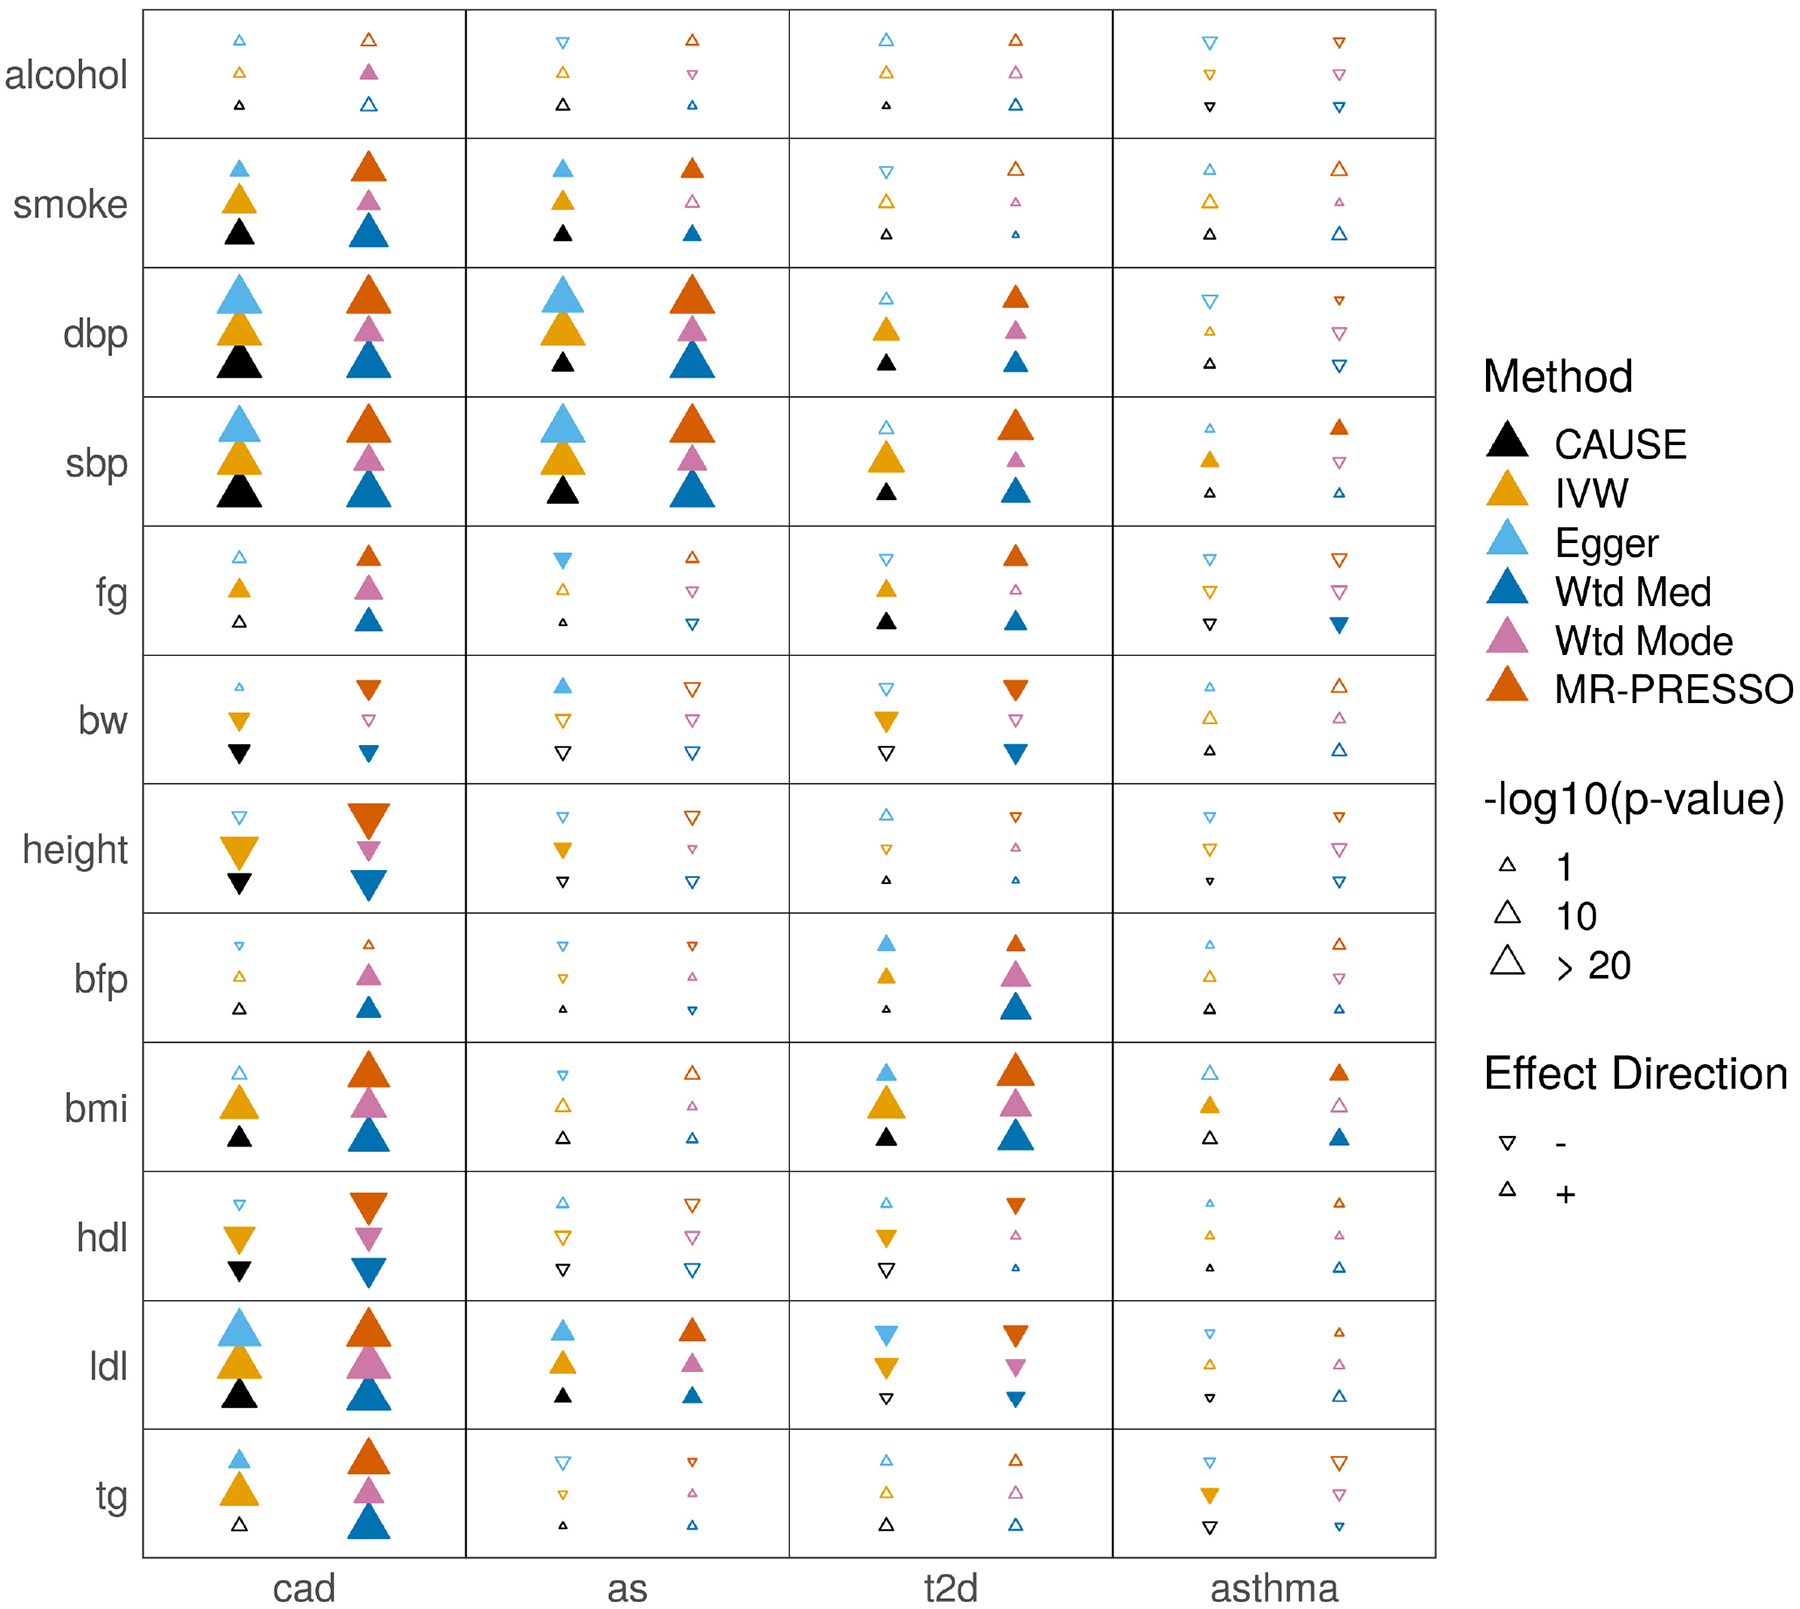
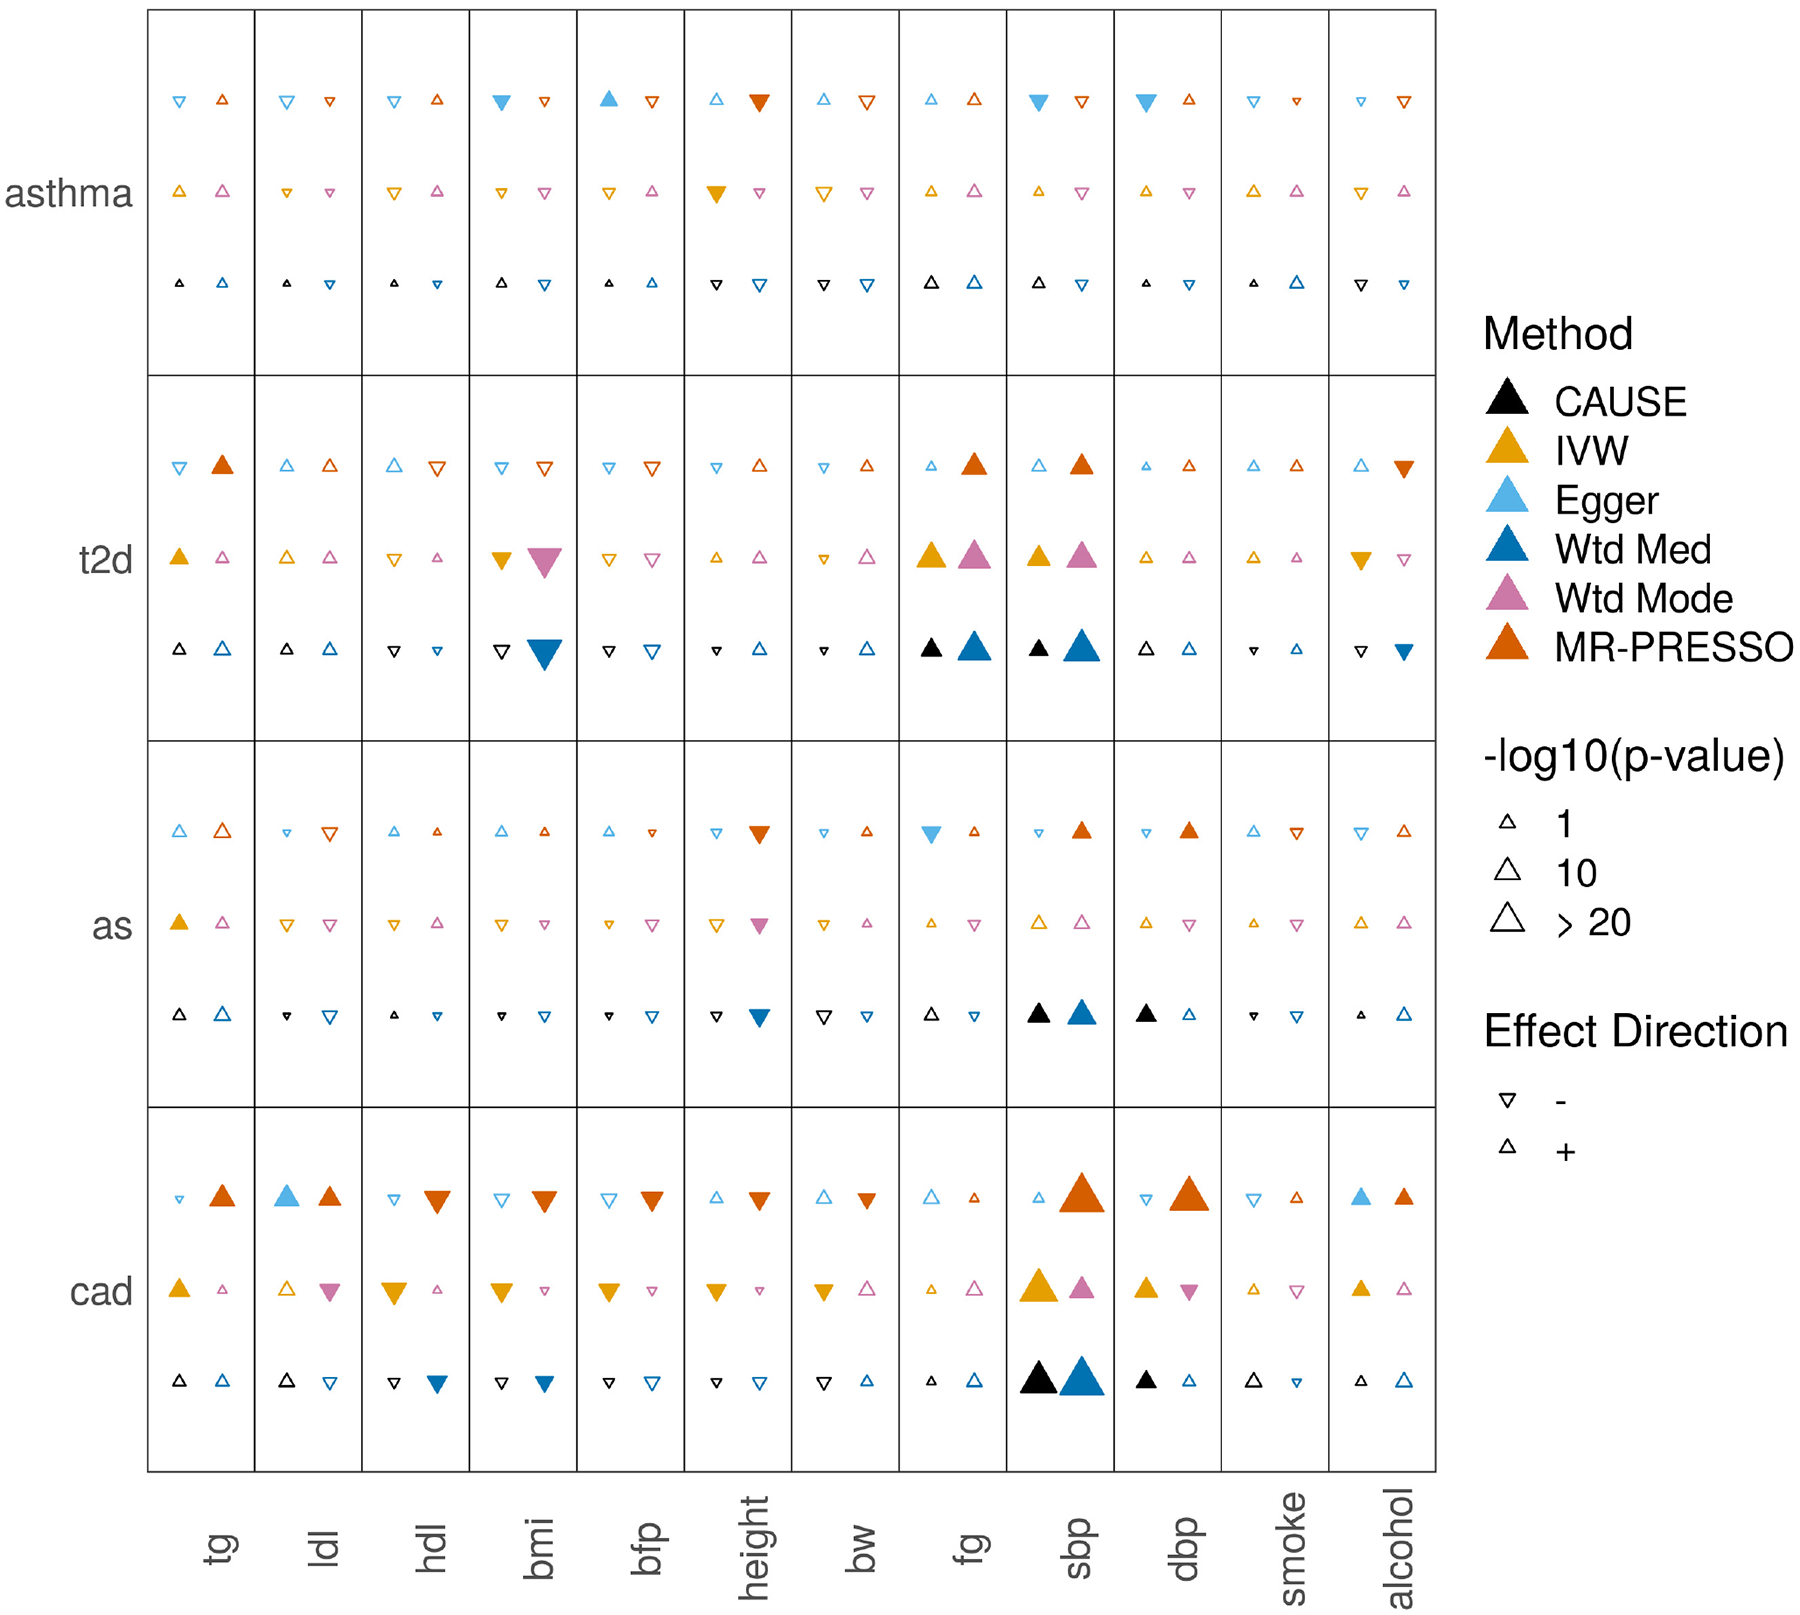
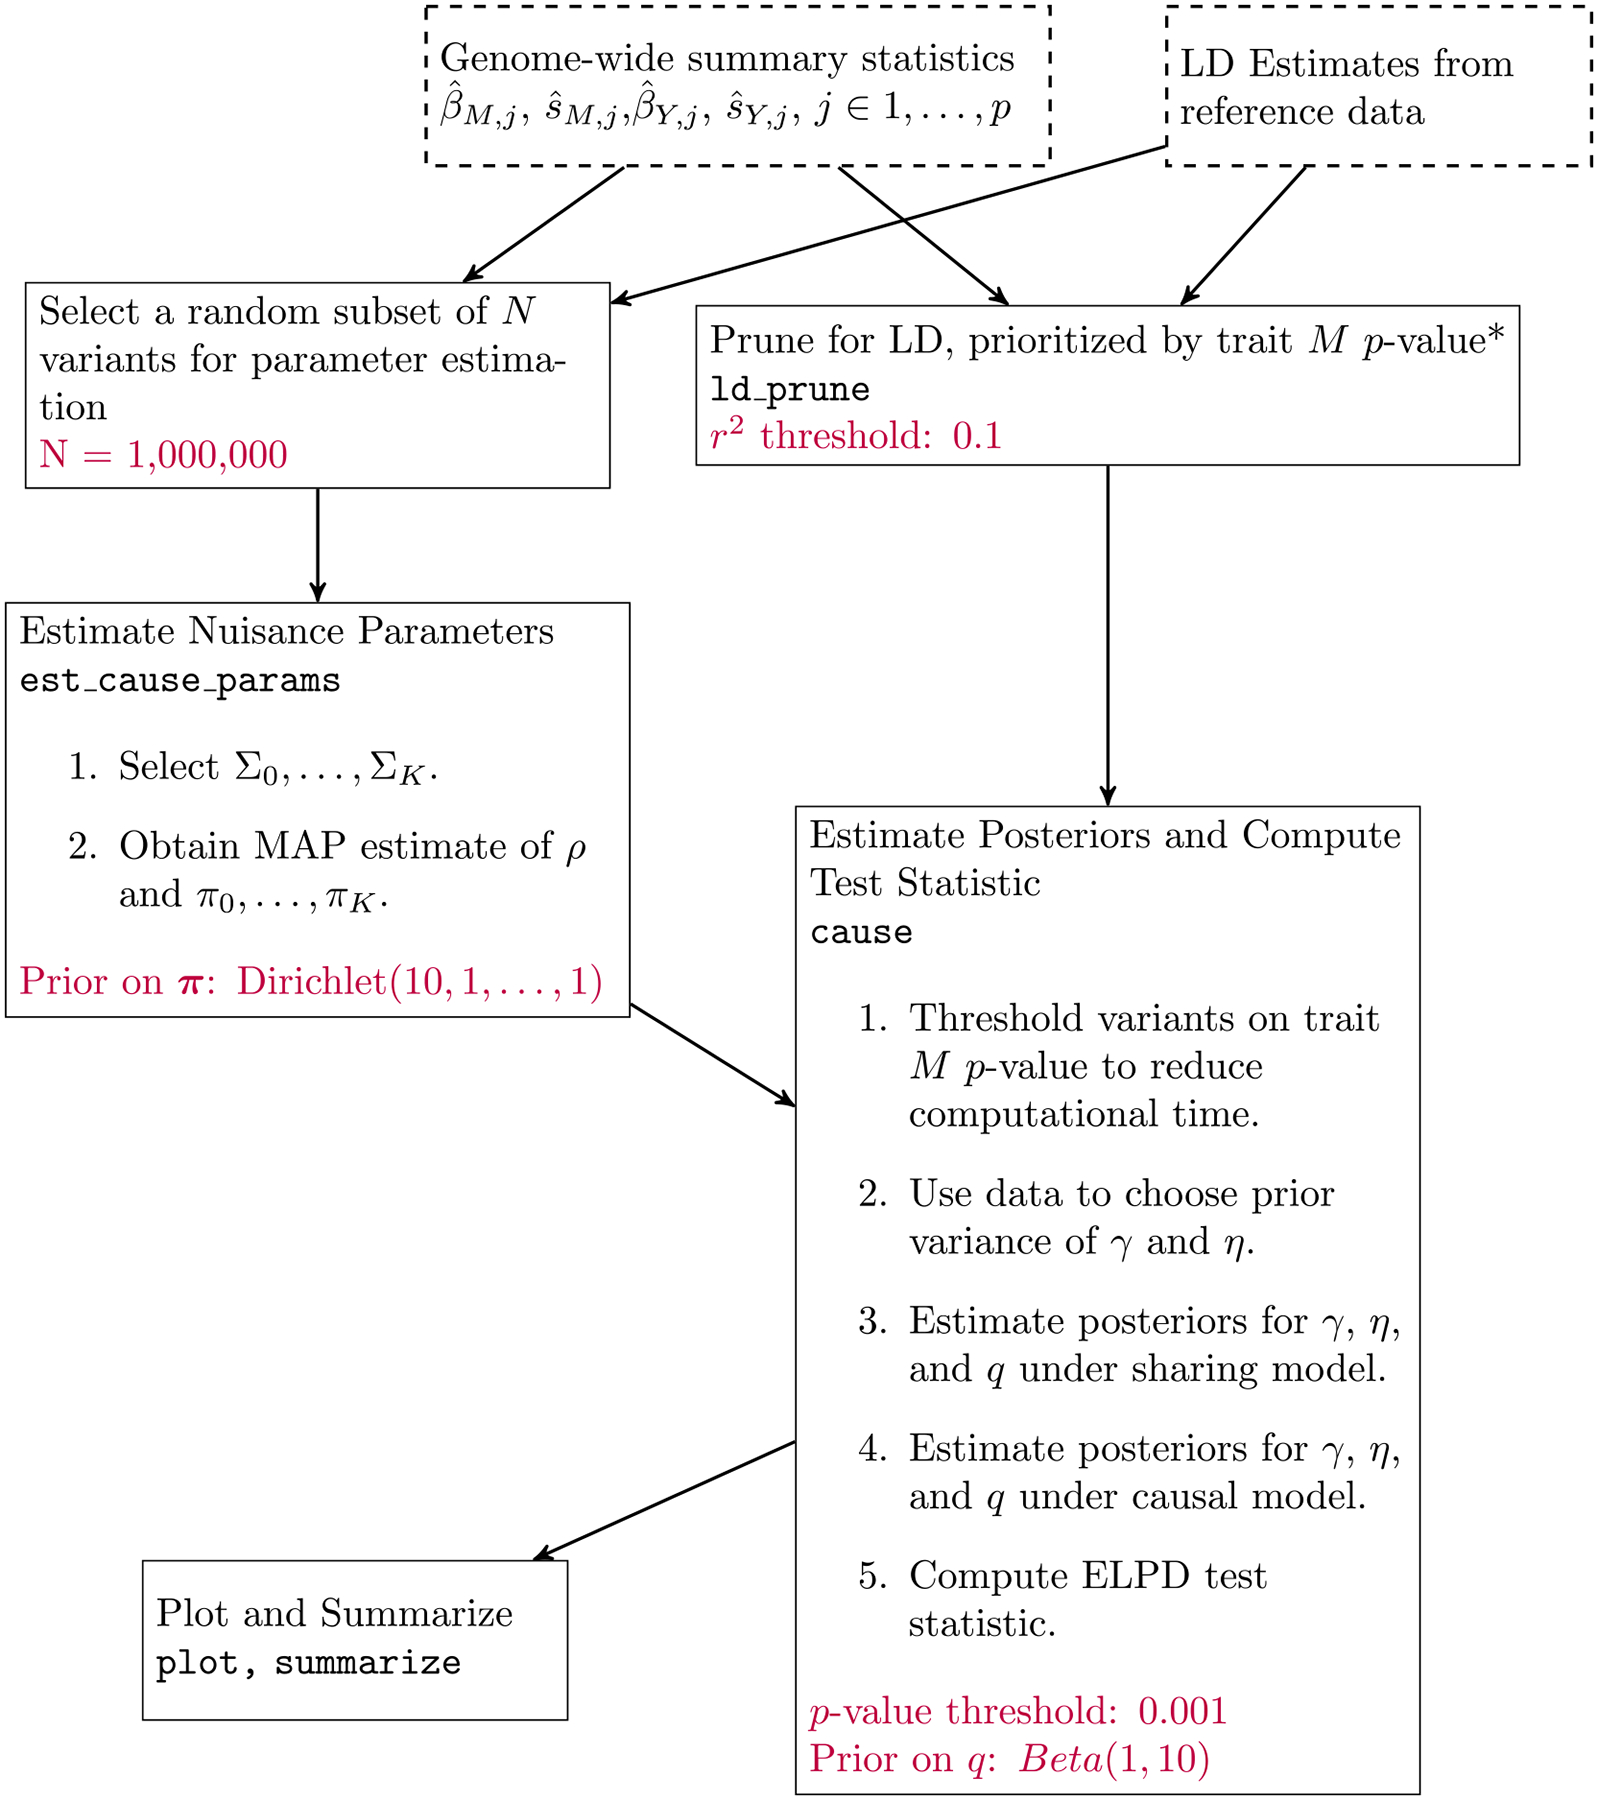
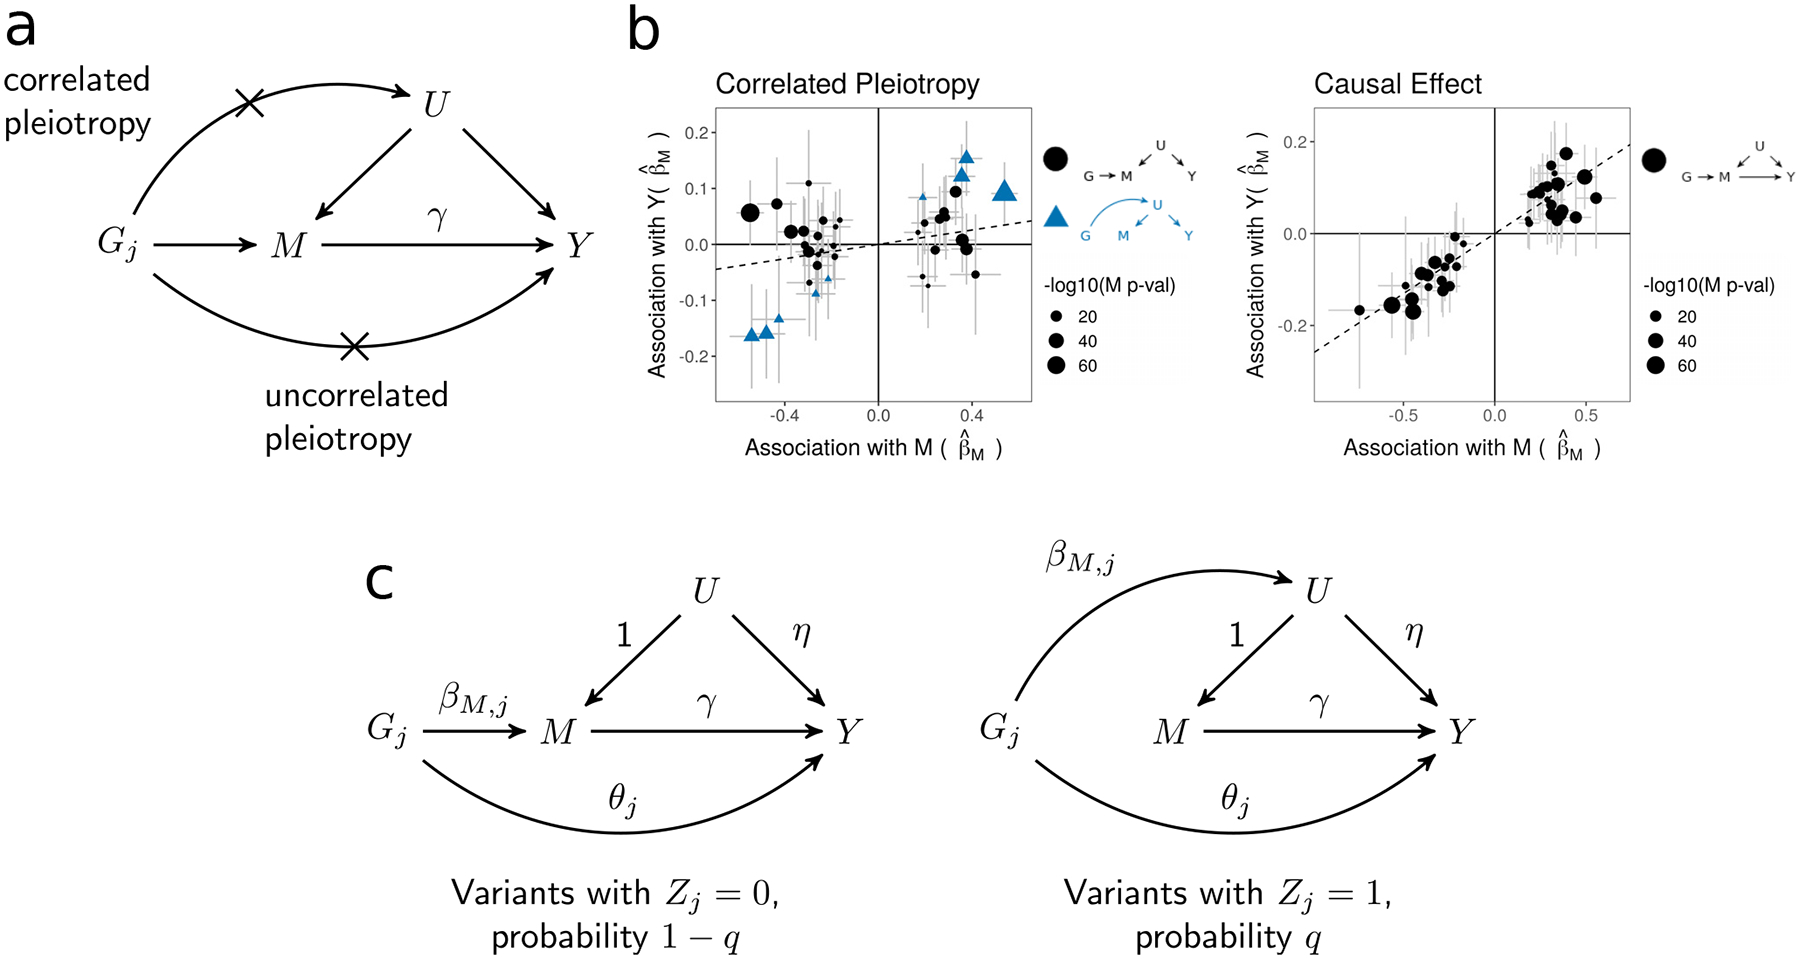
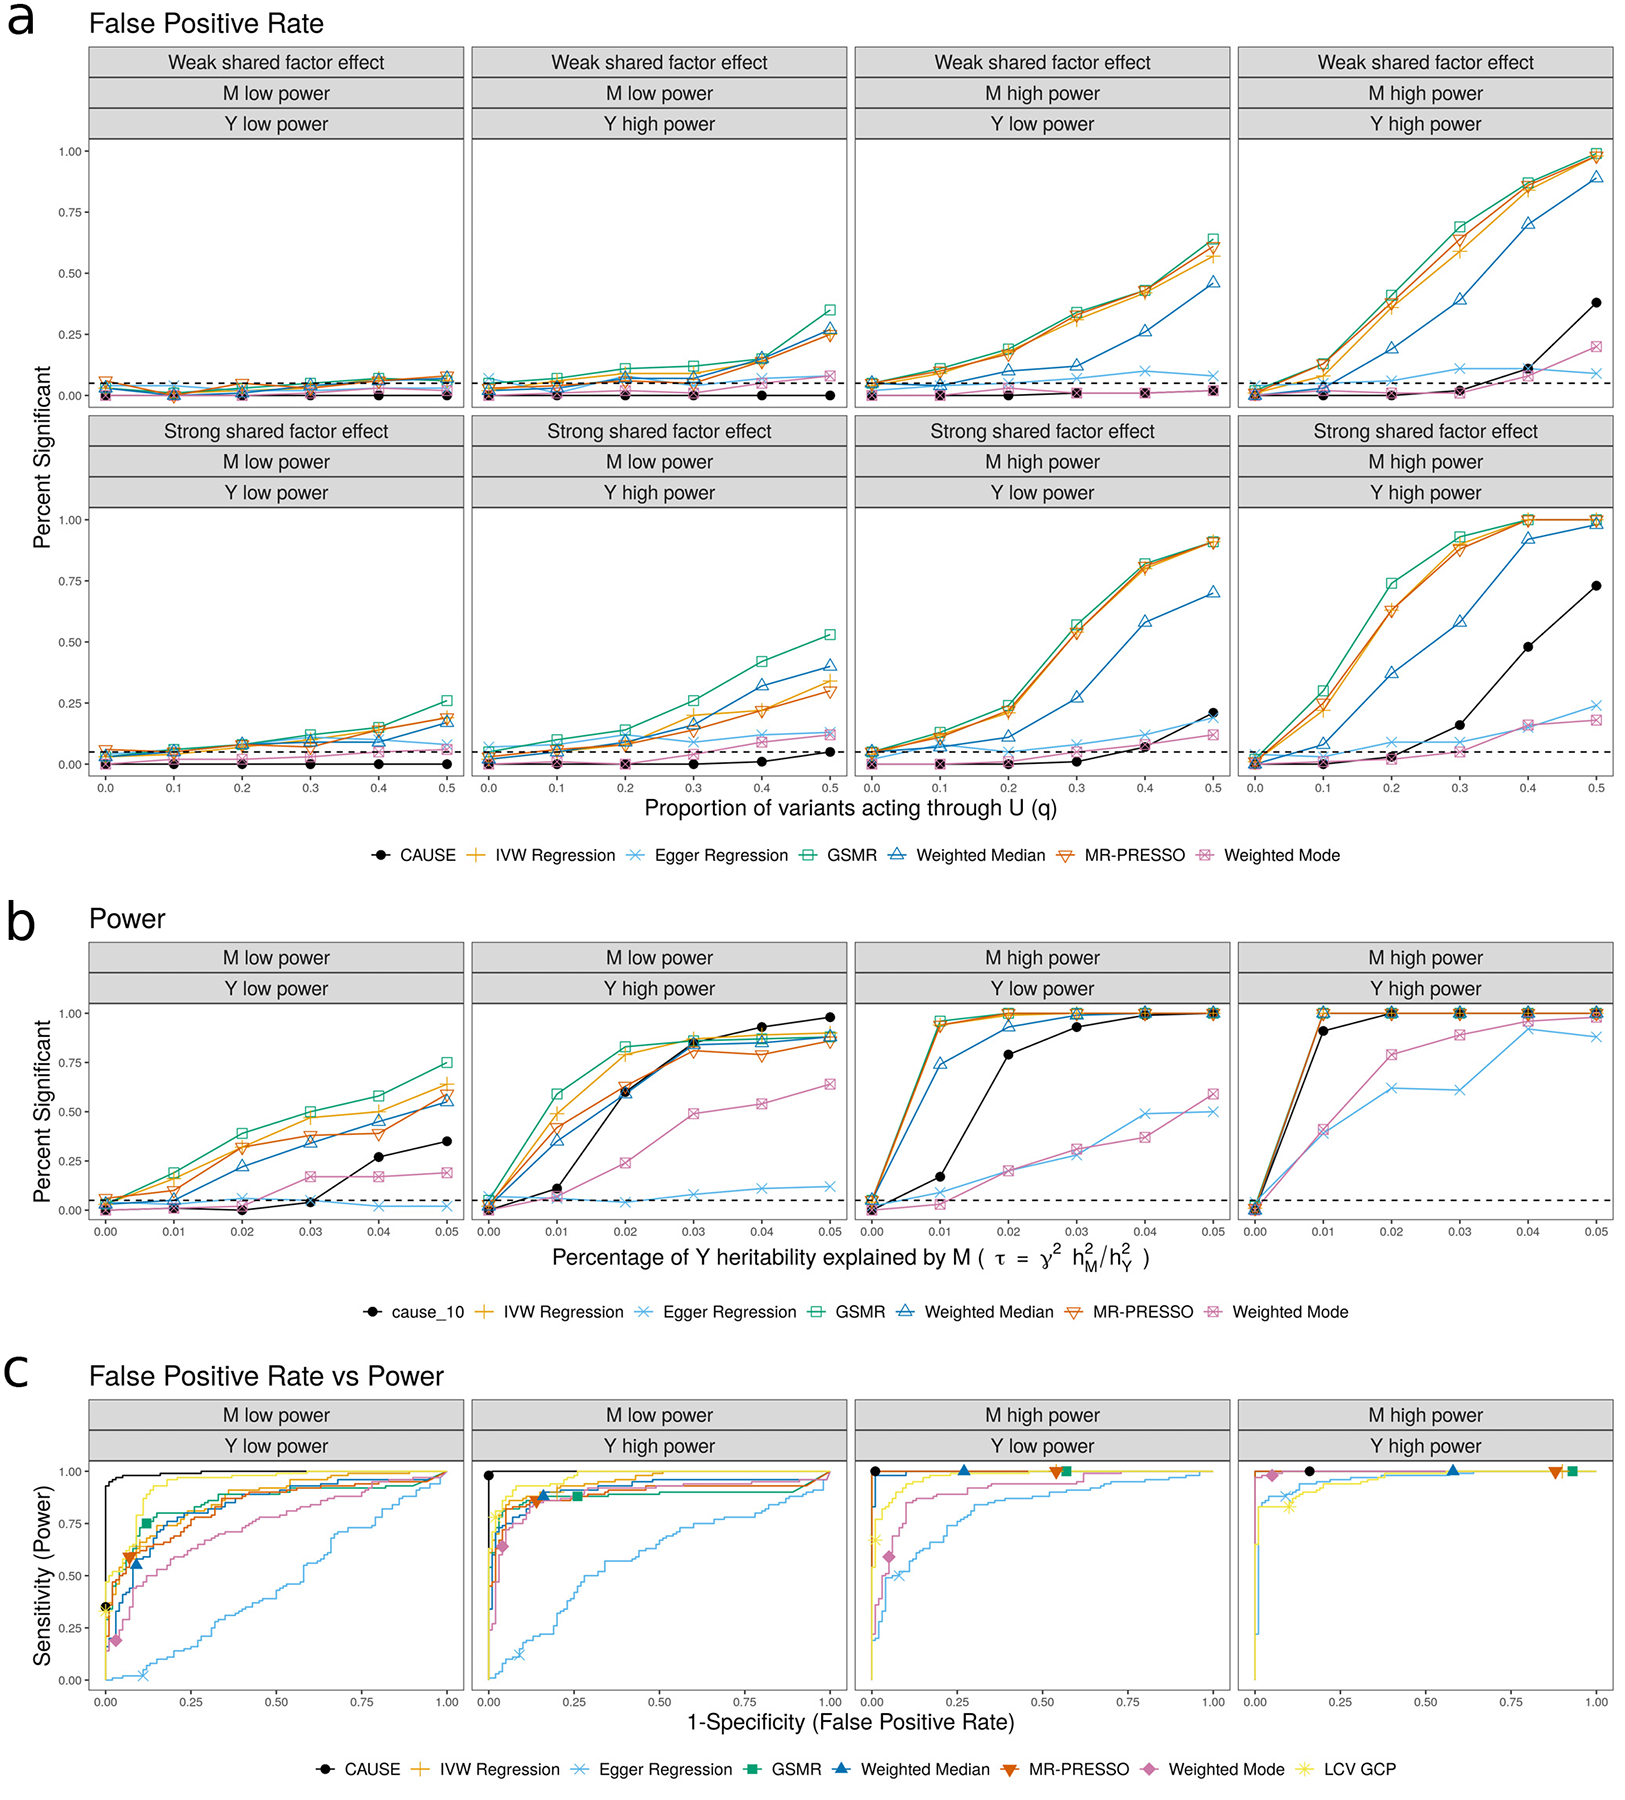
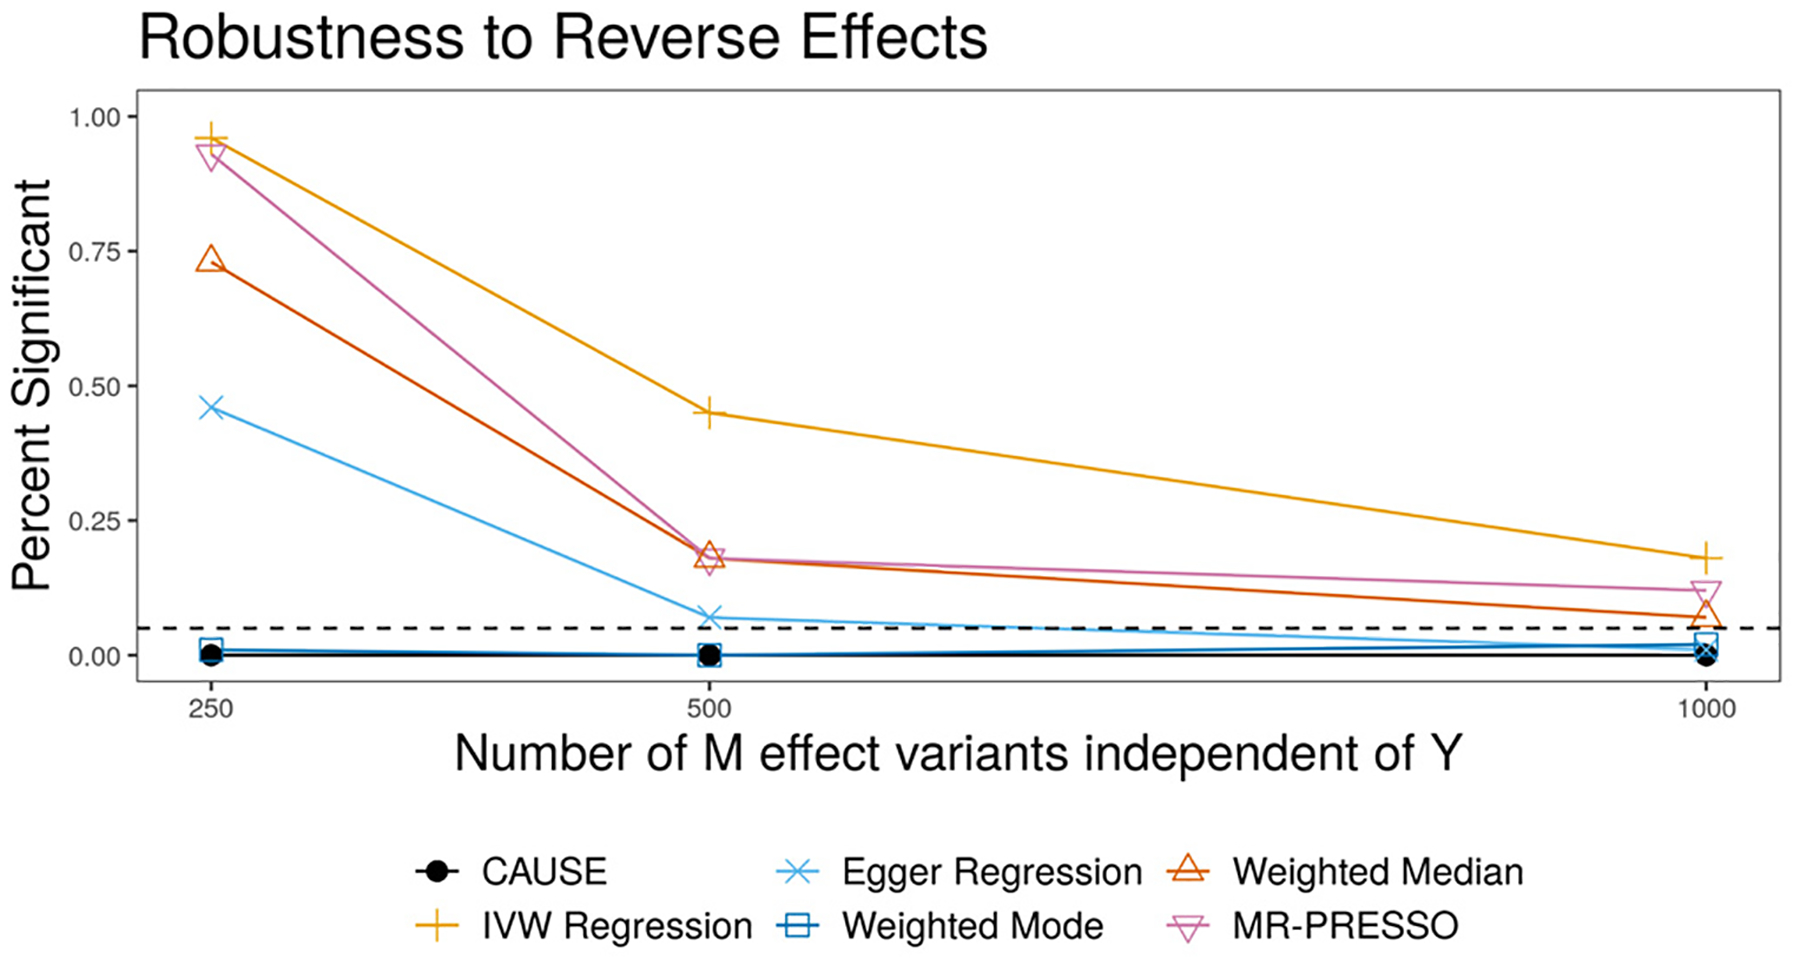
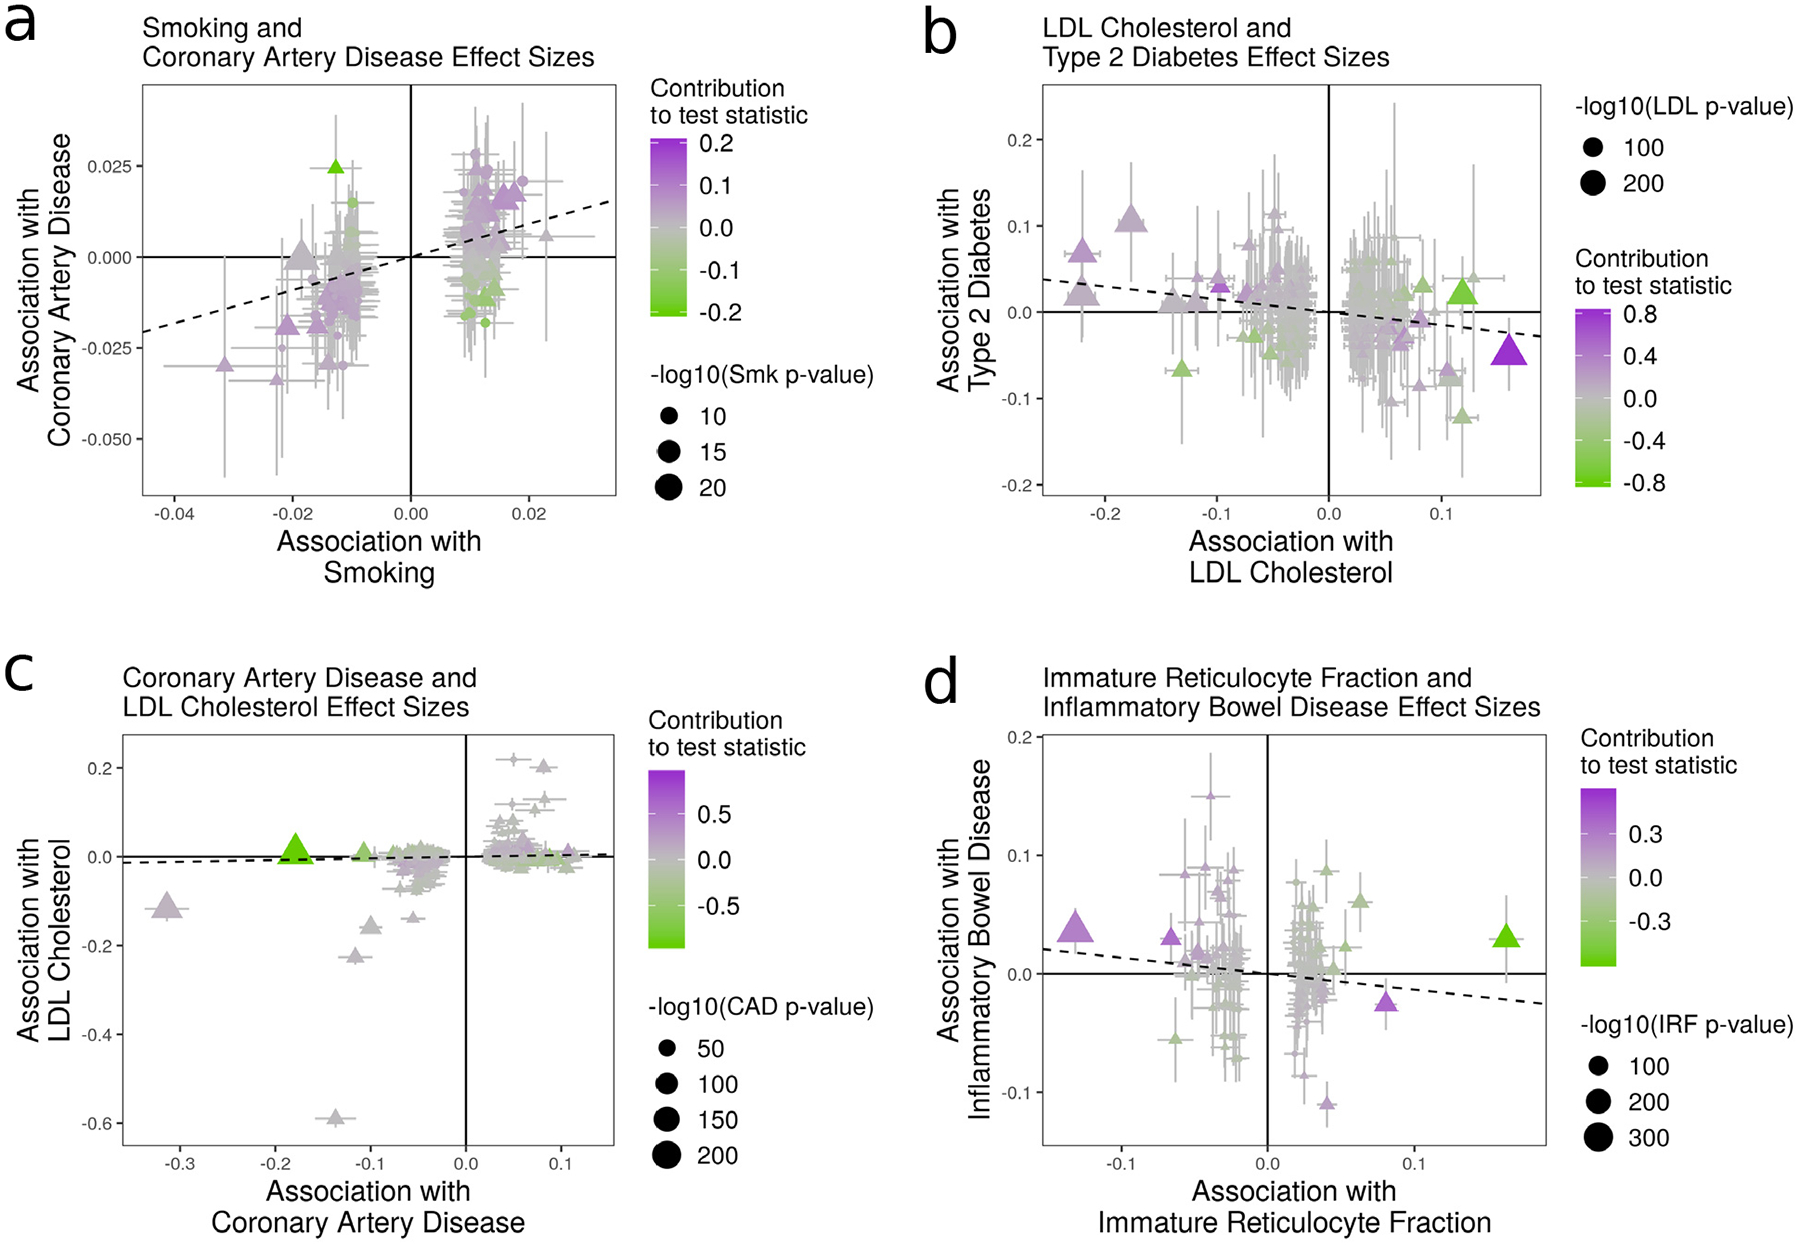
Mendelian randomization (MR) is a valuable tool for detecting causal effects by using genetic variant associations. Opportunities to apply MR are growing rapidly with the increasing number of genome-wide association studies (GWAS). However, existing MR methods rely on strong assumptions that are often violated, leading to false positives. Correlated horizontal pleiotropy, which arises when variants affect both traits through a heritable shared factor, remains a particularly challenging problem. We propose a new MR method, Causal Analysis Using Summary Effect estimates (CAUSE), that accounts for correlated and uncorrelated horizontal pleiotropic effects. We demonstrate, in simulations, that CAUSE avoids more false positives induced by correlated horizontal pleiotropy than other methods. Applied to traits studied in recent GWAS studies, we find that CAUSE detects causal relationships that have strong literature support and avoids identifying most unlikely relationships. Our results suggest that shared heritable factors are common and may lead to many false positives using alternative methods.


Conflict of interest statement

Competing Interests Statement

The authors declare no competing interests.

Figures

Extended Data Fig. 1
Extended Data Fig. 1. False positive-power trade-offs for different proportions of correlated pleiotropic variants.
We compare the power when γ=0.05 and q = 0 to the false positive rate when γ = 0, q varies from 0 to 0.5 and η=0.05. There are 100 simulations each in the causal and non-causal scenarios. Curves are created by varying the significance threshold. Points indicate the power and false positive rate achieved at a threshold of p = 0.05.
Extended Data Fig. 2
Extended Data Fig. 2. Tests for casual effects of risk factors on diseases.
Each cell summarizes the results of six methods for a pair of traits. In the left column of the cell, methods from bottom to top are CAUSE, IVW regression, and Egger regression. In the right column, methods from bottom to top are weighted median, weighted mode, and MR-PRESSO. Filled symbols indicate a nominally significant p = 0.05.
Extended Data Fig. 3
Extended Data Fig. 3. Tests for casual effects of disease outcomes on risk factors.
Tests for casual effects of disease outcomes on mediators. Each cell summarizes the results of six methods for a pair of traits. In the left column of the cell, methods from bottom to top are CAUSE, IVW regression, and Egger regression. In the right column, methods from bottom to top are weighted median, weighted mode, and MR-PRESSO. Filled symbols indicate a nominally significant p = 0.05.
Extended Data Fig. 4
Extended Data Fig. 4. Workflow of a CAUSE analysis.
Dashed boxes represent input data. Each solid box is an analysis step completed by the given function in the cause R package. LD pruning can be parallelized over chromosomes. Text at the bottom of boxes indicates user provided parameters and their default values. All analyses presented are run with default parameters.
Figure 1 |
Figure 1 |. Assumptions of traditional MR and CAUSE model.
a, Causal diagram assumed by traditional MR approaches. The causal effect of trait M on trait Y, γ, is the target of inference. Crosses mark horizontal pleiotropic effects that are assumed absent by traditional MR. b, Simulated effect estimates illustrating the pattern induced by a shared factor (correlated pleiotropy) with no causal effect (left), and the pattern induced by a causal effect (right). In both plots, effect size estimates for M and Y are indicated by points. Error bars around points have length 1.96 times the simulated standard error of the estimate on each side. SE’s are simulated with a sample size of 5,000. Only variants that are strongly associated with M (p < 5 · 10−8) are shown. c, CAUSE assumes that variants affect trait M through one of two mechanisms. A proportion 1 − q of variants have the left causal diagram, while the remaining proportion, q, have the right causal diagram.
Figure 2 |
Figure 2 |. Performance of CAUSE and other MR methods in simulated data.
a, False positive rate averaged over 100 simulated data sets in settings with no causal effect and a proportion of correlated pleiotropic variants ranging from 0 to 50%. b, Power averaged over 100 simulated data sets in settings with a causal effect and no shared factor. c, Comparison of false positive-power trade-off. We compare the power when γ=0.05 and q = 0 to the false positive rate γ = 0, q = 0.3 and η=0.05. There are 100 simulations each in the causal and non-causal scenarios. Curves are created by varying the significance threshold. Points indicate the power and false positive rate achieved at a threshold of p ≤ 0.05 or GCP^>0.6 for LCV.
Figure 3 |
Figure 3 |. False positives resulting from reverse causal effects.
Data are simulated with a true effect of Y on M, but tests are performed for an effect of M on Y. Each point shows the average over 100 simulations. Only CAUSE and the weighted mode control the false positive rate.
Figure 4 |
Figure 4 |. Effect size estimates and variant level contribution to CAUSE test statistics for four trait pairs.
Effect estimates for trait M (horizontal axis) are plotted against estimates for trait Y (vertical axis). Error bars have length 1.96 times the standard error of the estimate. Triangles indicate variants reaching genome-wide significance for trait M (p < 5 · 10−8). Variants with trait M p-value < 5 · 10−6 are shown. Dotted lines show the IVW estimate obtained using only genome-wide significant variants. a, Smoking (M) and CAD (Y). All methods detect evidence of a causal effect. b, LDL (M) and T2D (Y). Only CAUSE does not detect a causal effect. Under the CAUSE model, these data can be explained by a shared factor accounting for 13% of LDL cholesterol effect variants. c, CAD (M) and LDL cholesterol (Y). CAUSE avoids a likely false positive obtained by other methods as a result of a reverse direction effect. Egger regression, the weighted mode, and MR-PRESSO all find a significant effect (see Supplementary Table 5). d, IRF (M) and IBD (Y). MR-PRESSO, the weighted median, and modal estimators obtain a positive result by downweighting or removing variants supplying conflicting evidence.
Figure 5 |
Figure 5 |. Tests for causal effects of blood cell composition on immune mediated traits.
Each cell summarizes the results of six methods for a pair of traits. Filled symbols indicate p-value < 0.05. Blood cell traits are grouped into platelet traits (PLT), red blood cell traits (RBC), and white blood cell traits (WBC).

References

    1. Smith GD & Ebrahim S ‘Mendelian randomization’: can genetic epidemiology contribute to understanding environmental determinants of disease? Int. J. Epidemiol 32, 1–22 (2003). - PubMed
    1. Smith GD & Hemani G Mendelian randomization: Genetic anchors for causal inference in epidemiological studies. Hum. Mol. Genet 23, 89–98 (2014). - PMC - PubMed
    1. Boef AGC, Dekkers OM & Le Cessie S Mendelian randomization studies: a review of the approaches used and the quality of reporting. Int. J. Epidemiol 44, 496–511 (2015). - PubMed
    1. Zhang G et al. Genetic associations with gestational duration and spontaneous preterm birth. N. Engl. J. Med 377, 1156–1167 (2017). - PMC - PubMed
    1. Burgess S, Dudbridge F & Thompson SG Combining information on multiple instrumental variables in Mendelian randomization: Comparison of allele score and summarized data methods. Stat. Med 35, 1880–1906 (2016). - PMC - PubMed

Publication types