. 2020 May 25;10(1):8637.
doi: 10.1038/s41598-020-65596-8.

Immunotoxicity of polystyrene nanoplastics in different hemocyte subpopulations of Mytilus galloprovincialis

Affiliations

Immunotoxicity of polystyrene nanoplastics in different hemocyte subpopulations of Mytilus galloprovincialis

Marta Sendra et al. Sci Rep. .

Abstract

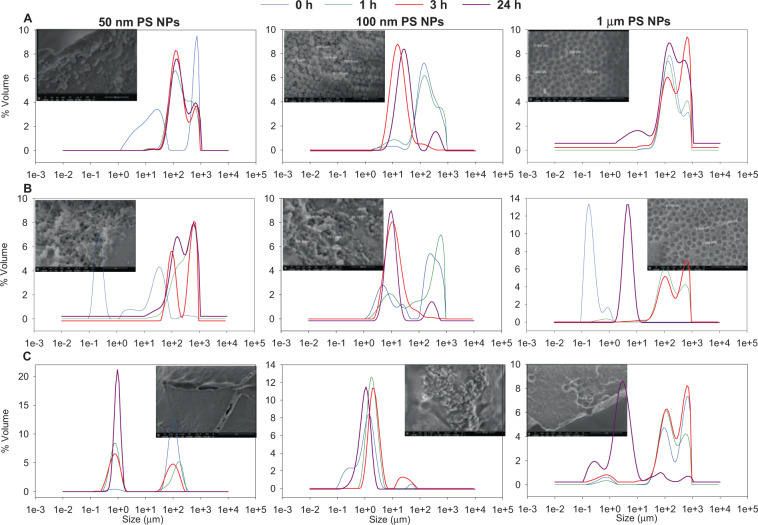
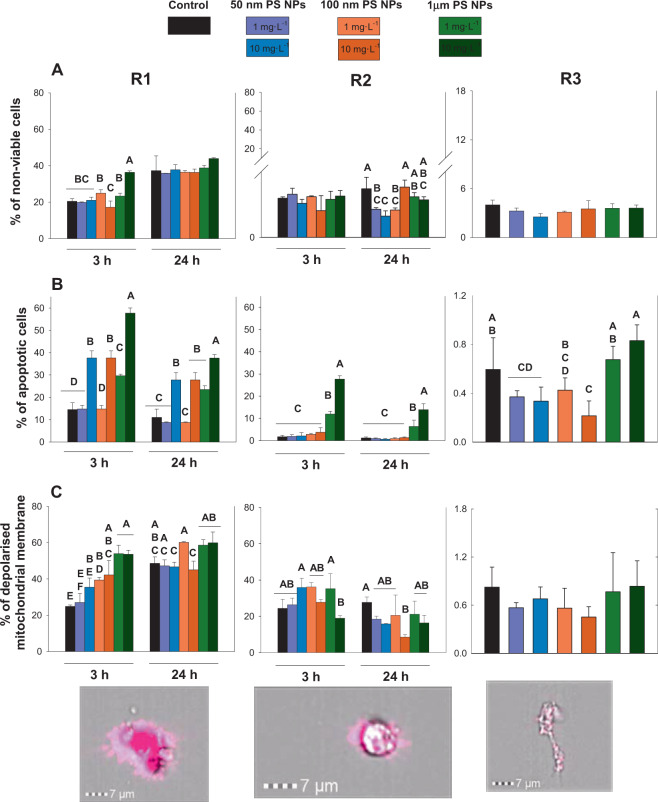
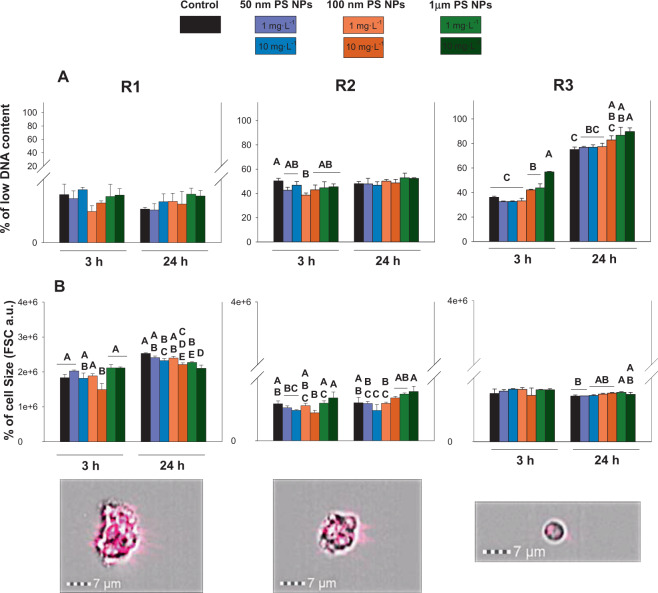
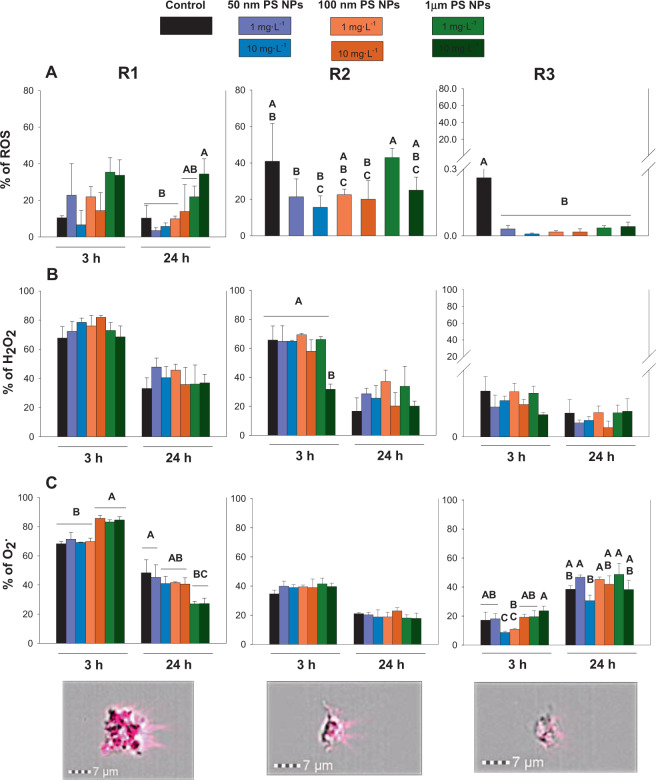
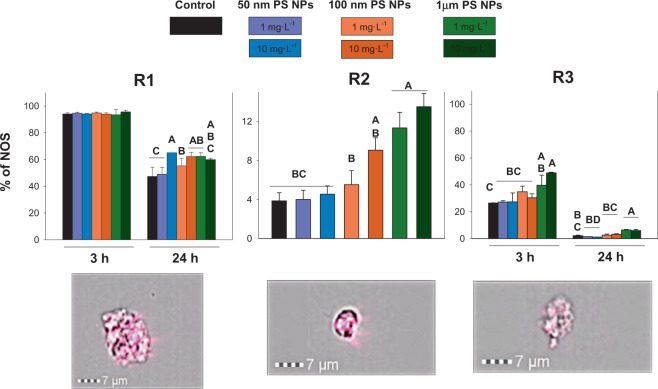
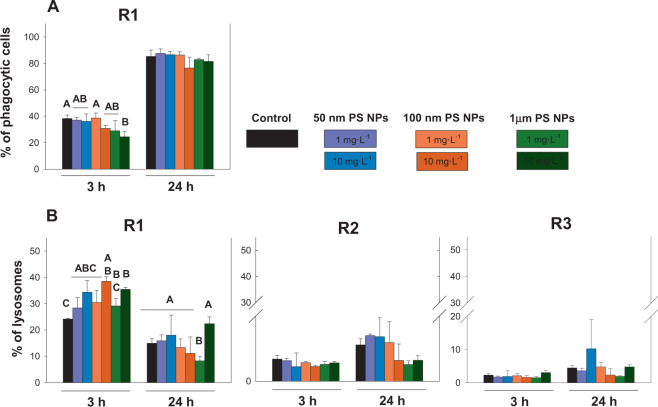
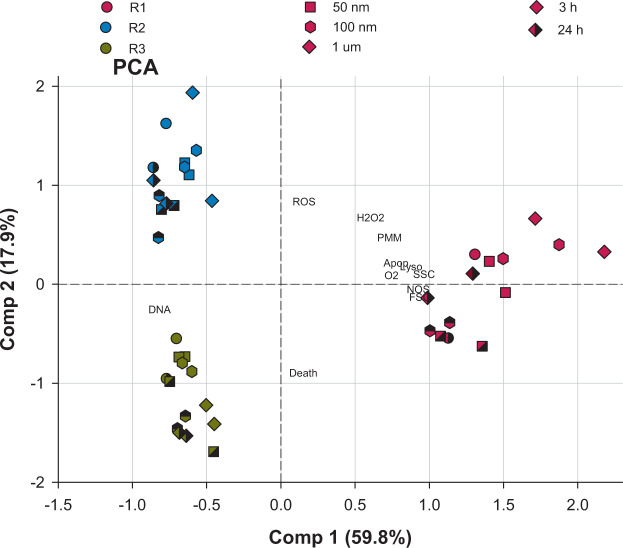
Plastic represents 60-80% of litter in the ocean. Degradation of plastic to small fragments leads to the formation of microplastics (MPs <5 mm) and nanoplastics (NPs <1 µm). One of the most widely used and representative plastics found in the ocean is polystyrene (PS). Among marine organisms, the immune system of bivalves is recognized as suitable to assess nanomaterial toxicity. Hemocyte subpopulations [R1 (large granular cells), R2 (small semi-granular cells) and R3 (small agranular or hyaline cells)] of Mytilus galloprovincialis are specialized in particular tasks and functions. The authors propose to examine the effects of different sizes (50 nm, 100 nm and 1 μm) PS NPs on the different immune cells of mussels when they were exposed to (1 and 10 mg·L-1) of PS NPs. The most noteworthy results found in this work are: (i) 1 µm PS NPs provoked higher immunological responses with respect to 50 and 100 nm PS NPs, possibly related to the higher stability in size and shape in hemolymph serum, (ii) the R1 subpopulation was the most affected with respect to R2 and R3 concerning immunological responses and (iii) an increase in the release of toxic radicals, apoptotic signals, tracking of lysosomes and a decrease in phagocytic activity was found in R1.


Conflict of interest statement

The authors declare no competing interests.

Figures

Figure 1
Figure 1
Agglomeration and SEM images of the PS NPs studied. Agglomeration was studied over time (0, 1, 3 and 24 h) in different aqueous suspensions; ultrapure water (panel A), artificial marine water (panel 2) and serum hemolymph, 1:1 serum of hemolymph:anti-aggregation solution (panel C) by Static Light Scattering (SLS), also SEM images of the nanoparticles in the different cultures media were taken after 24 h.
Figure 2
Figure 2
Toxicological responses (non-viable cells, apoptotic cells and depolarised mitochondrial membrane; panels A, B and C respectively) measured at 3 and 24 h when R1, R2 and R3 were exposed to 1 and 10 mg·L−1 of 50 nm, 100 nm and 1 µm PS NPs. Different uppercases represent significant differences (p < 0.05; Bomberroni’s post hoc test; n:3) among the treatments and concentrations tested. No significant differences between times by Repeated Measured GLM analysis are shown as a single graph (mean ± SD between both times). Amnis imaging flow cytometers are shown.
Figure 3
Figure 3
Toxicological responses (low DNA content and cell size; panels A and B respectively) measured at 3 and 24 h when R1, R2 and R3 were exposed to 1 and 10 mg·L−1 of 50 nm, 100 nm and 1 µm PS NPs. Different uppercases represent significant differences (p < 0.05; Bomberroni’s post hoc test; n:3) among the treatments and concentrations tested. Amnis imaging flow cytometers are shown.
Figure 4
Figure 4
Oxygen toxic radicals (ROS, H2O2 and O2.; panel A, B and C respectively) measured at 3 and 24 h when R1, R2 and R3 were exposed to 1 and 10 mg·L−1 of 50 nm, 100 nm and 1 µm PS NPs. Different uppercases represent significant differences (p < 0.05; Bomberroni’s post hoc test; n:3) among the treatments and concentrations tested. No significant differences between times by Repeated Measured GLM analysis are shown as a single graph (mean ± SD between both times). Amnis imaging flow cytometers are shown.
Figure 5
Figure 5
Nitric toxic radicals measured at 3 and 24 h when R1, R2 and R3 were exposed to 1 and 10 mg·L−1 of 50 nm, 100 nm and 1 µm of PS NPs. Different uppercases represent significant differences (p < 0.05; Bomberroni’s post hoc test; n:3) among the treatments and concentrations tested. No significant differences between times by Repeated Measured GLM analysis are shown as a single graph (mean ± SD between both times). Amnis imaging flow cytometers are shown.
Figure 6
Figure 6
Phagocytic capacity and percentage of Lysosomes (panel A and B respectively) measured at 3 and 24 h when R1, R2 and R3 were exposed to 1 and 10 mg·L−1 of 50 nm, 100 nm and 1 µm PS NPs. Different uppercases represent significant differences (p < 0.05; Bomberroni’s post hoc test; n:3) among the treatments and concentrations tested.
Figure 7
Figure 7
Principal components (1 and 2) of the toxicological and immune responses measured after 3 and 24 h in R1, R2 and R3 when the hemocytes were exposed to 1 and 10 mg·L−1 of 50 nm, 100 nm and 1 µm PS NPs.

References

    1. Thompson RC, Swan SH, Moore CJ, Vom Saal FS. Our plastic age. Philos. Trans. R. Soc. B Biol. Sci. 2009;364:1973–1976. - PMC - PubMed
    1. Alimi OS, Farner Budarz J, Hernandez LM, Tufenkji N. Microplastics and Nanoplastics in Aquatic Environments: Aggregation, Deposition, and Enhanced Contaminant Transport. Environ. Sci. Technol. 2018;52:1704–1724. - PubMed
    1. Goldstein, M. C., Titmus, A. J. & Ford, M. Scales of spatial heterogeneity of plastic marine debris in the northeast Pacific Ocean. Plos One8 (2013). - PMC - PubMed
    1. Cózar A, et al. Plastic debris in the open ocean. Proc. Natl. Acad. Sci. U.S.A. 2014;111:10239–44. - PMC - PubMed
    1. Eriksen M, et al. Microplastic pollution in the surface waters of the Laurentian Great Lakes. Mar. Pollut. Bull. 2013;77:177–182. - PubMed

Publication types