. 2020 Jul;26(7):1048-1053.
doi: 10.1038/s41591-020-0879-3. Epub 2020 May 25.

Common germline variants of the human APOE gene modulate melanoma progression and survival

Affiliations

Common germline variants of the human APOE gene modulate melanoma progression and survival

Benjamin N Ostendorf et al. Nat Med. 2020 Jul.

Abstract

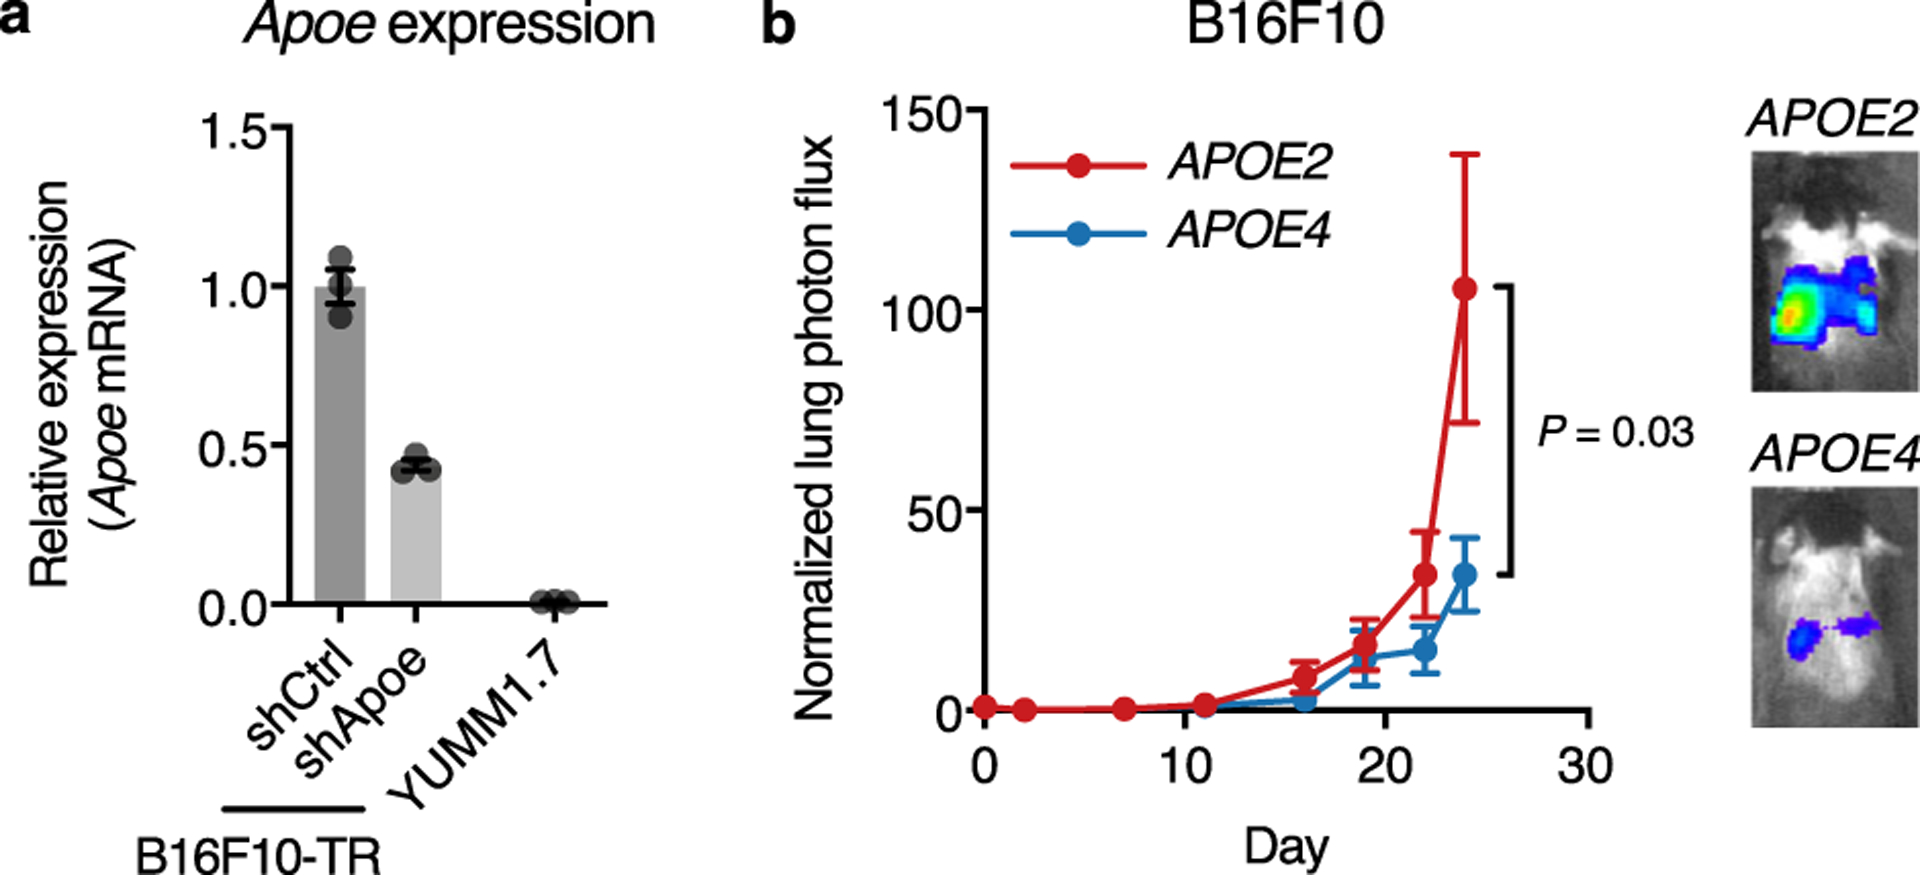
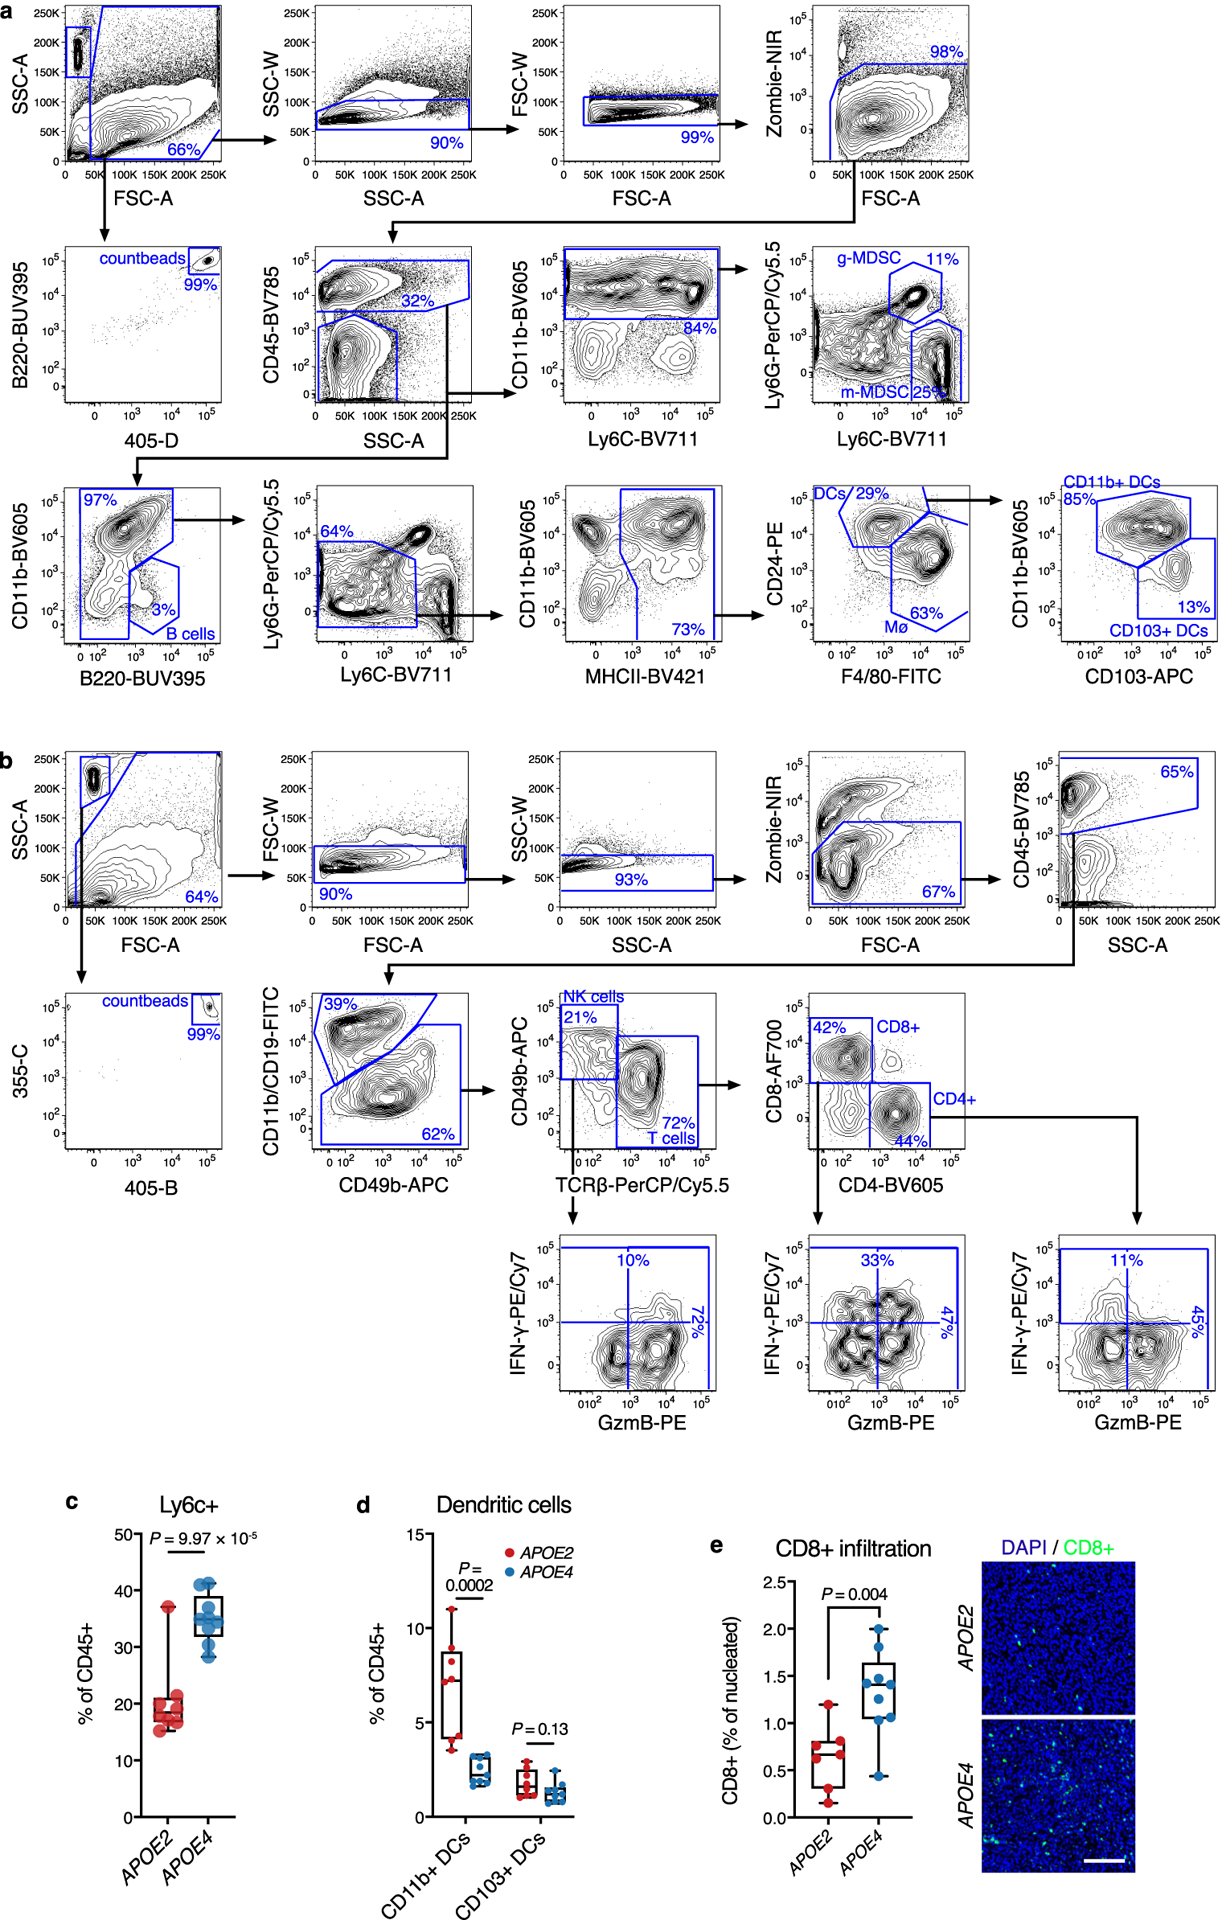
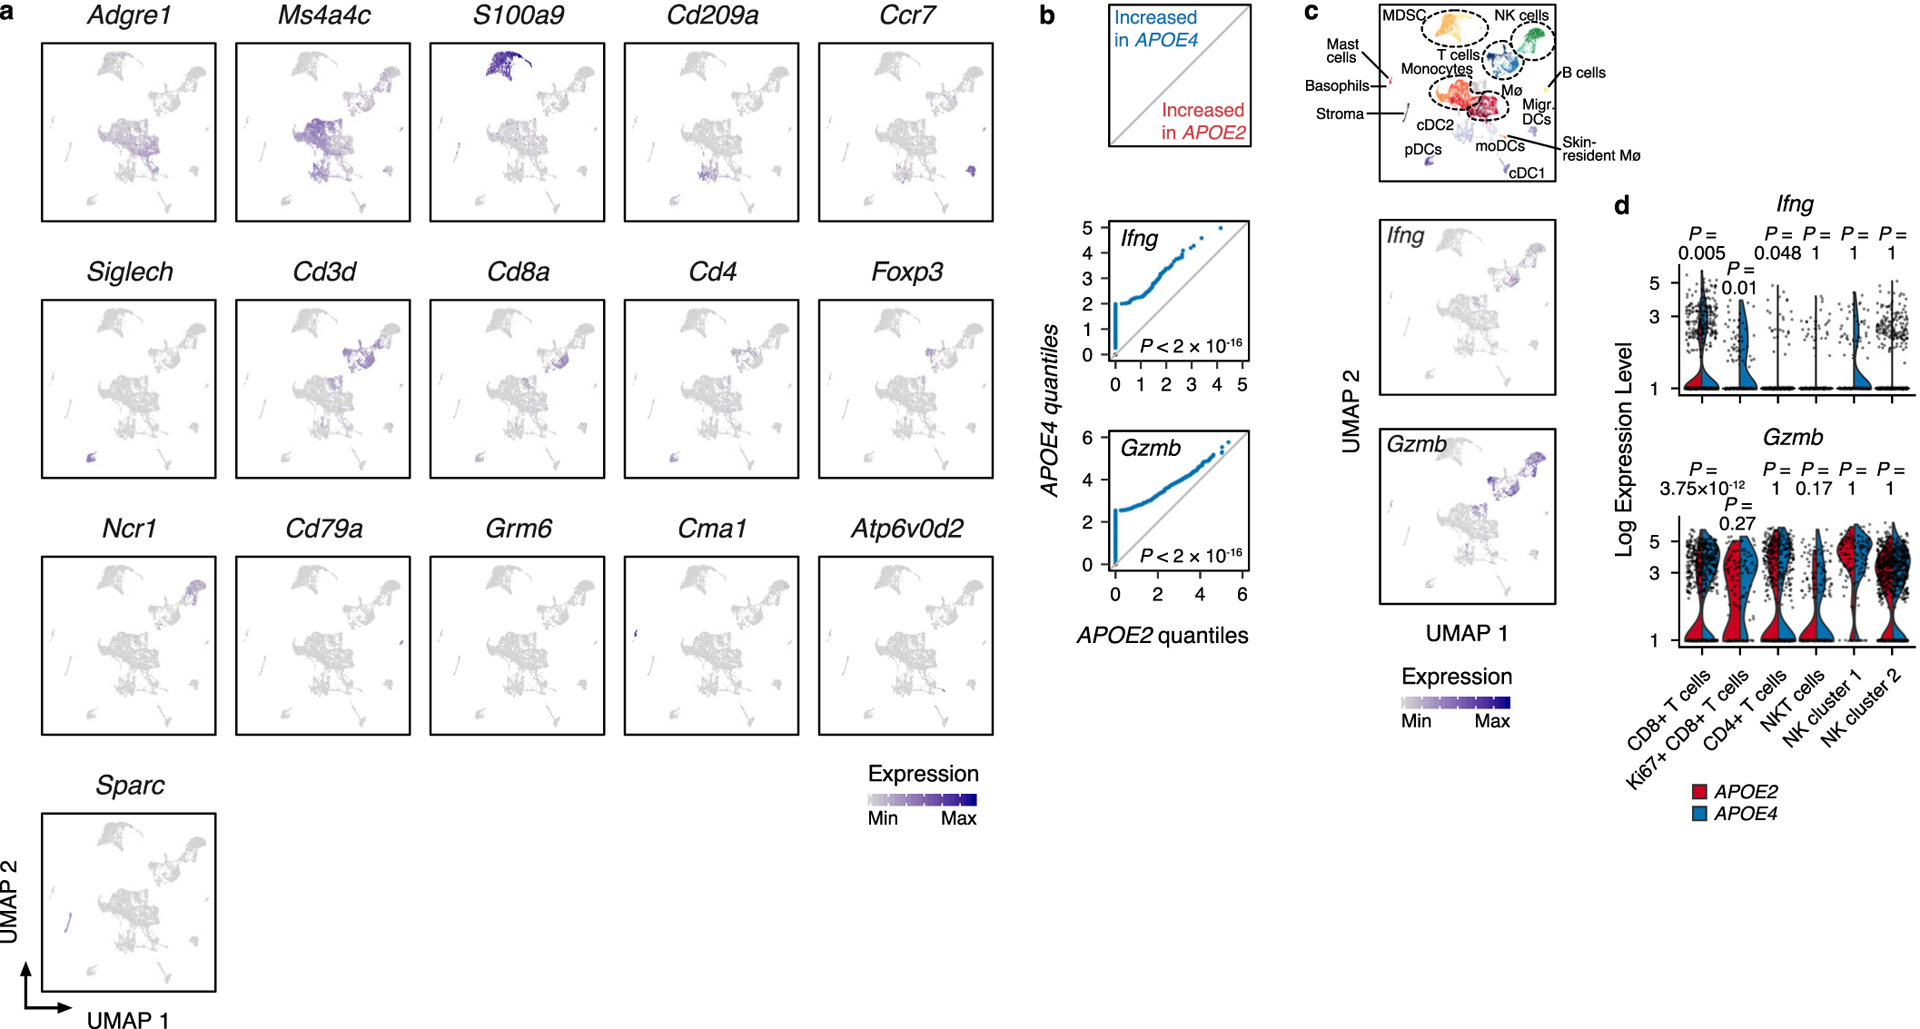
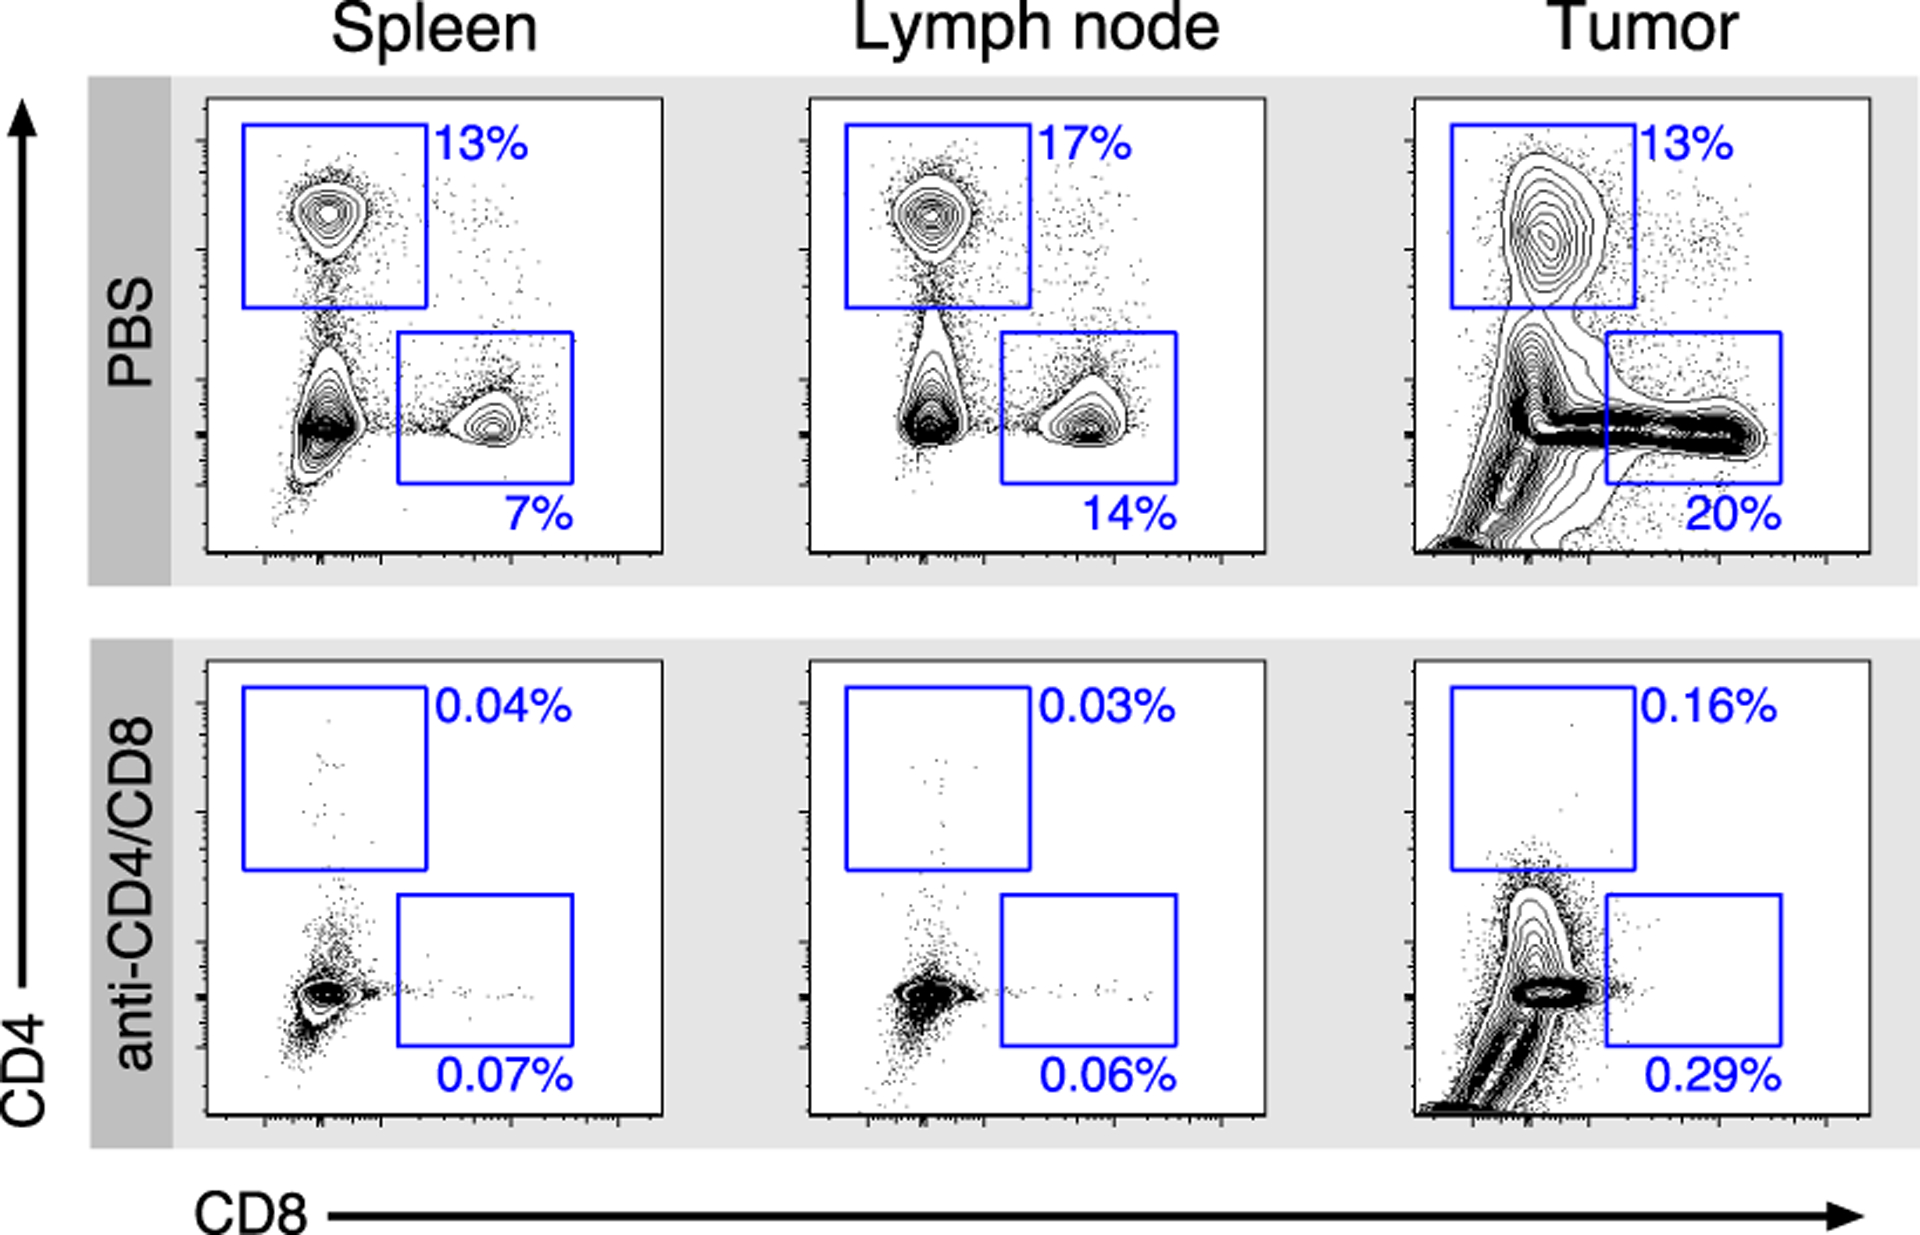
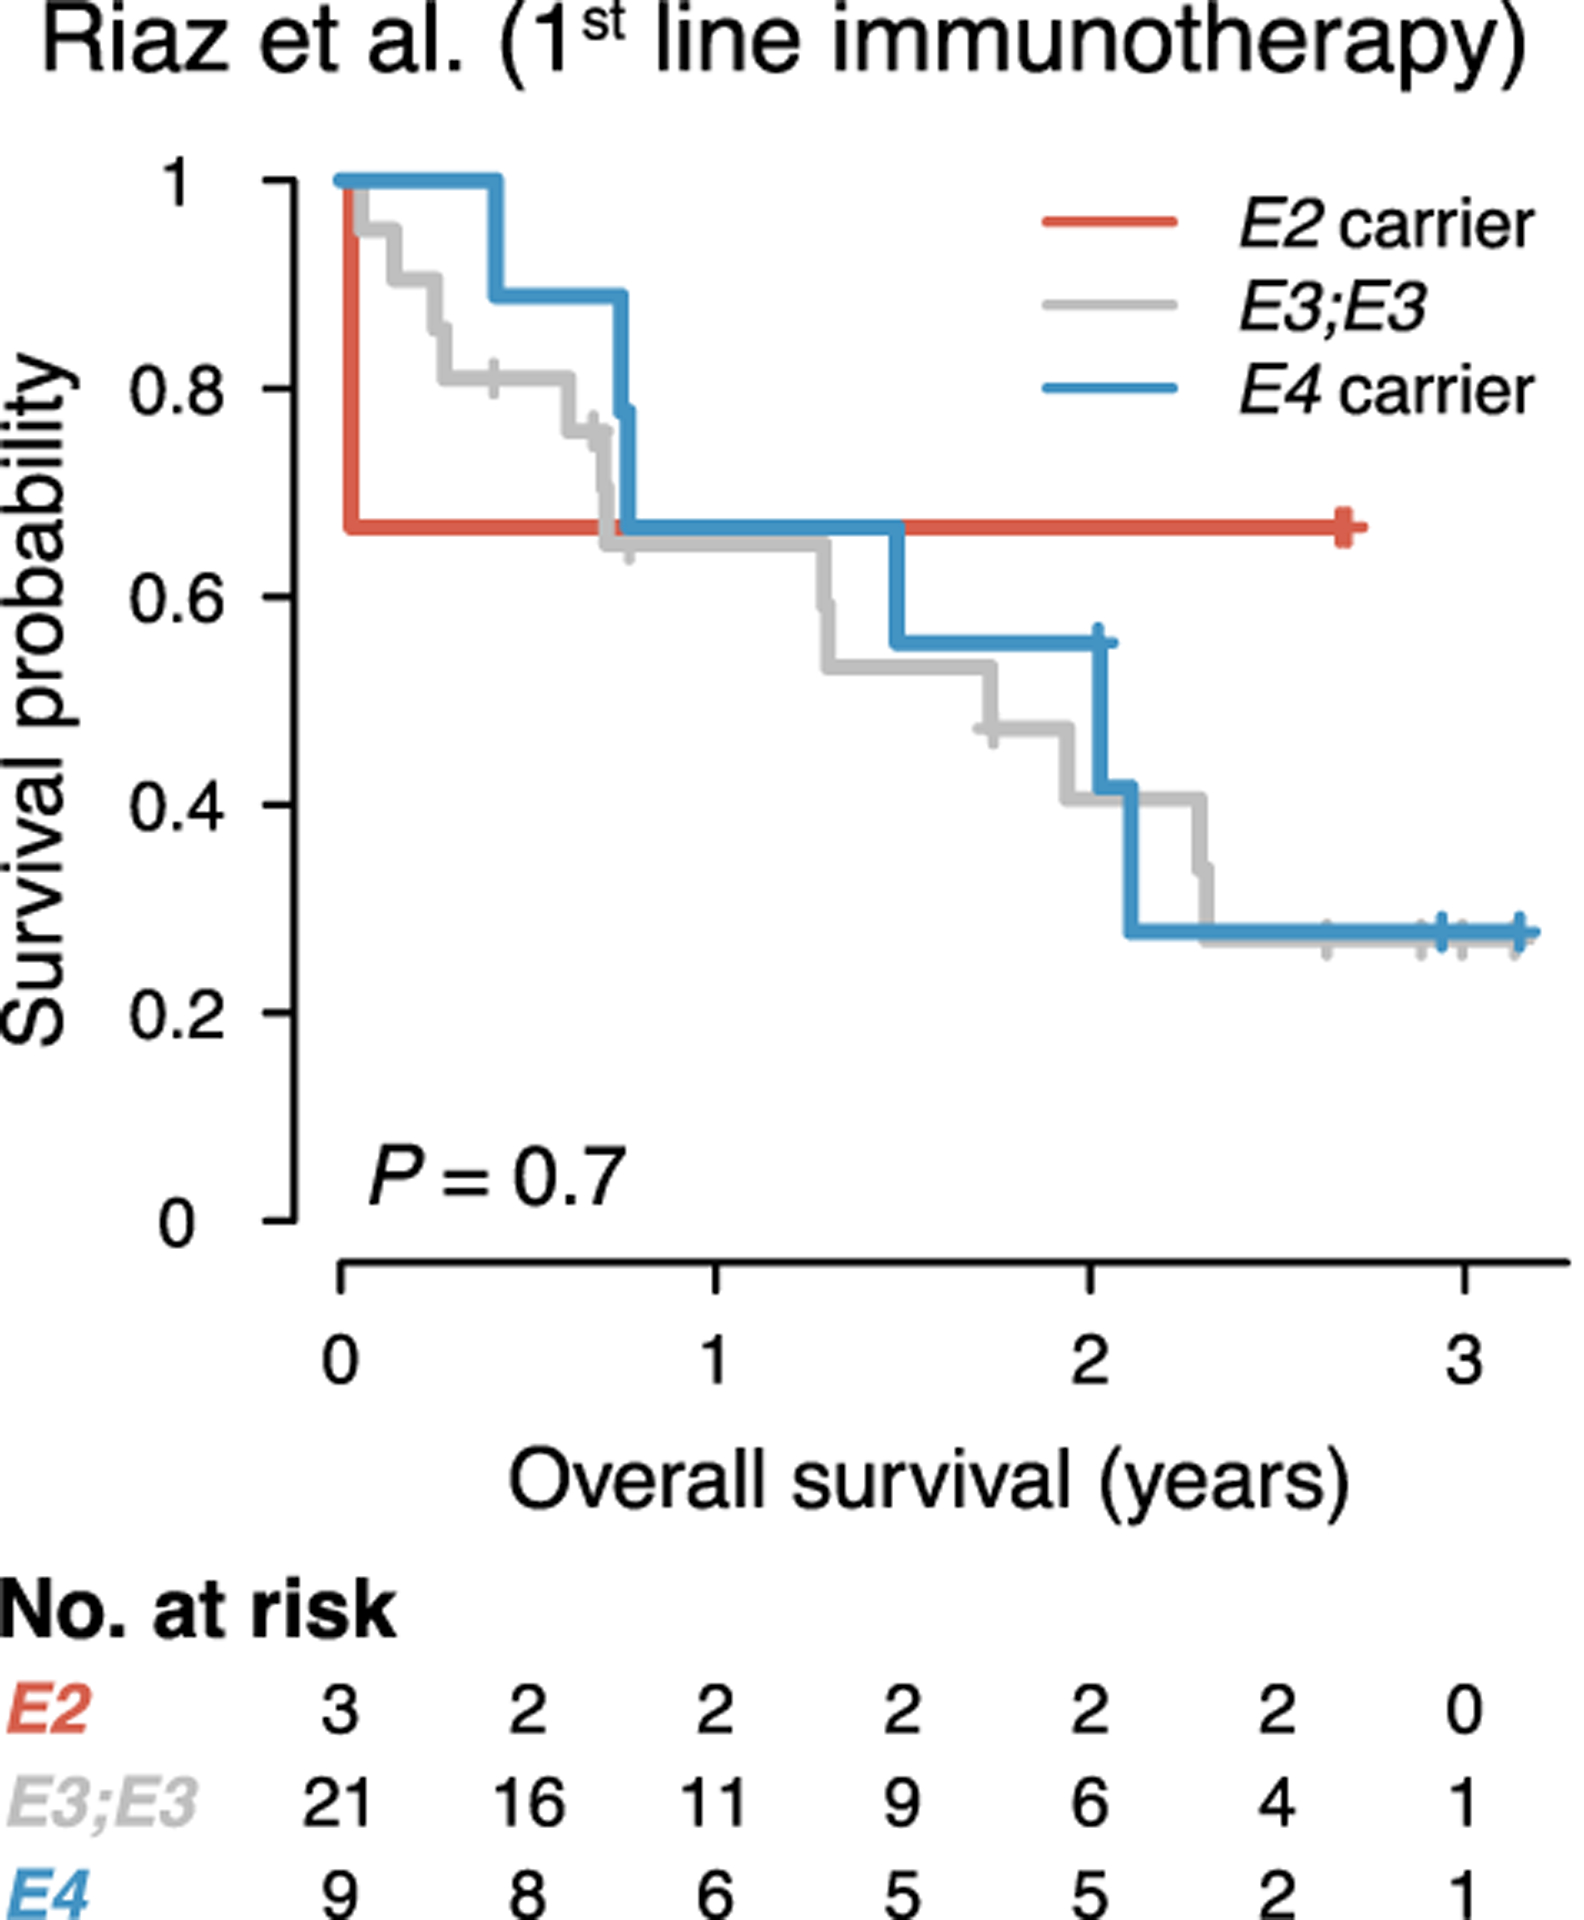
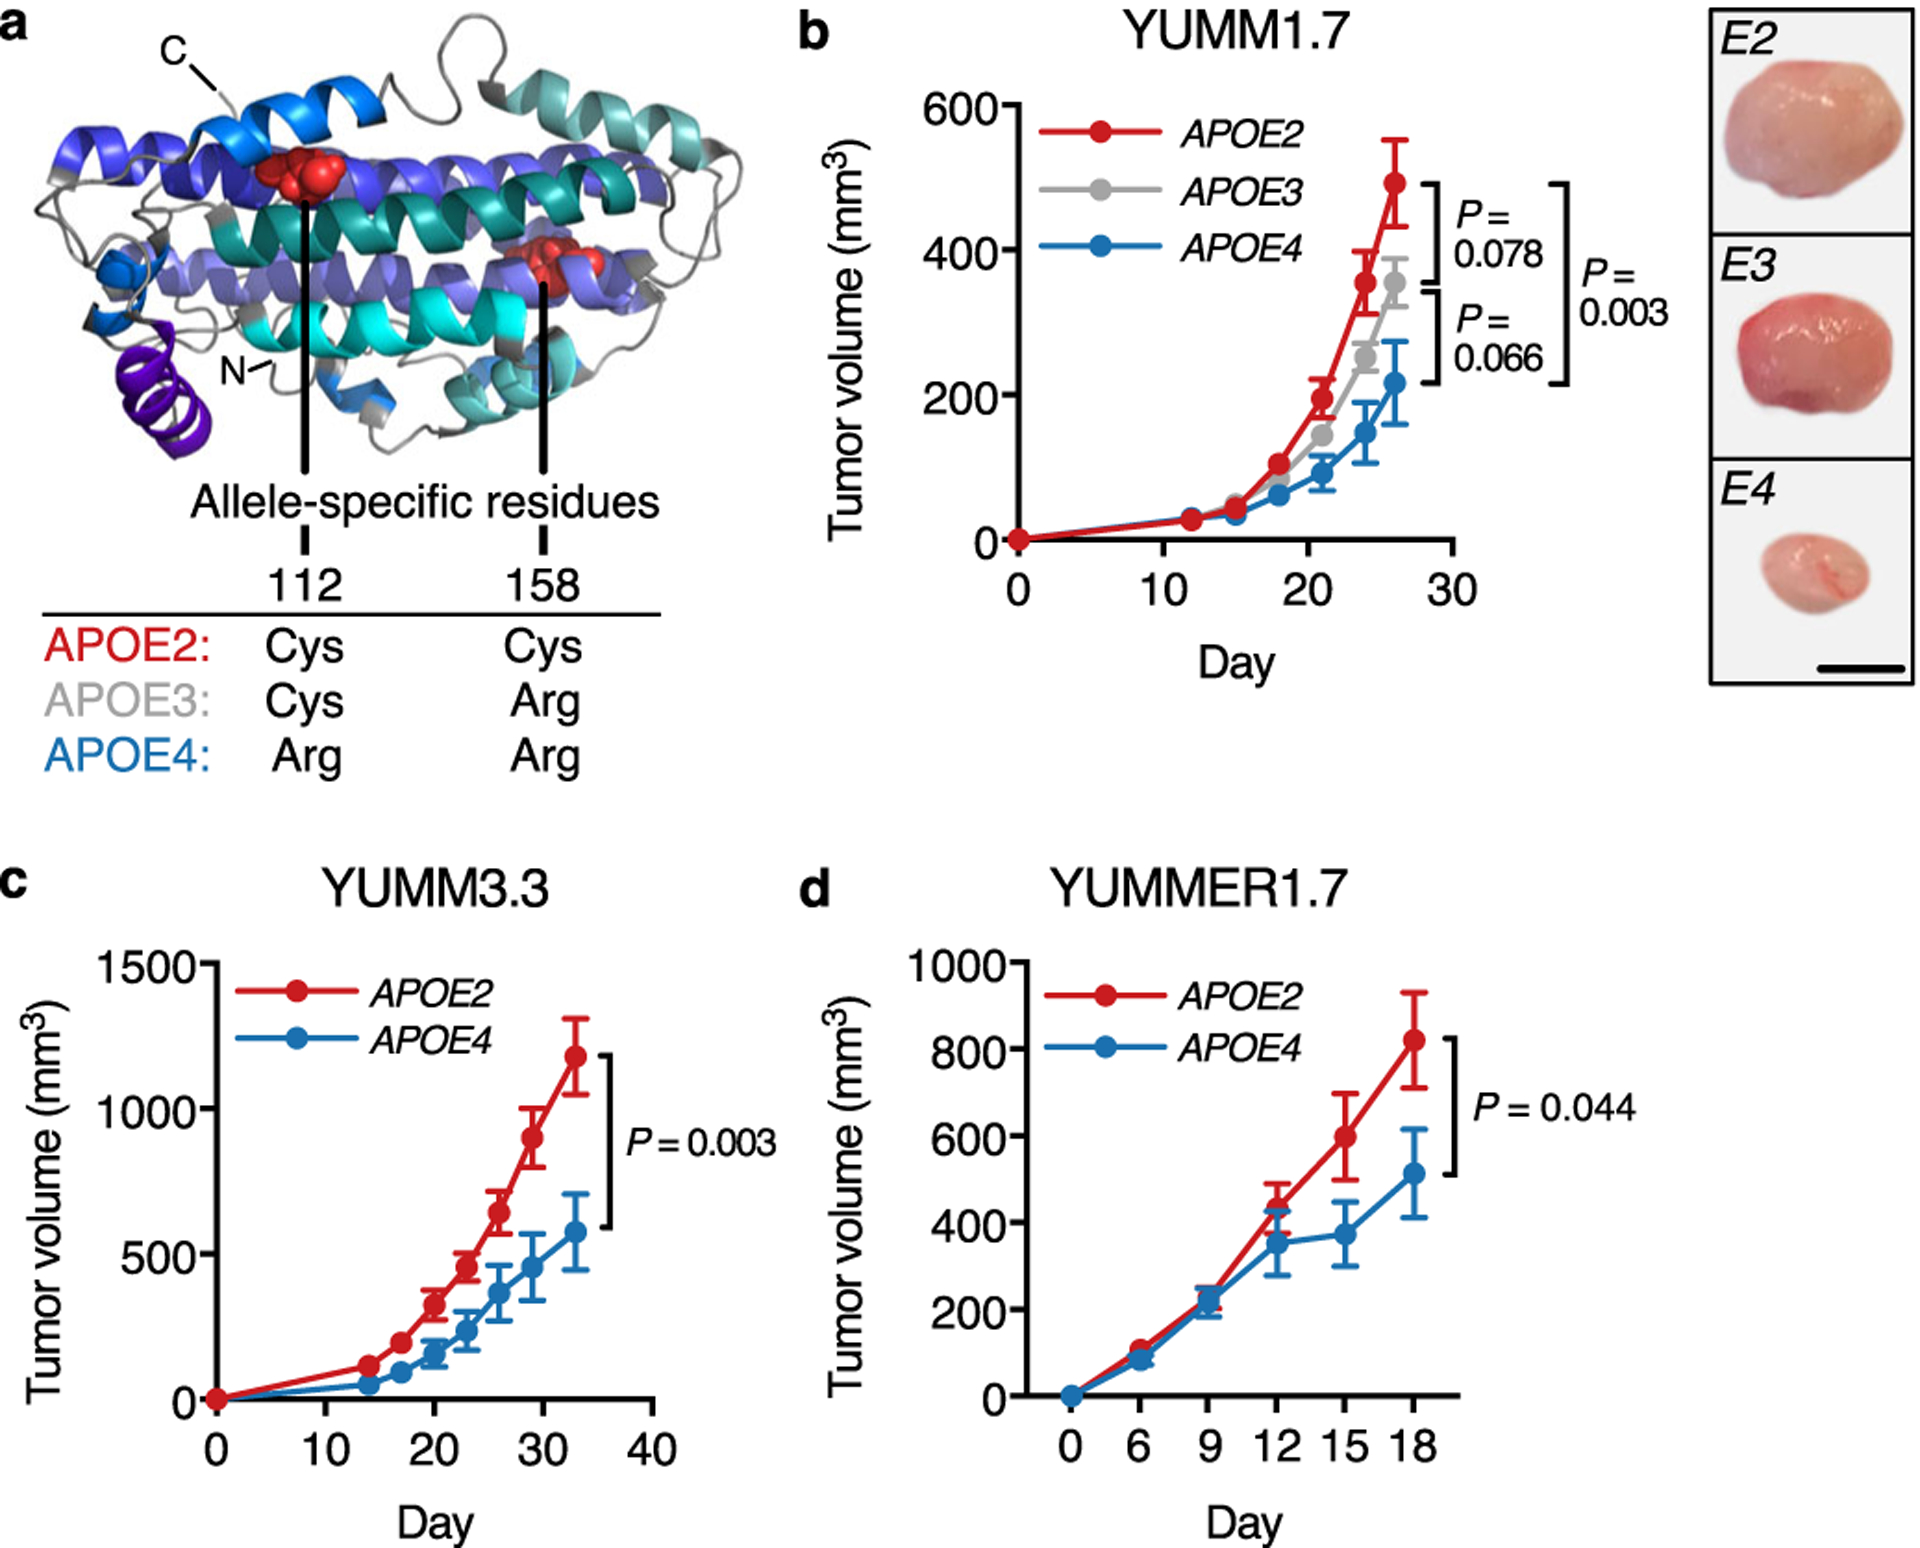
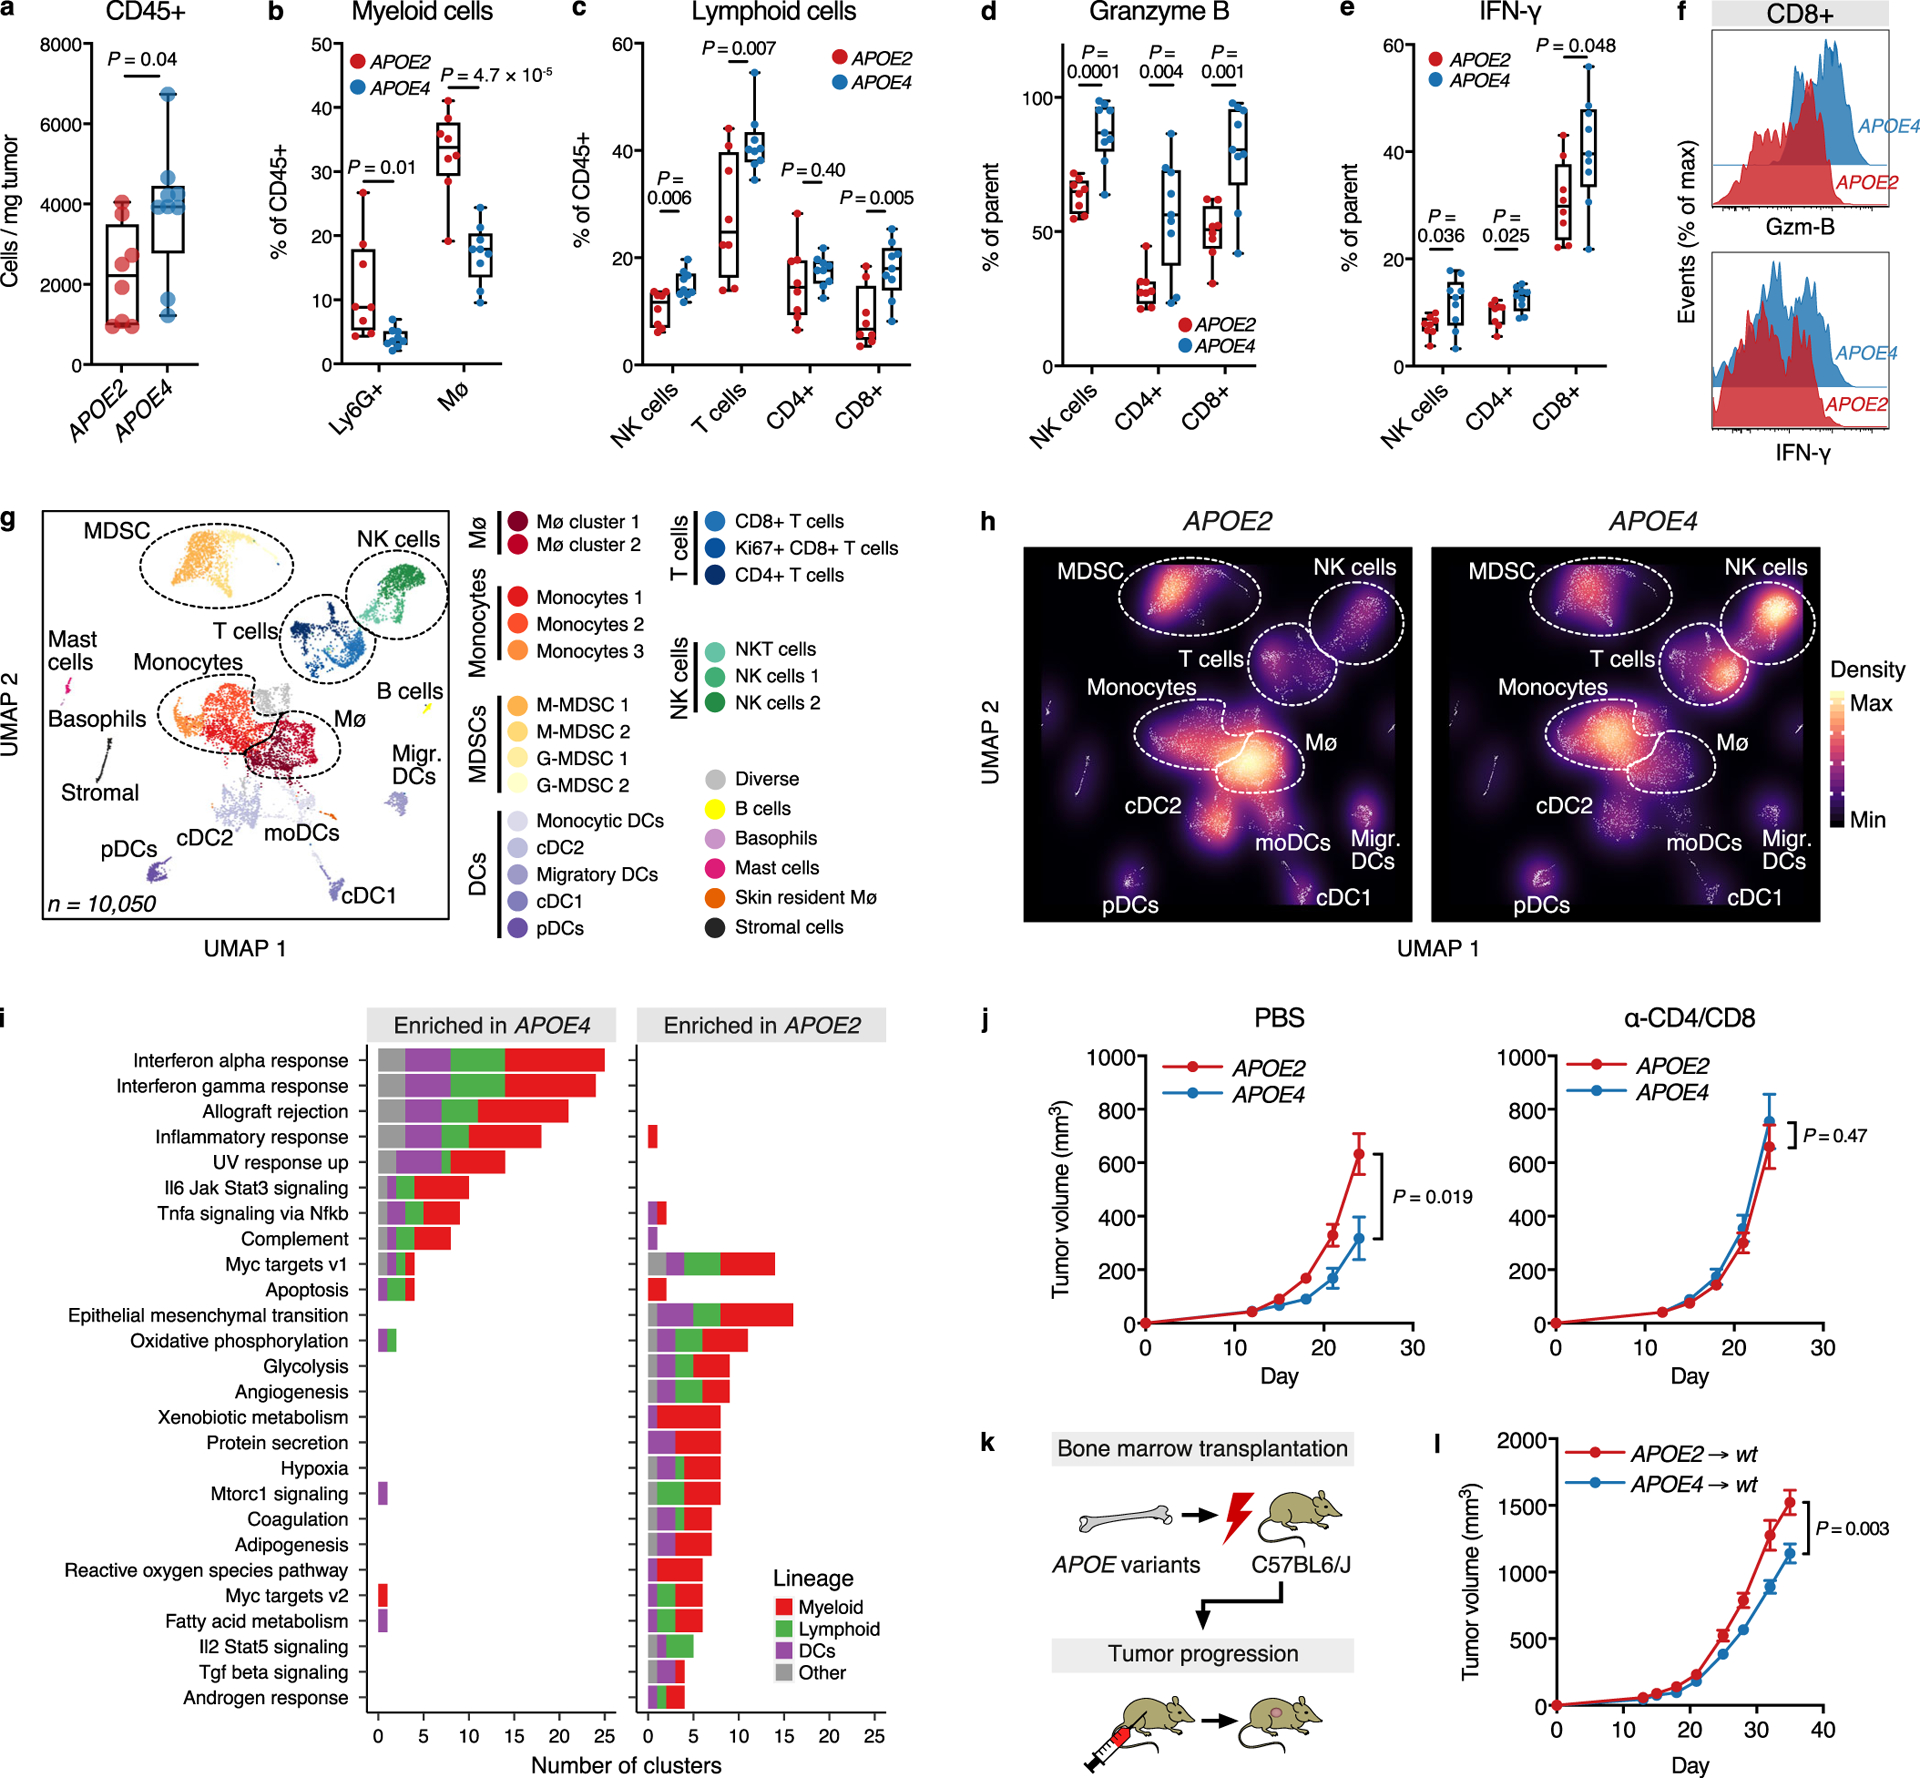
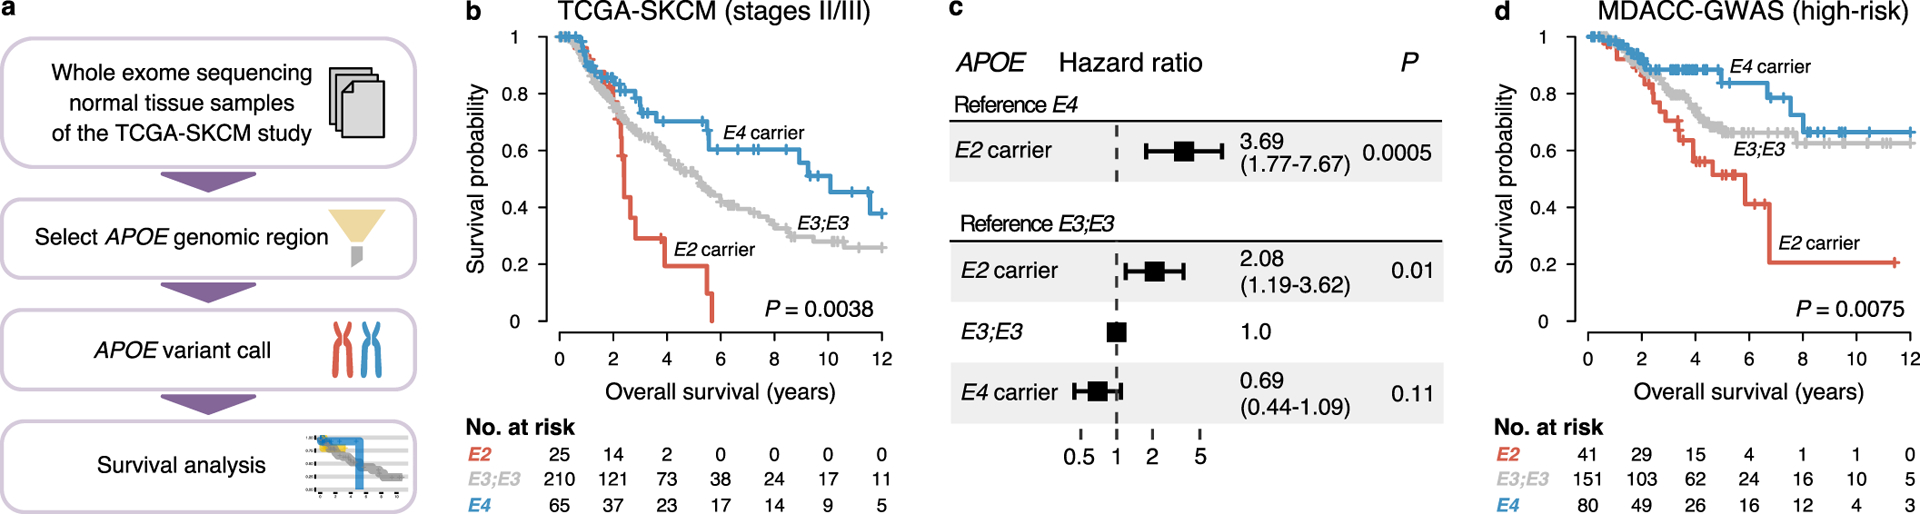
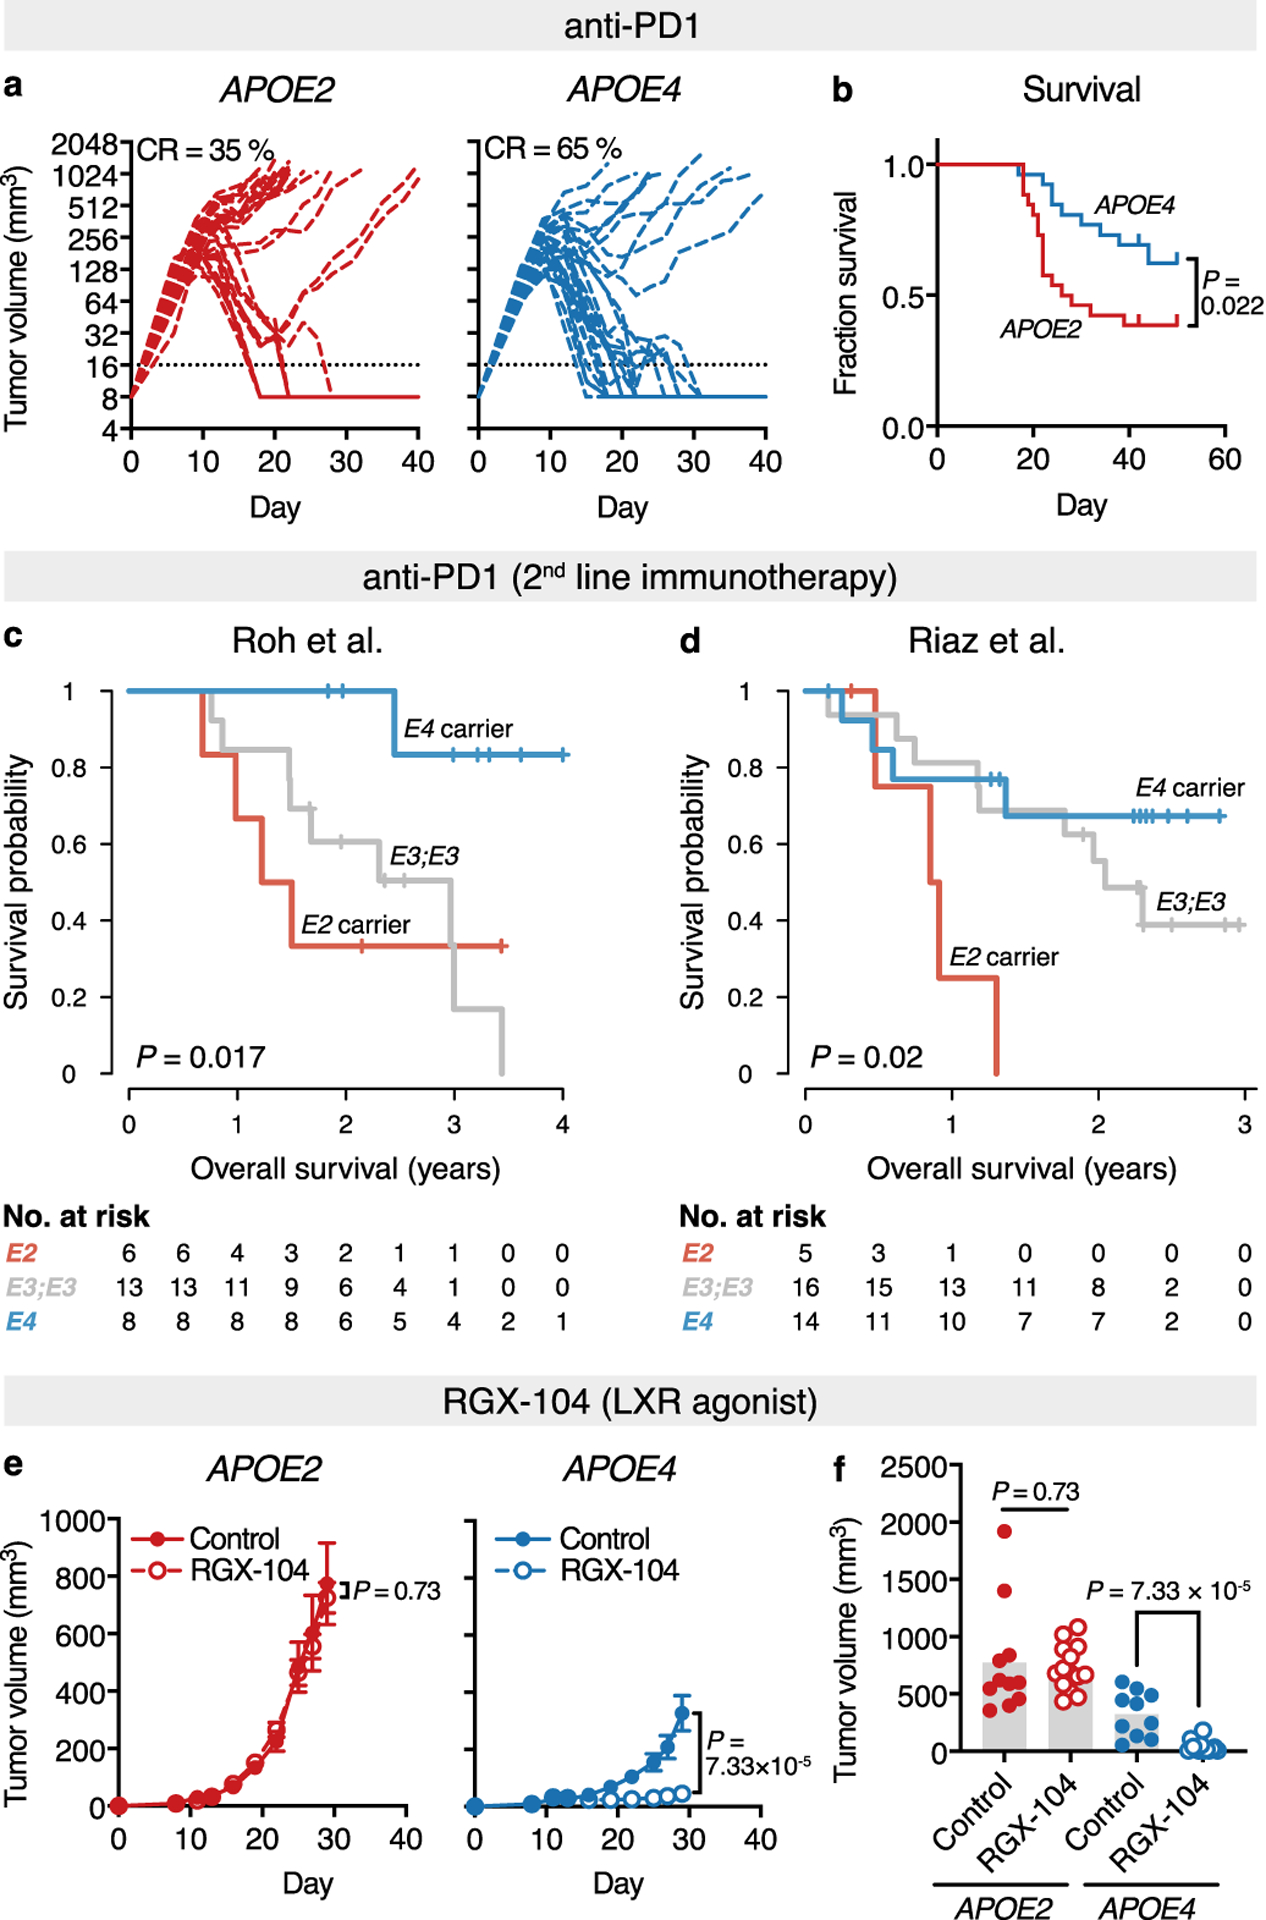
Common germline variants of the APOE gene are major risk modifiers of neurodegenerative and atherosclerotic diseases1-3, but their effect on cancer outcome is poorly defined. Here we report that, in a reversal of their effect on Alzheimer's disease, the APOE4 and APOE2 variants confer favorable and poor outcomes in melanoma, respectively. Mice expressing the human APOE4 allele exhibited reduced melanoma progression and metastasis relative to APOE2 mice. APOE4 mice exhibited enhanced anti-tumor immune activation relative to APOE2 mice, and T cell depletion experiments showed that the effect of APOE genotype on melanoma progression was mediated by altered anti-tumor immunity. Consistently, patients with melanoma carrying the APOE4 variant experienced improved survival in comparison to carriers of APOE2. Notably, APOE4 mice also showed improved outcomes under PD1 immune checkpoint blockade relative to APOE2 mice, and patients carrying APOE4 experienced improved anti-PD1 immunotherapy survival after progression on frontline regimens. Finally, enhancing APOE expression via pharmacologic activation of liver X receptors, previously shown to boost anti-tumor immunity4, exhibited therapeutic efficacy in APOE4 mice but not in APOE2 mice. These findings demonstrate that pre-existing hereditary genetics can impact progression and survival outcomes of a future malignancy and warrant prospective investigation of APOE genotype as a biomarker for melanoma outcome and therapeutic response.


Conflict of interest statement

Competing interests

S.F.T and B.N.O. are inventors on a US provisional patent application encompassing aspects of this work. S.F.T. is a co-founder, shareholder, and member of the scientific advisory board of Rgenix.

Figures

Extended Data Fig. 1
Extended Data Fig. 1. Human APOE variants modulate metastatic progression of murine melanoma.
a, Relative expression of murine Apoe determined by qRT-PCR in B16F10 cells expressing shCtrl and shApoe hairpins and in YUMM1.7 cells (n = 3 cell culture replicates per group, graph represents mean values ± s.e.m.). b, Bioluminescence imaging of metastatic progression of murine melanoma B16F10-TR-shApoe cells intravenously injected into APOE knock-in mice (n = 10 mice per group; one-tailed Mann-Whitney test; graph represents mean values ± s.e.m.; representative of two independent experiments). Images correspond to representative mice on day 24 after injection.
Extended Data Fig. 2
Extended Data Fig. 2. Immunoprofiling of the tumor microenvironment in APOE2 versus APOE4 mice.
a-b, Representative flow cytometry plots from two independent experiments demonstrating the gating strategy to identify major myeloid (a) and lymphoid (b) cell subsets in the tumor microenvironment. c-d, Proportion of monocytic Ly6C+ (c) and dendritic cell (d) subsets in the immune microenvironment of YUMM1.7 tumors in APOE2 and APOE4 mice (n = 8 and 9 mice for APOE2 and APOE4, respectively; representative of two independent experiments). e, Intratumoral CD8+ T cell infiltration in YUMM1.7 tumors from APOE2 and APOE4 mice (n = 7 and 9 mice for APOE2 and APOE4 groups, respectively). Images show representative sections (scale bar = 100 μm). All P values are based on two-tailed t-tests. Box plots show median, first and third quartiles, and whiskers represent minimum and maximum values.
Extended Data Fig. 3
Extended Data Fig. 3. Extended single cell RNA-sequencing data.
a, Uniform manifold approximation and projection (UMAP) plots illustrating the distribution of the expression of manually curated, lineage-defining genes. b, Paired quantile-quantile plots for the expression of Ifng and Gzmb in CD45+ cells infiltrating tumors in APOE2 and APOE4 mice (P values according to two-sided Wilcoxon rank-sum test). c, Uniform manifold approximation and projection (UMAP) plots illustrating the distribution of Ifng and Gzmb expression across immune cell clusters. d, Violin plots showing the distribution of Ifng and Gzmb expression across T and NK cell subsets from (b-c) (P values according to two-sided Wilcoxon rank-sum test adjusted for total number of clusters by FDR; plots extend from minimum to maximum values). A total of 10,050 cells were sequenced (n = 4,665 and 5,385 cells for APOE2 and APOE4 groups, respectively). Cells were harvested from n = 6 biologically averaged mice for each group. For single-cell RNA-sequencing, a total of 10,050 cells were sequenced (n = 4,665 and 5,385 cells for APOE2 and APOE4 groups, respectively).
Extended Data Fig. 4
Extended Data Fig. 4. Efficiency of in-vivo T cell depletion.
Representative flow cytometry plots of two independent experiments of samples from spleens, lymph nodes, and tumors of mice treated with PBS versus anti-CD4 and anti-CD8 antibodies.
Extended Data Fig. 5
Extended Data Fig. 5. APOE variants differentially impact cancer cell invasion and endothelial recruitment.
a, Matrigel invasion by 1 × 10⁵ mouse melanoma B16F10-TR-shApoe cells treated with the indicated recombinant proteins (n = 4 biologically independent samples; one tailed t-test). b, Trans-well recruitment of 1 × 10⁵ human umbilical vein endothelial cells treated with the indicated recombinant proteins by 5 × 10⁴ human melanoma MeWo-LM2 cells (n = 4 biologically independent samples; one tailed t-tests). Data in (a-b) are representative of three independent experiments. c, Blood vessel density in YUMM1.7 tumors from APOE2 and APOE4 mice (n = 8 and 9 mice for APOE2 and APOE4 groups, respectively; two-tailed Mann-Whitney test; box plots show median, first and third quartiles, and whiskers represent minimum and maximum values.). Images show representative sections (scale bar = 100 μm).
Extended Data Fig. 6
Extended Data Fig. 6. Distribution of APOE genotype in the TCGA-SKCM study.
a-b, Proportion of APOE2 and APOE4 carrier status (a) and bi-allelic genotype (b) in the Atherosclerosis Risk in Communities study (ARIC) and in patients with stage II/III melanoma in the TCGA-SKCM study (P = 0.0017 and 0.0066, respectively; χ2 test).
Extended Data Fig. 7
Extended Data Fig. 7. Clinical characteristics of stage II/III patients in the TCGA-SKCM study.
a, Sex proportions were not significantly different between APOE carrier groups (P = 0.46, χ2 test). b, Age at diagnosis was not significantly different between APOE carrier groups (P = 0.45, Kruskal-Wallis rank sum test). c, Tumor stage at diagnosis was not significantly different between APOE carrier groups (P = 0.4, χ2 test). d, Melanoma Clark level at diagnosis was not significantly different between APOE carrier groups (P = 0.95, χ2 test). e, Breslow depth was not significantly different between APOE carrier groups at diagnosis (P = 0.24, Kruskal-Wallis rank sum test). f, APOE carrier status was not significantly associated with common tumor mutations (P = 0.93, χ2 test). g, APOE carrier status was not significantly associated with transcriptomic cluster (P = 0.55, χ2 test). h, Univariate analysis of the impact of clinical and molecular characteristics on survival of stage II/III melanoma patients (P values according to univariate Cox proportional hazards model). i, Multivariable analysis of the impact of clinical and molecular characteristics with significant impact in univariate analysis on survival of stage II/III melanoma patients (P values according to multivariable Cox proportional hazards model). For (h-i), the number of patients with available information for a given characteristic is indicated in column “n”, and plots represent hazard ratios with 95% confidence intervals. Hinges of boxplots represent the first and third quartiles, whiskers extend to the smallest and largest value within 1.5 × interquartile ranges of the hinges, and points represent outliers.
Extended Data Fig. 8
Extended Data Fig. 8. APOE genotype in normal tissue versus tumor samples of stage II/III patients in the TCGA-SKCM study.
a, Proportion of APOE2 and APOE4 carrier status in normal tissue and tumor samples of patients with stage II/III melanoma in the TCGA-SKCM study (P = 0.8899; χ2 test). b, Chord diagram of APOE carrier status as identified in paired normal and tumor tissue samples of stage II/III melanoma patients in the TCGA-SKCM study.
Extended Data Fig. 9
Extended Data Fig. 9. Characteristics of the MDACC GWAS study and comparison to TCGA-SKCM.
a-b, Distribution of APOE carrier status in the Atherosclerosis Risk in Communities study (ARIC) and the MDACC melanoma study before (a) and after (b) imputation of APOE genotype (P < 2.2 × 10⁻¹⁶ and P = 1.82 × 10⁻¹¹, respectively; χ2 test). c-g, Survival of melanoma patients in the MDACC study stratified by local melanoma stage and APOE genotype (two-sided log-rank tests). h, Survival of stage II/III melanoma patients in the MDACC and TCGA-SKCM studies (two-sided log-rank test). i-k, Distribution of age (i), melanoma Clark level (j), and sex (k) in stage II/III patients of the MDACC and TCGA-SKCM melanoma studies (respective significance tests: P = 6.42 × 10⁻⁹, Kruskal-Wallis rank sum test; P = 0.0005, χ2 test; P = 0.052, χ2 test). Hinges of boxplots represent the first and third quartiles, whiskers extend to the smallest and largest value within 1.5 × interquartile ranges of the hinges, and points represent outliers.
Extended Data Fig. 10
Extended Data Fig. 10. Association of APOE genotype with outcome in upfront anti-PD1 immunotherapy-treated melanoma patients.
Survival of melanoma patients treated with anti-PD1 therapy with no prior checkpoint therapy from the Riaz et al. study (P value according to two-sided log-rank test).
Fig. 1 |
Fig. 1 |. Human APOE variants modulate progression of murine melanoma.
a, Structural representation of APOE3 (based on structure by Chen and colleagues). b, Growth of murine YUMM1.7 tumors in APOE knock-in mice (n = 11 mice per group, representative of two independent experiments). Representative tumors correspond to day 26 (scale bar, 3 mm). c, Growth of murine YUMM3.3 melanomas in human APOE knock-in mice (n = 13 mice per group, representative of two independent experiments). d, Growth of murine YUMMER1.7 melanomas in APOE knock-in mice (n = 13 and 11 mice for APOE2 and APOE4, respectively; representative of two independent experiments). Graphs represent mean values ± s.e.m. All P values are based on two-tailed t-tests.
Fig. 2 |
Fig. 2 |. Human APOE variants modulate the tumor immune microenvironment.
a, Abundance of CD45+ leukocytes in YUMM1.7 tumors in APOE2 and APOE4 knock-in mice (two-tailed t-test). b-c, Proportion of tumor-infiltrating myeloid (b) and lymphoid (c) immune subsets in YUMM1.7 melanoma-bearing APOE2 and APOE4 mice (two-tailed t-tests). d-e, Expression of Granzyme B (Gzm-B) (d) and Interferon-γ (IFN-γ) (e) in immune effector cells infiltrating YUMM1.7 melanomas in APOE2 versus APOE4 mice (one-tailed t-tests). f, Representative flow cytometry plots from (d-e) illustrating the expression of activation markers in YUMM1.7-infiltrating CD8+ T cells in APOE2 and APOE4 mice. g, Uniform manifold approximation and projection (UMAP) plot of 10,050 CD45+ RNA-sequenced tumor-infiltrating immune cells from APOE2 and APOE4 hosts. h, Density plot of (g) stratified by APOE genotype. i, Number of immune cell clusters as identified by scRNA-seq with pathway enrichment in genes differentially expressed between APOE4 and APOE2 (pathways listed with significance in > 3 clusters; significance based on two-sided permutation testing and adjusted for number of tested pathways by FDR). j, Impact of T cell depletion on YUMM1.7 tumor growth in human APOE knock-in mice (n = 24, 11, 11, and 10 mice for APOE2/PBS, APOE4/PBS, APOE2/depletion and APOE4/depletion groups, respectively; two-tailed t-tests; representative of two independent experiments). k, Experimental approach to determine the impact of hematopoietic cell-derived APOE variants on melanoma progression. l, Growth of YUMM1.7 tumors in C57BL/6J wild-type mice transplanted with bone marrow from human APOE knock-in mice (n = 15 per group, two-tailed t-test). Box plots in (a-e) show median, and whiskers represent minimum and maximum). For (a-f), n = 8 and 9 mice for APOE2 and APOE4 groups, respectively, and data are representative of two independent experiments. Graphs in (j) and (l) represent mean values ± s.e.m. For (g-i), n = 6 biologically averaged mice per group.
Fig. 3 |
Fig. 3 |. APOE germline variants predict survival in human melanoma.
a, Computational pipeline to analyze the impact of APOE genotype on melanoma outcome in the TCGA-SKCM study. b-c, Survival (b) and hazard ratios (c) of stage II/III melanoma patients in the TCGA-SKCM study stratified by APOE carrier status (P values according to two-sided log-rank test (b) and two-sided Cox proportional hazards model (c); numbers in parentheses indicate 95% confidence interval). d, Survival of high-risk melanoma patients in the MDACC GWAS study as defined by advanced local melanoma and older age (P value according to two-sided log-rank test).
Fig. 4 |
Fig. 4 |. APOE genotype modulates melanoma progression in the context of immunotherapy.
a-b, Tumor growth (a) and survival (b) of human APOE knock-in mice injected with YUMMER1.7 tumors and treated with anti-PD1 antibody (n = 26 per group; P = 0.022, two-tailed log-rank test; data pooled from two independent experiments; CR = complete remission). c-d, Survival of melanoma patients treated with anti-PD1 immunotherapy after failing anti-CTLA4 treatment in the Roh et al. (c) and Riaz et al. (d) studies stratified by APOE carrier status (P values according to two-sided log-rank tests). e, Effect of LXR-agonistic treatment on growth of YUMM1.7 tumors in human APOE knock-in mice (n = 11, 14, 10, and 13 for APOE2/ctrl, APOE2/RGX-104, APOE4/ctrl, and APOE4/RGX-104 groups, respectively; graphs represent mean values ± s.e.m., two-tailed t-test; representative of two independent experiments). f, Individual tumor volume on day 29 post injection from (e).

Comment in

References

    1. Strittmatter WJ et al. Apolipoprotein E: high-avidity binding to beta-amyloid and increased frequency of type 4 allele in late-onset familial Alzheimer disease. Proc Natl Acad Sci U S A 90, 1977–81 (1993). - PMC - PubMed
    1. Corder EH et al. Protective effect of apolipoprotein E type 2 allele for late onset Alzheimer disease. Nat Genet 7, 180–4 (1994). - PubMed
    1. Mahley RW Apolipoprotein E: from cardiovascular disease to neurodegenerative disorders. J Mol Med (Berl) 94, 739–46 (2016). - PMC - PubMed
    1. Tavazoie MF et al. LXR/ApoE Activation Restricts Innate Immune Suppression in Cancer. Cell 172, 825–840.e18 (2018). - PMC - PubMed
    1. Shi Y & Holtzman DM Interplay between innate immunity and Alzheimer disease: APOE and TREM2 in the spotlight. Nat Rev Immunol 18, 759–772 (2018). - PMC - PubMed

Publication types

MeSH terms