. 2020 Jul;26(7):1125-1134.
doi: 10.1038/s41591-020-0892-6. Epub 2020 May 25.

Systemic dysfunction and plasticity of the immune macroenvironment in cancer models

Affiliations

Systemic dysfunction and plasticity of the immune macroenvironment in cancer models

Breanna M Allen et al. Nat Med. 2020 Jul.

Erratum in

Abstract

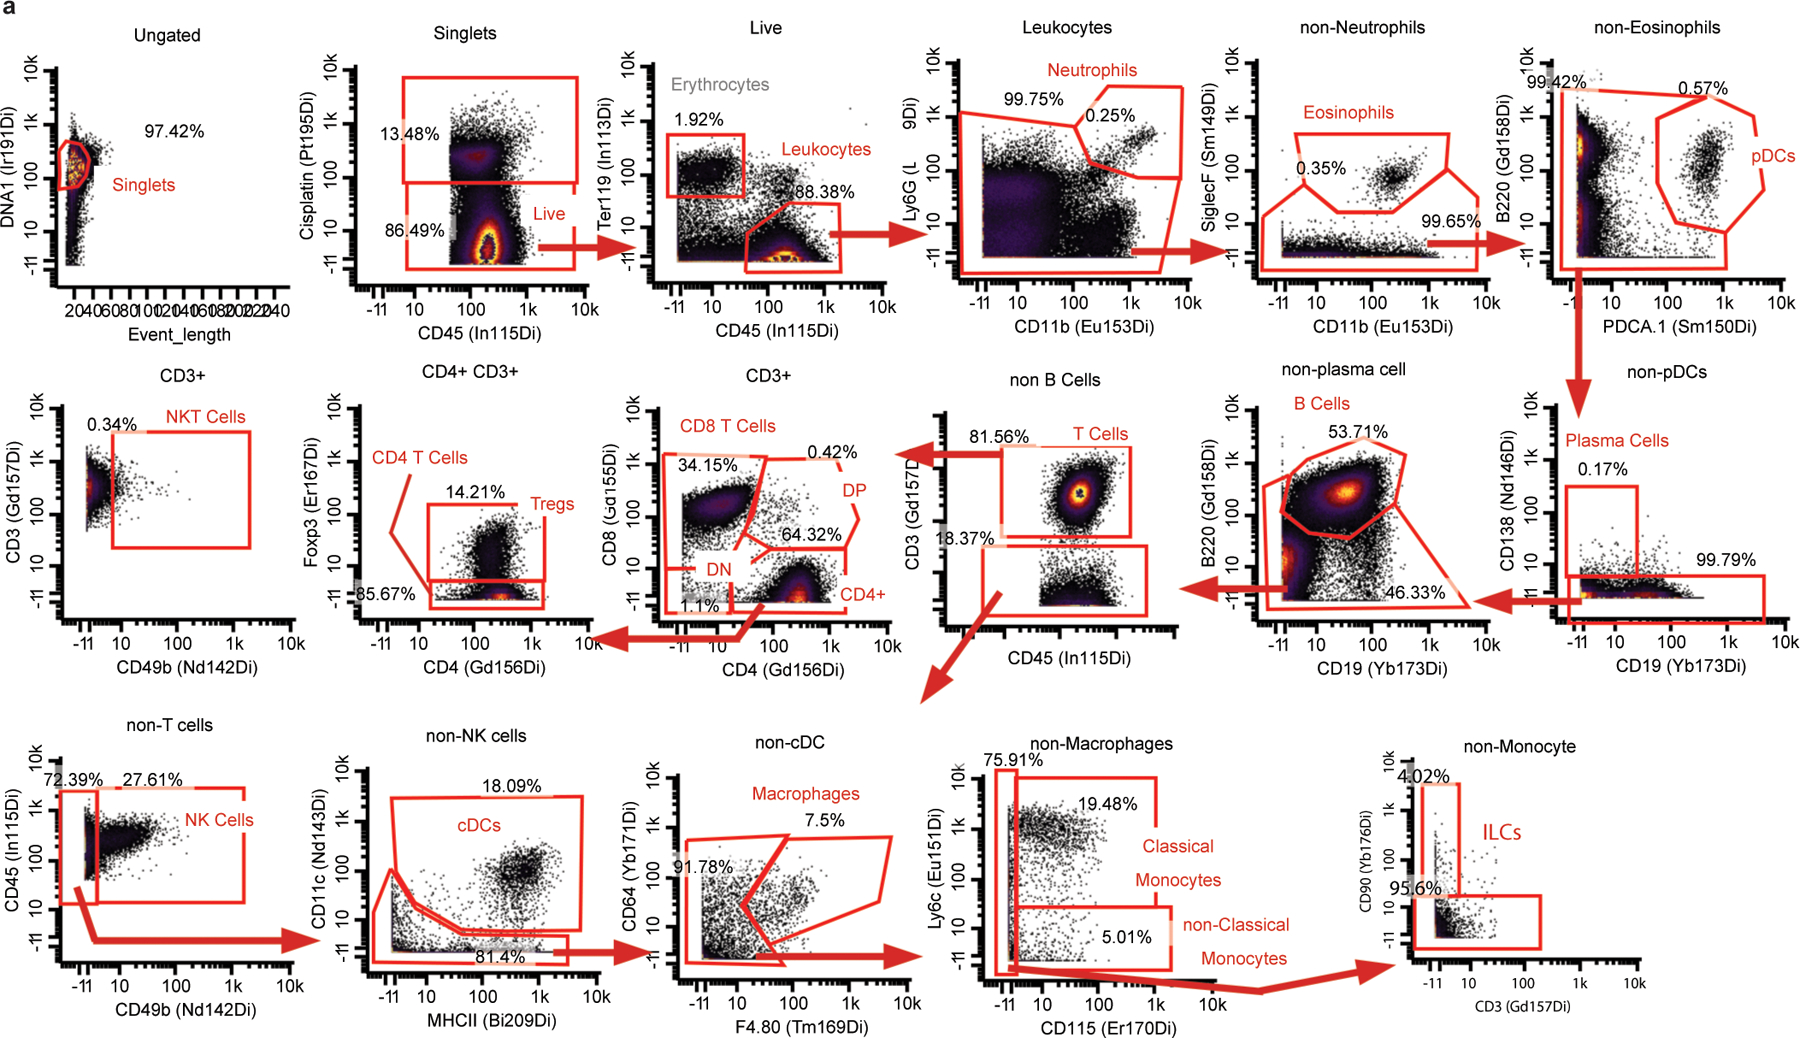
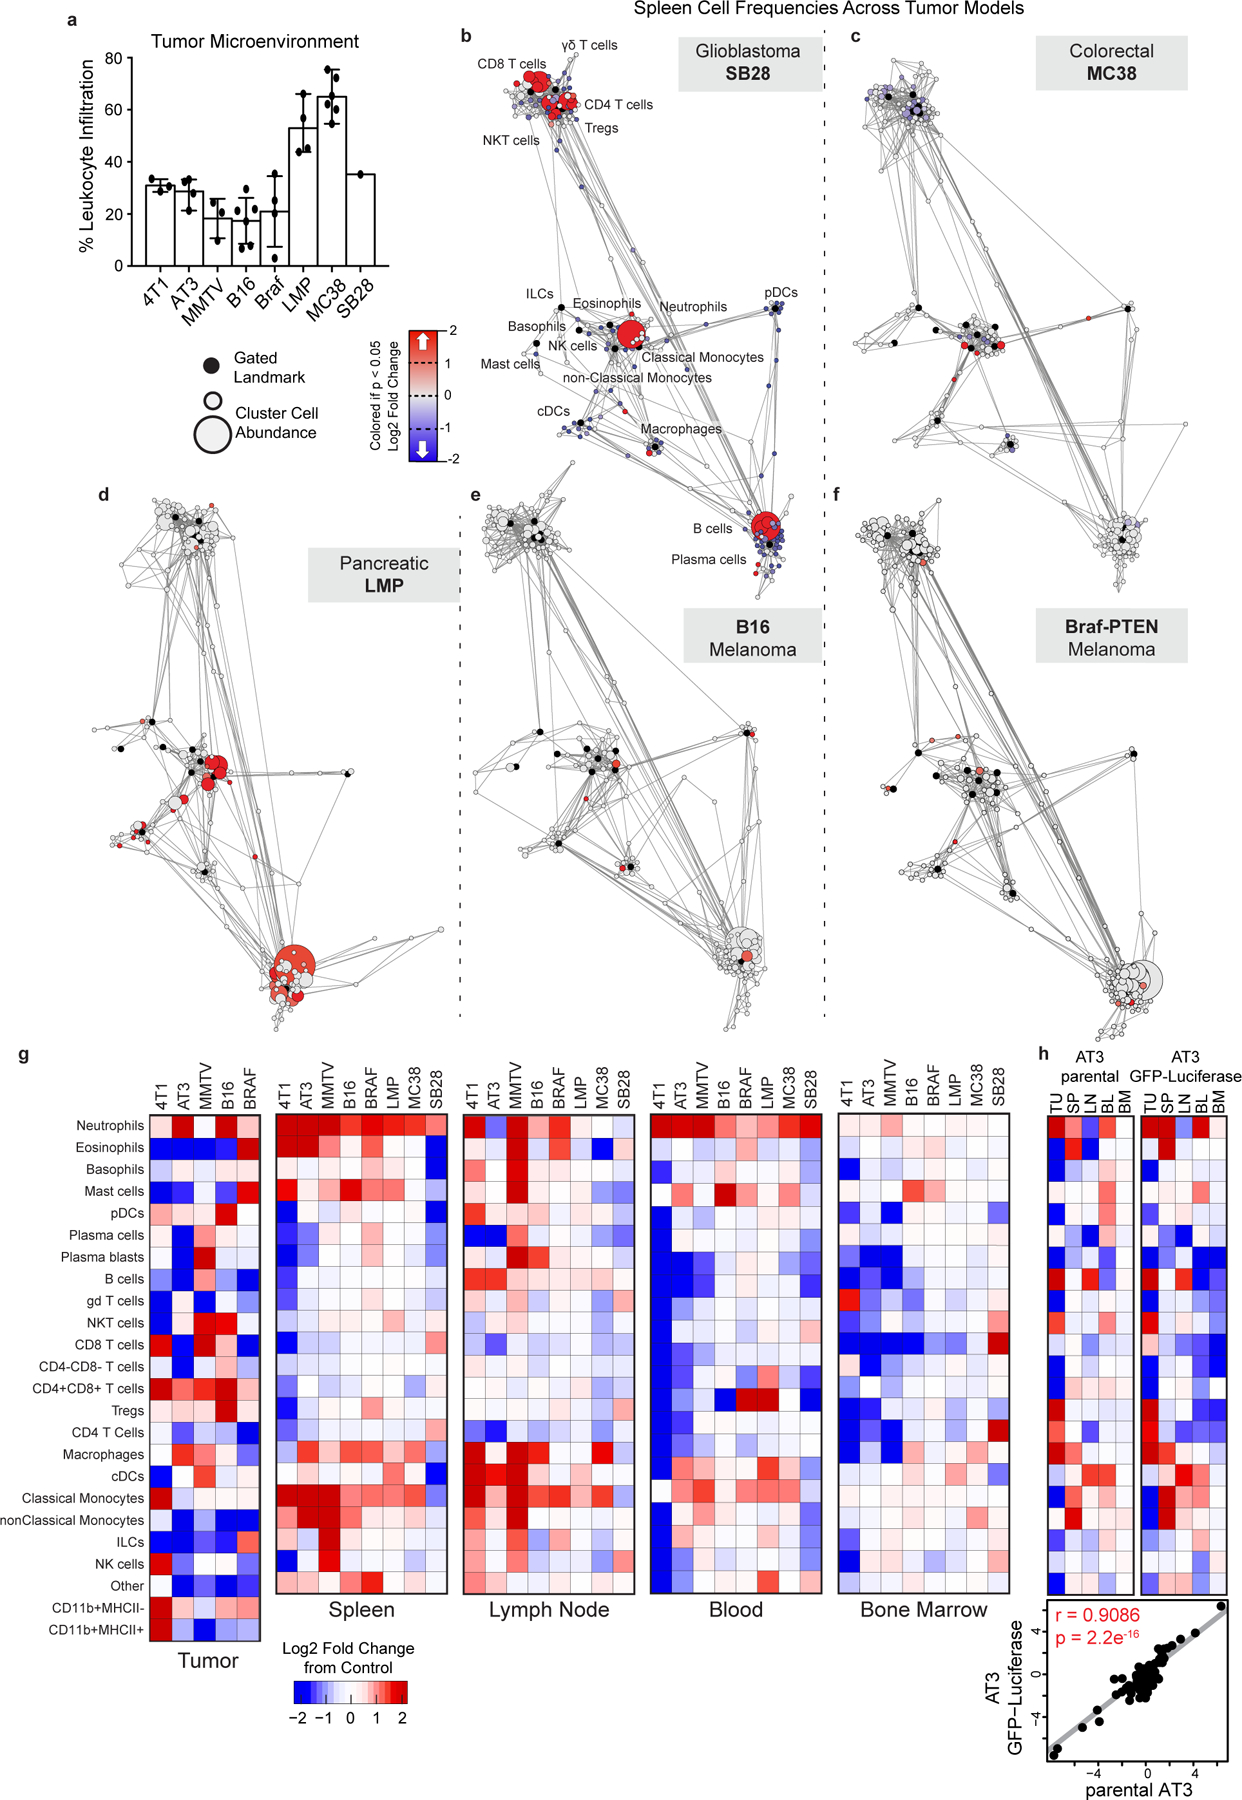
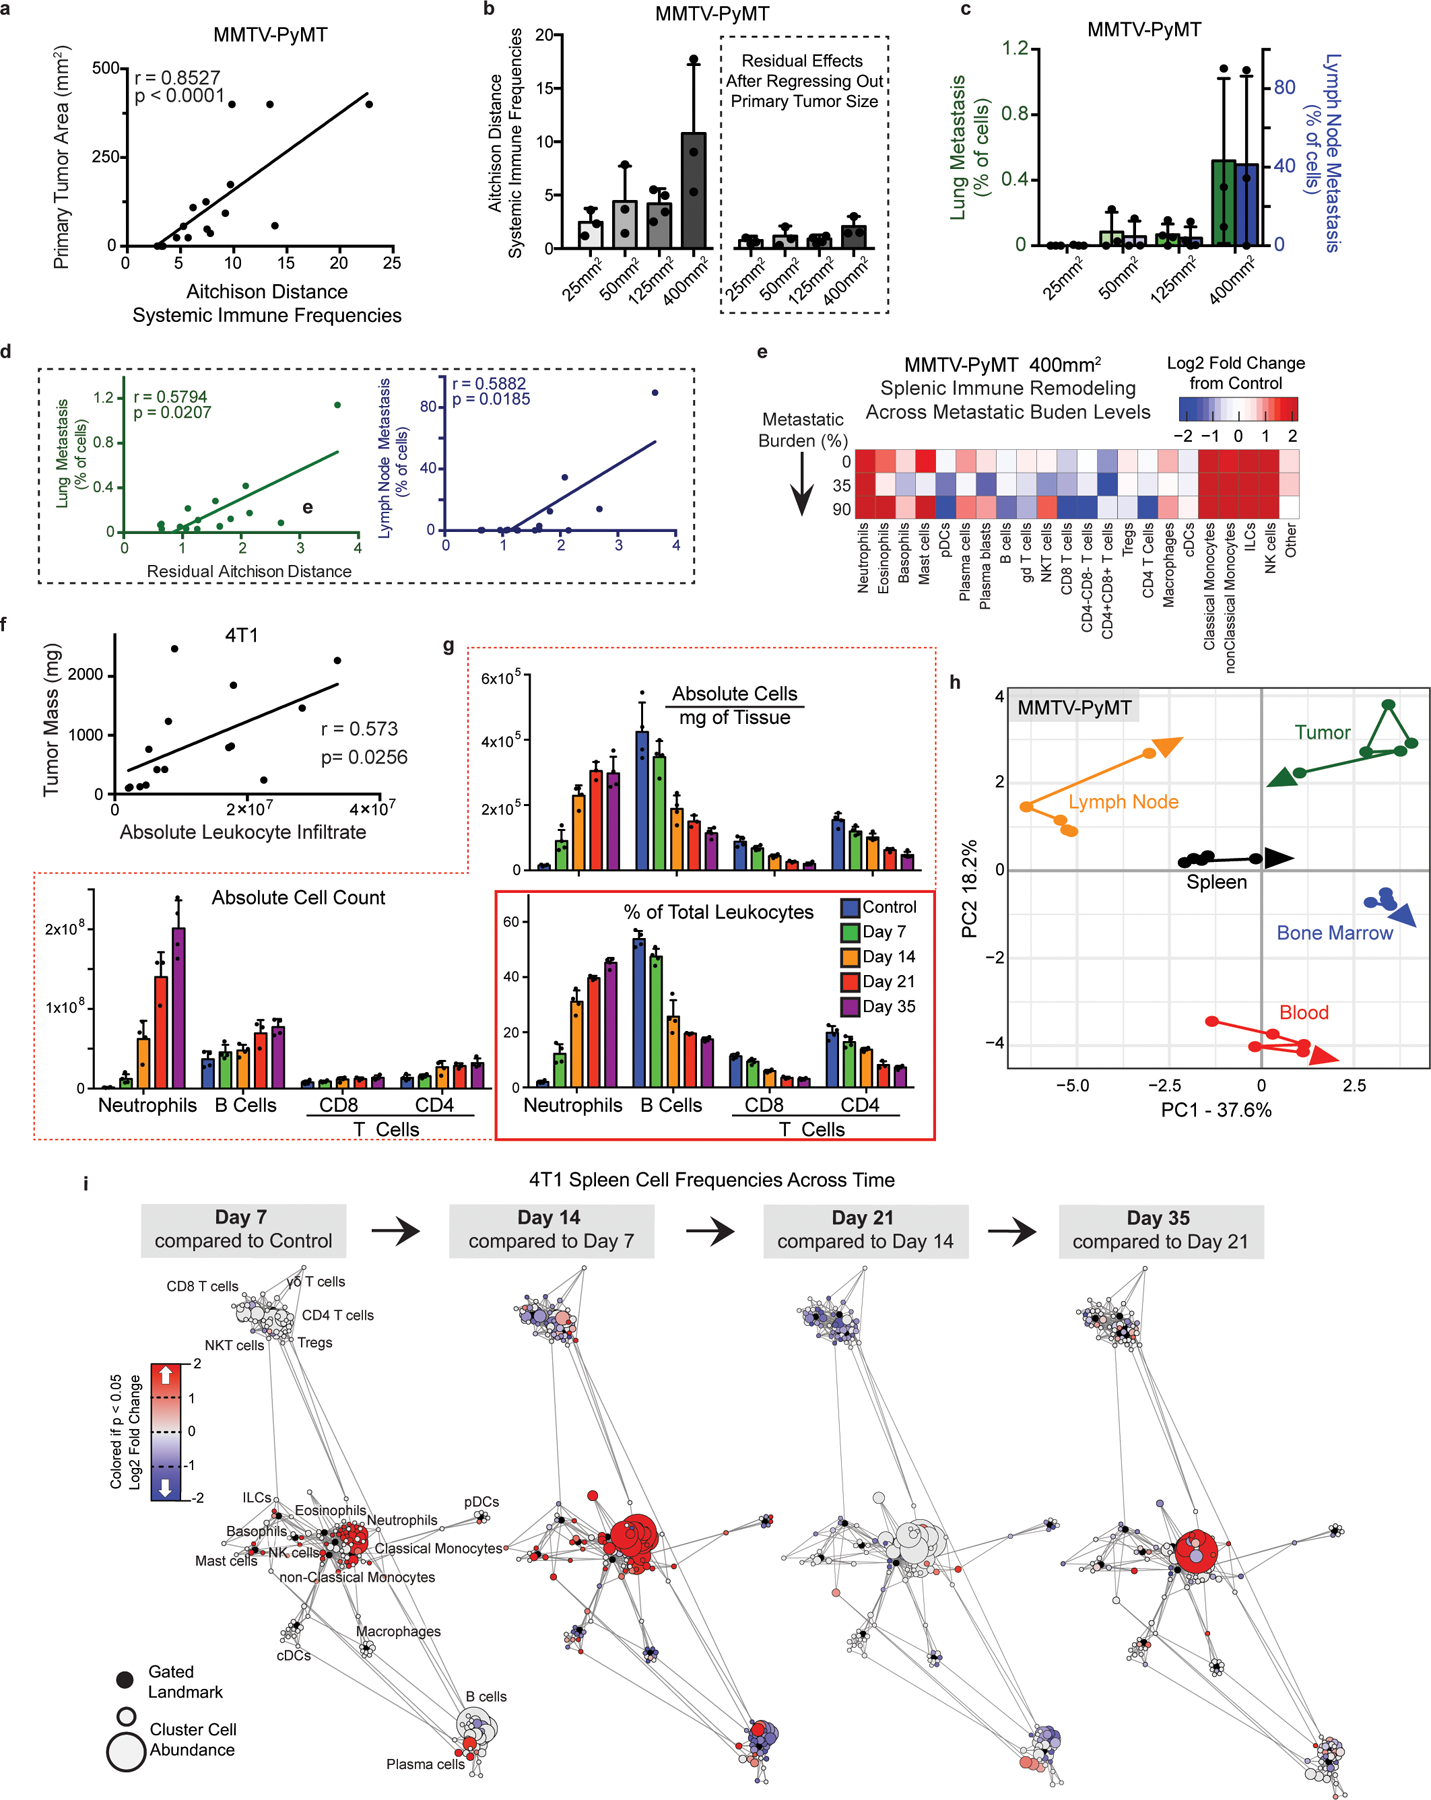
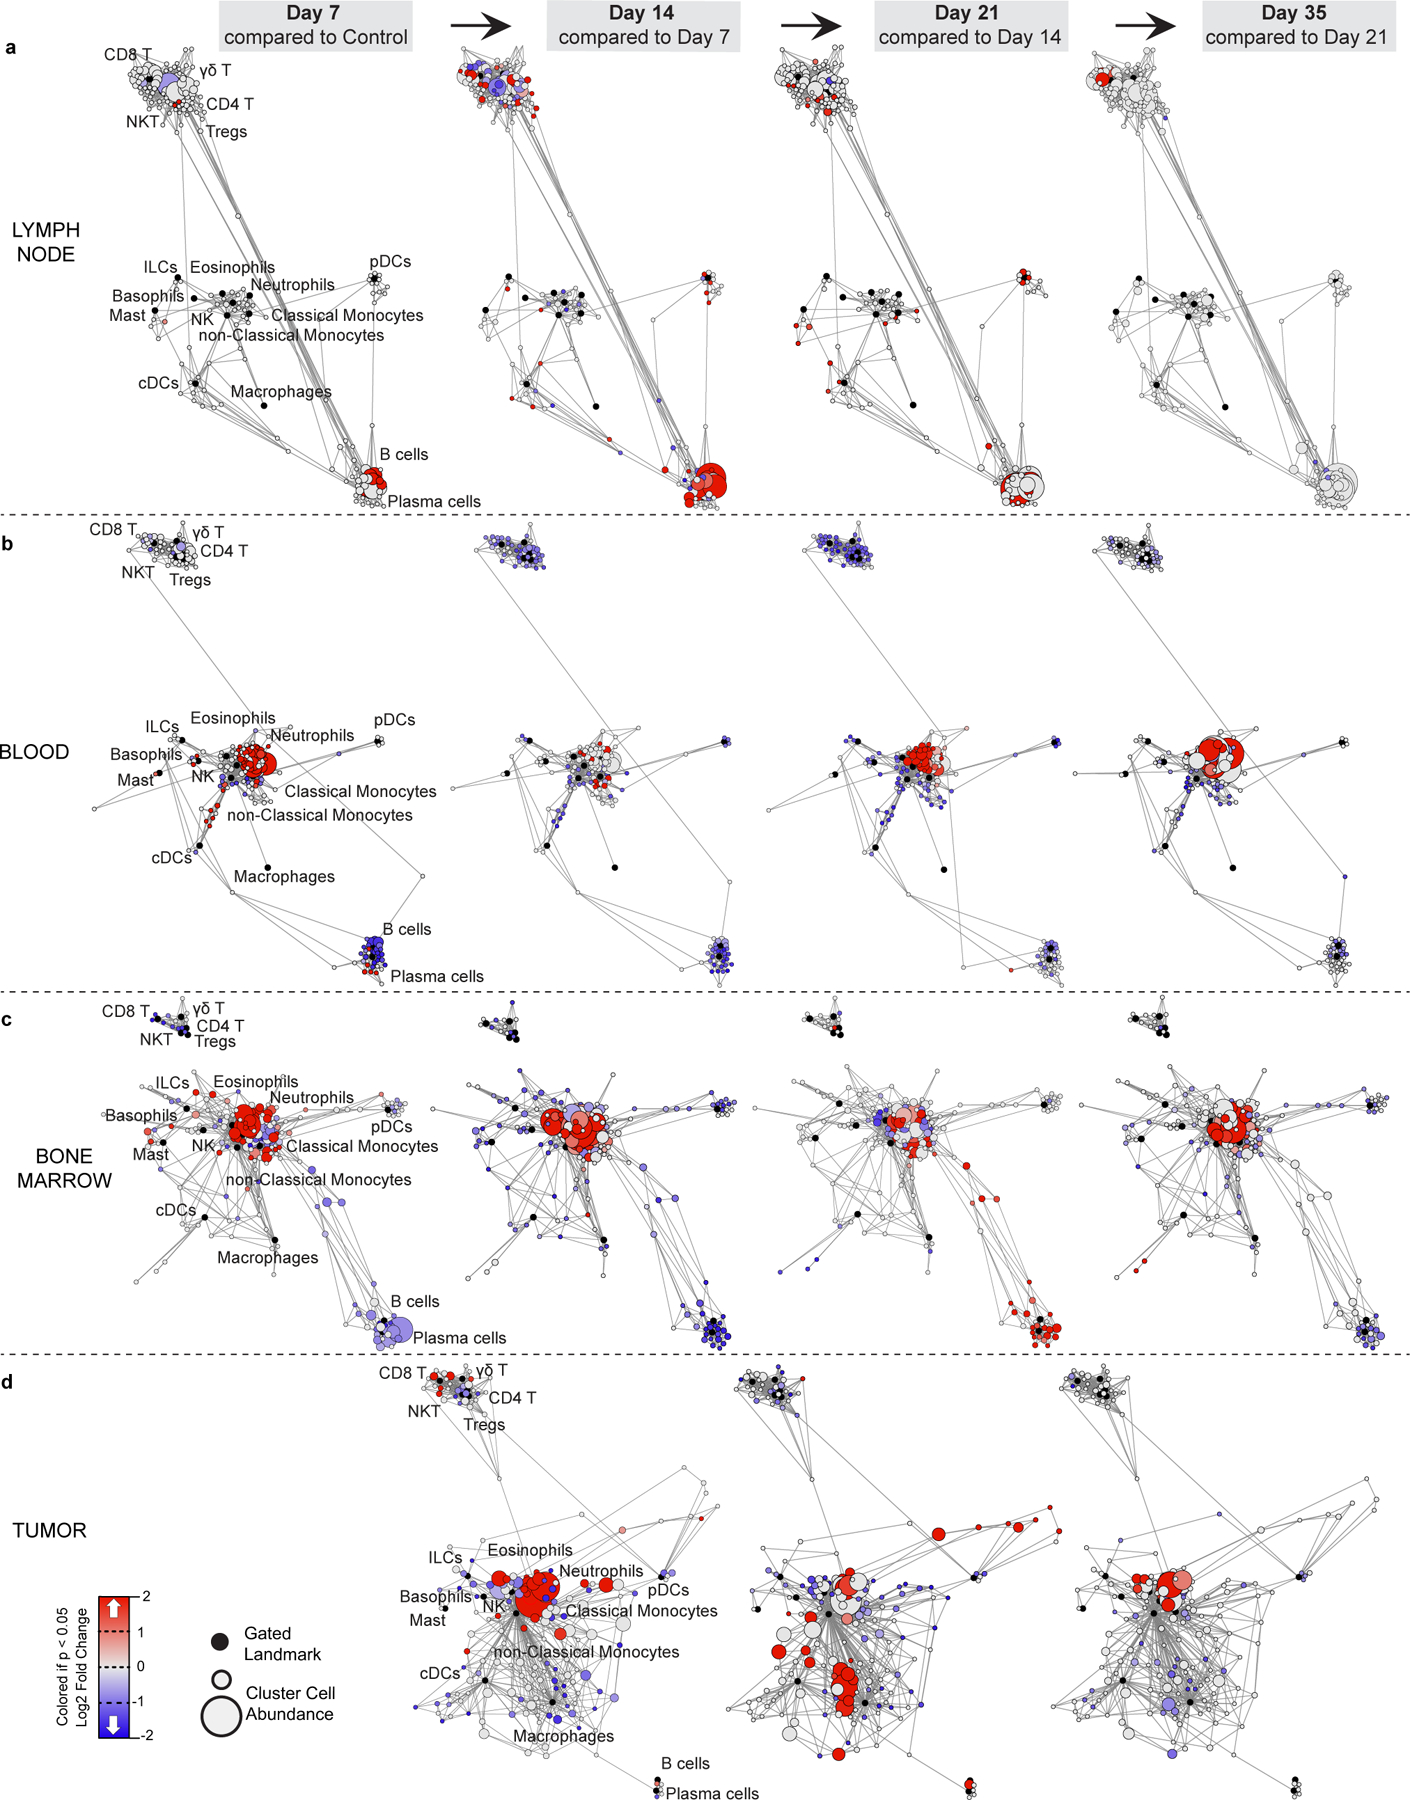
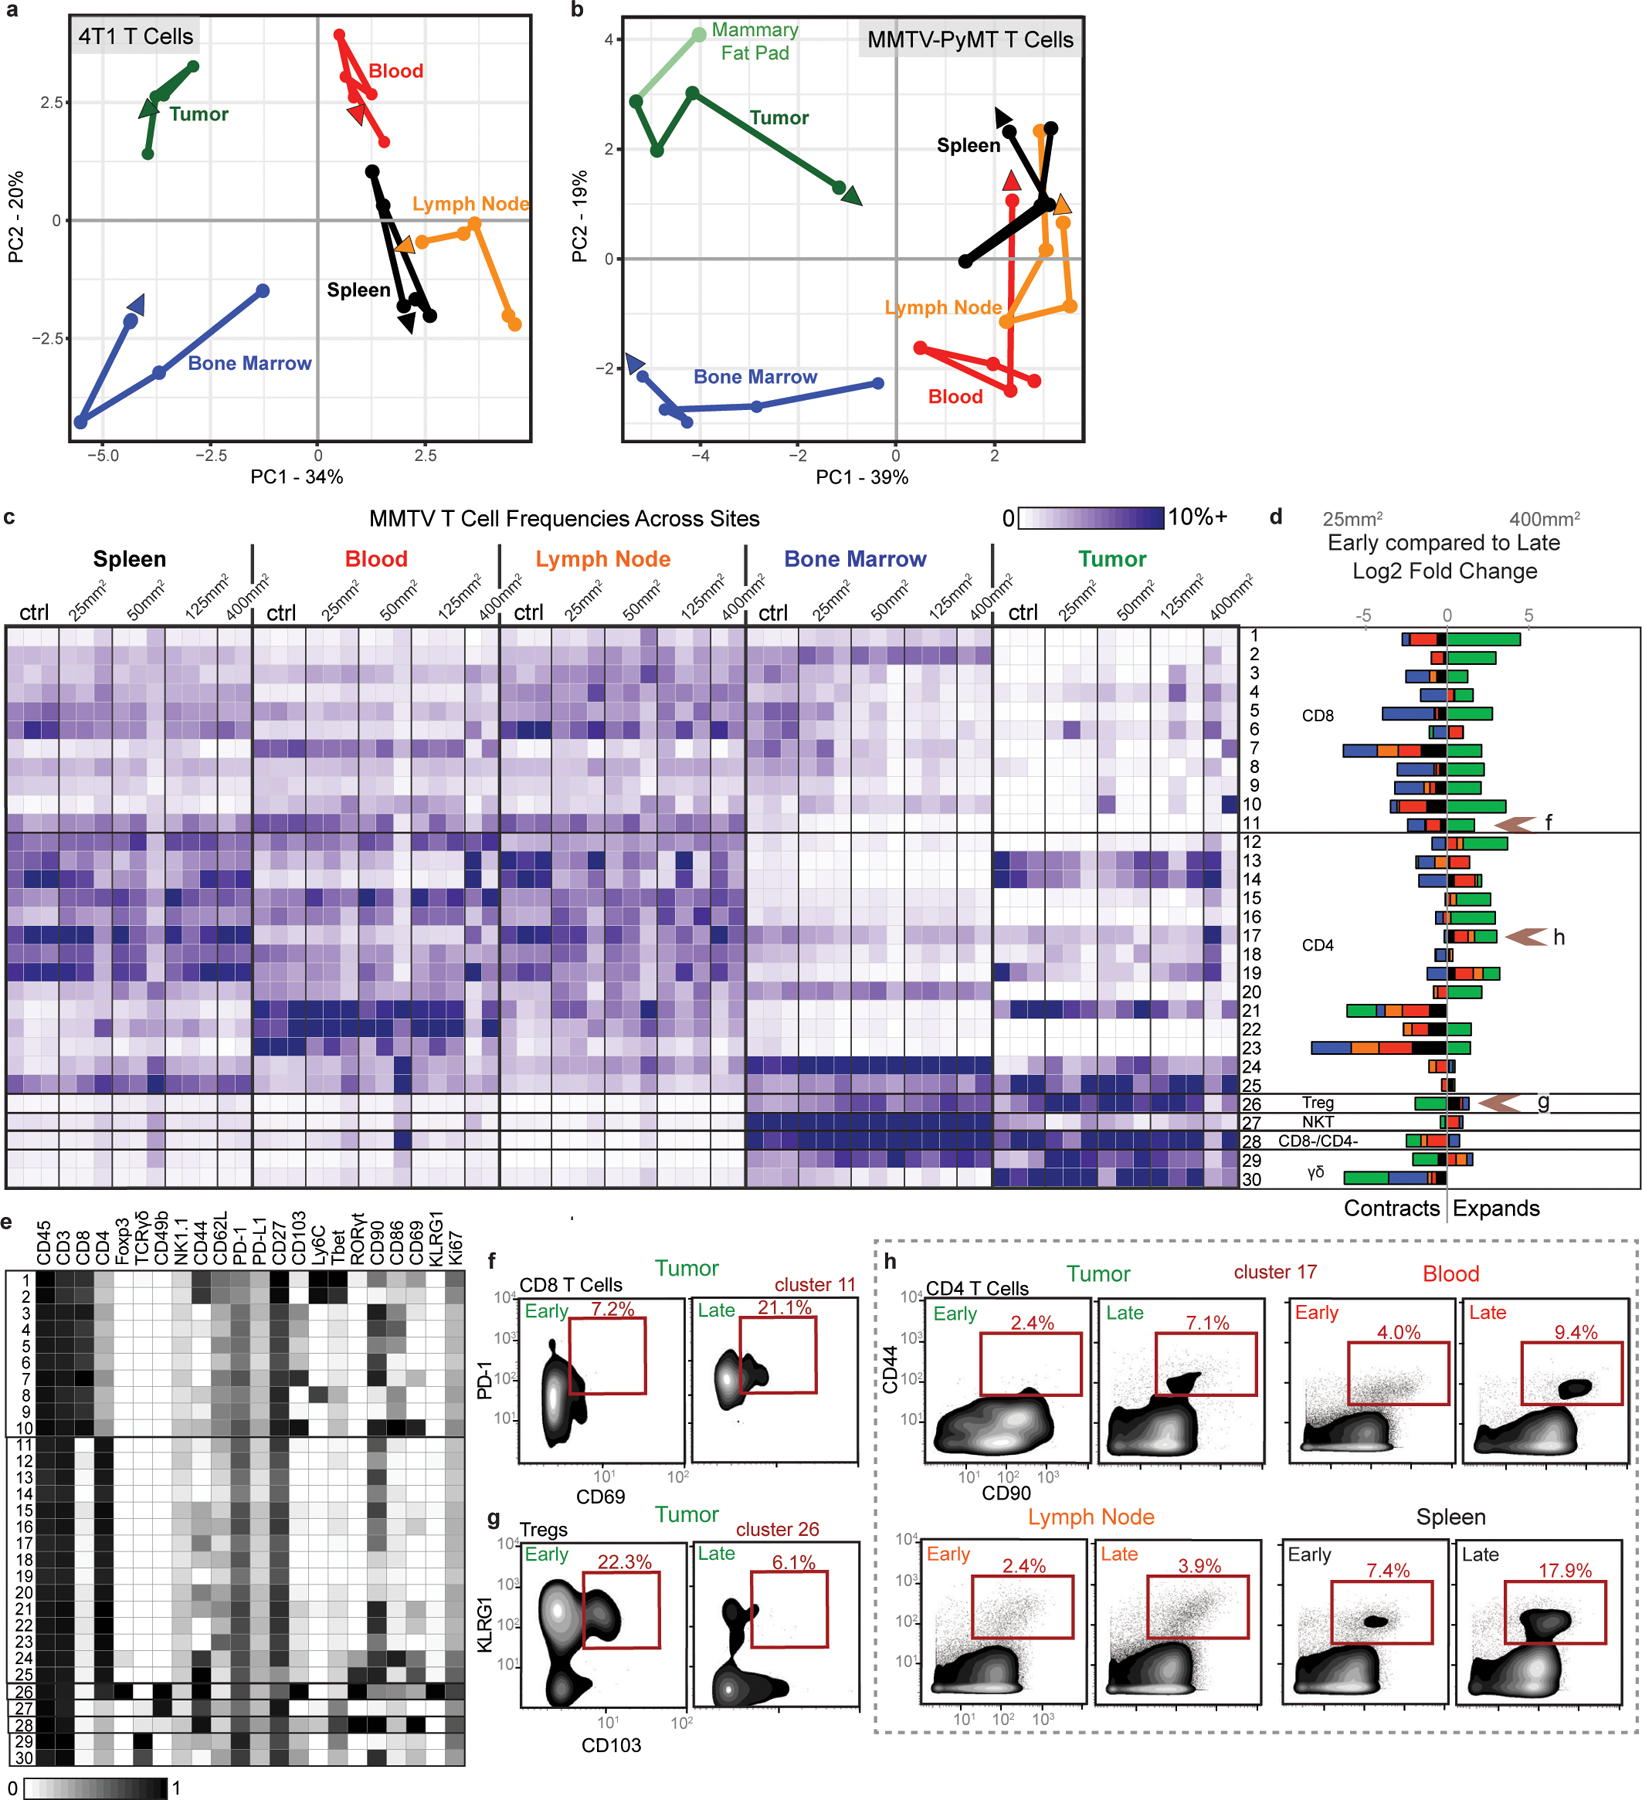
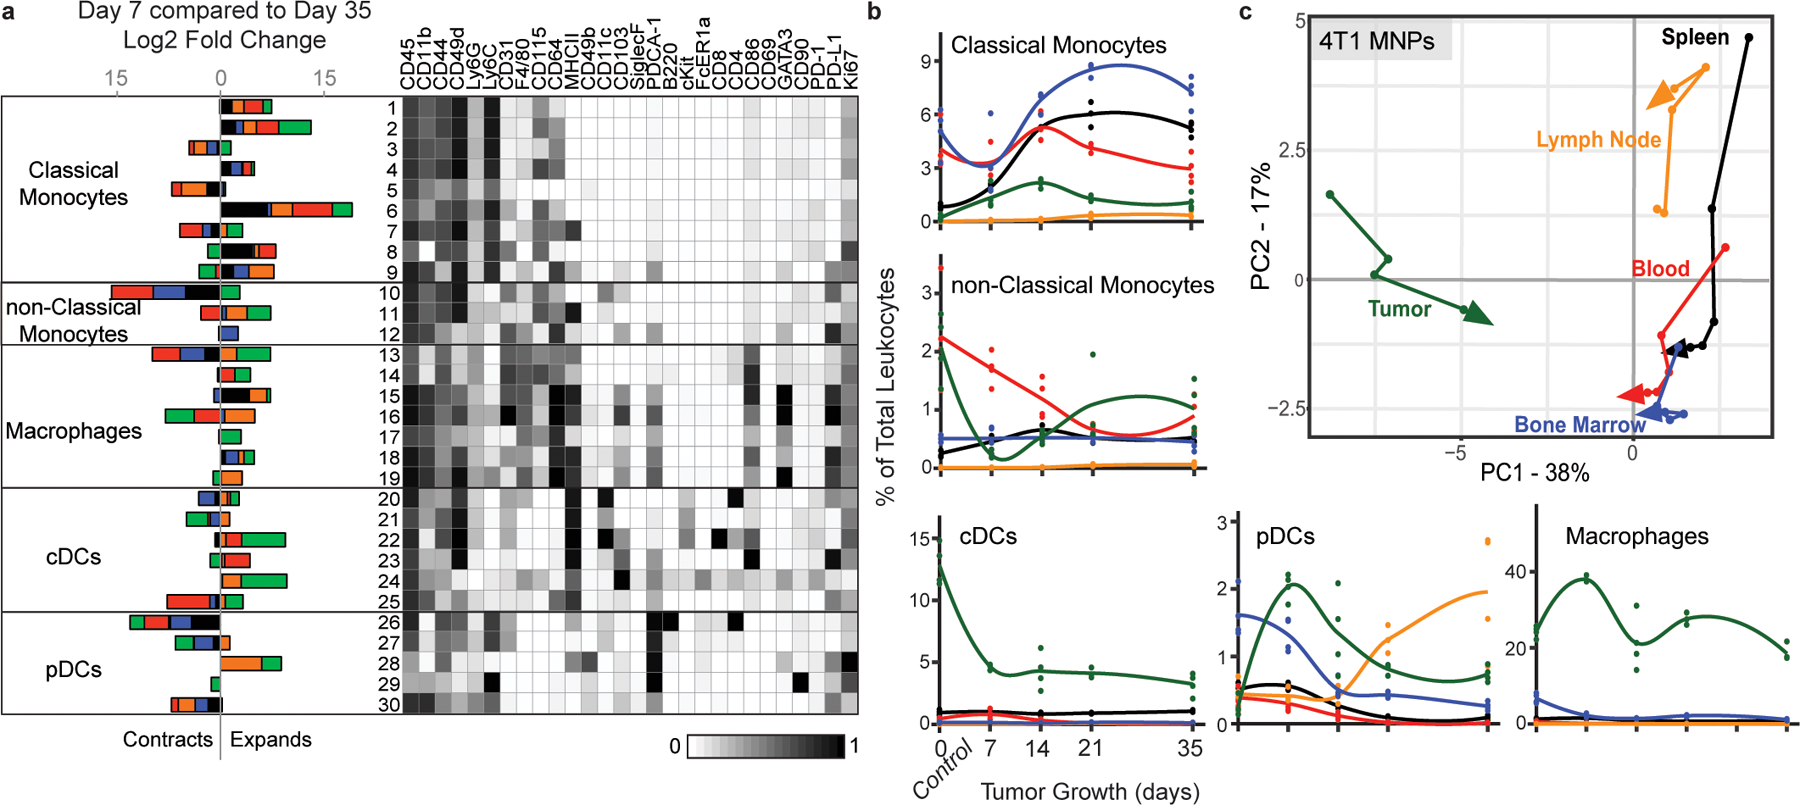
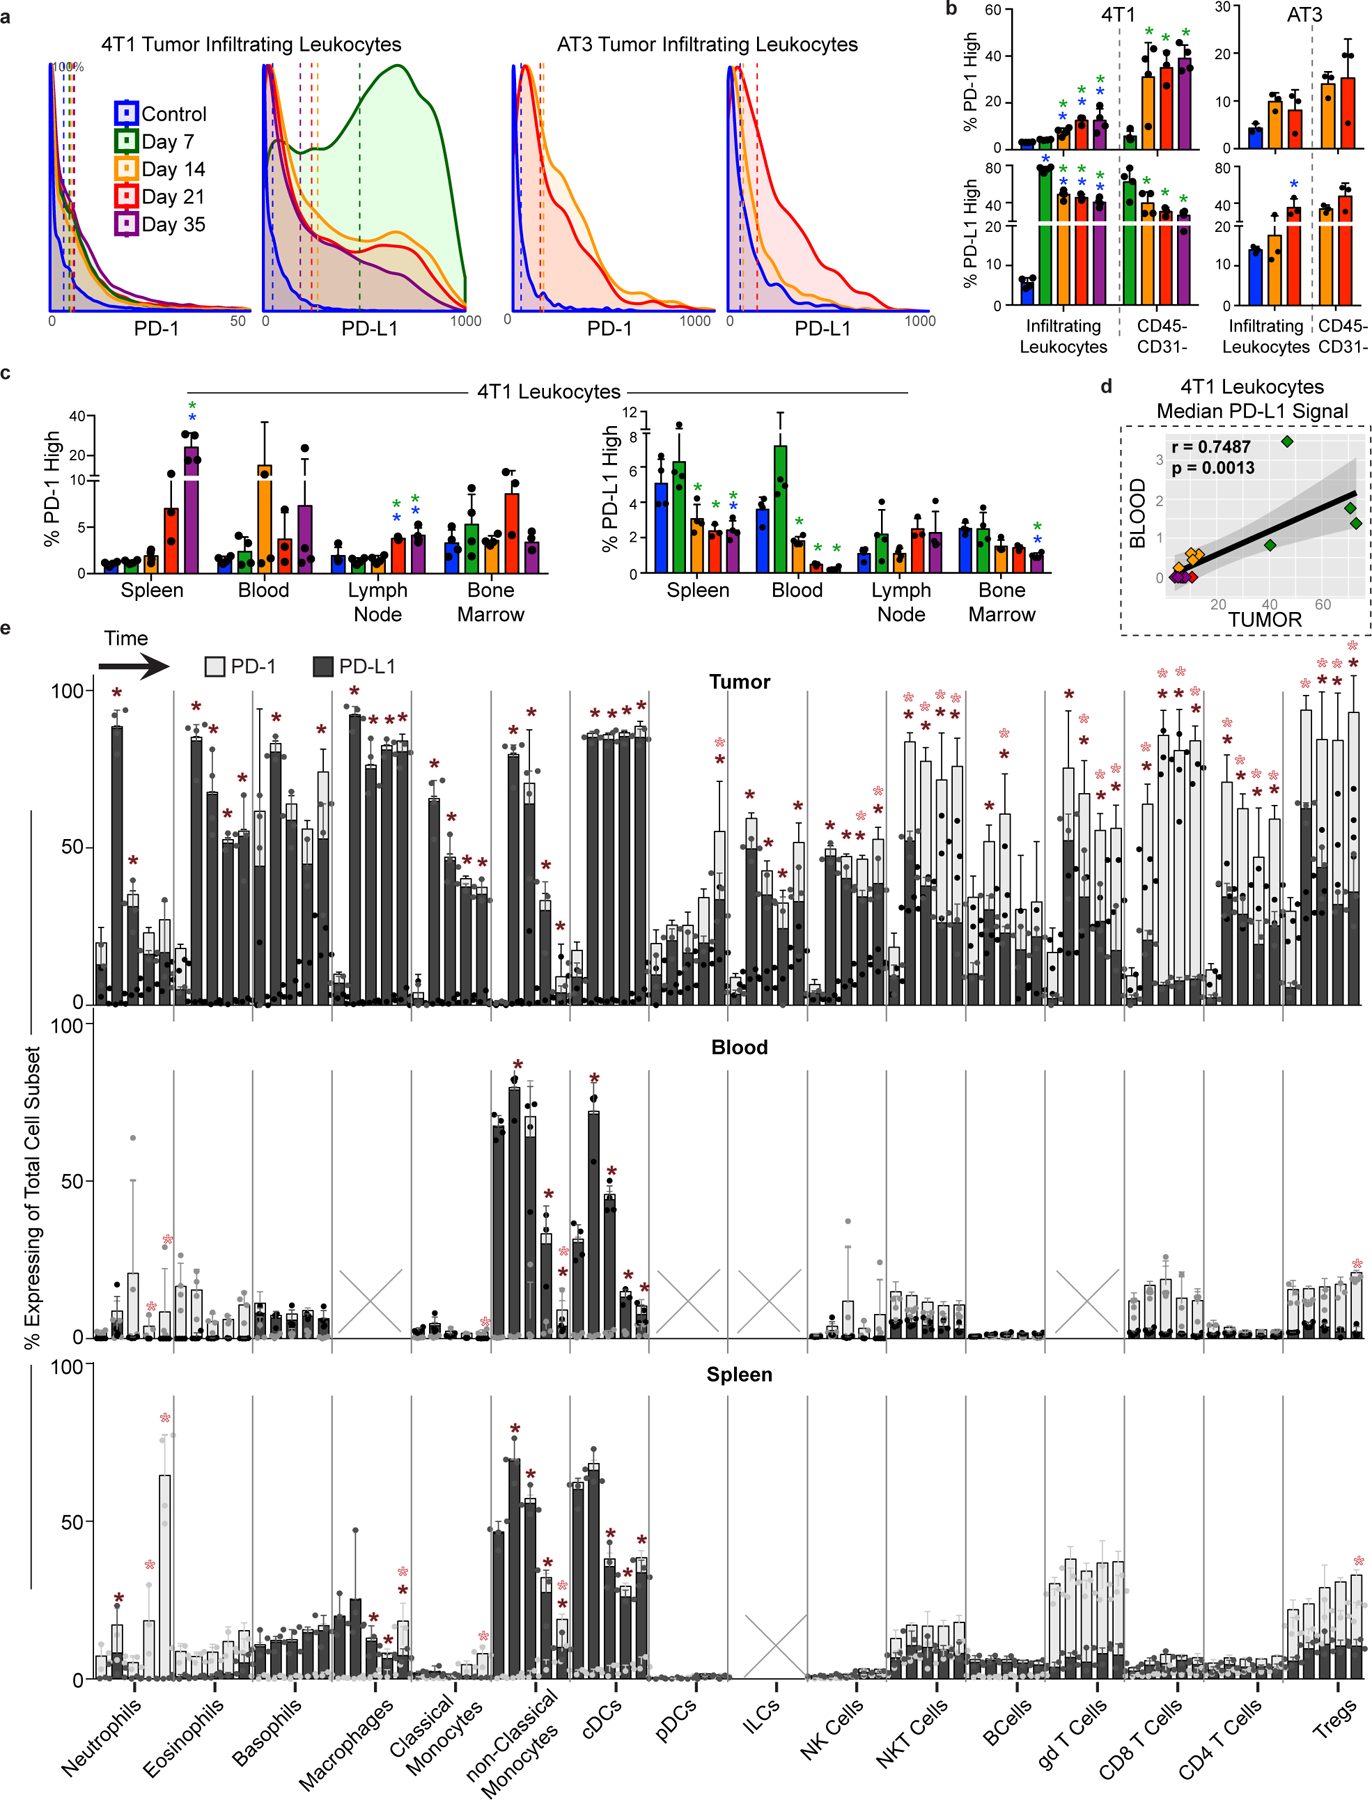
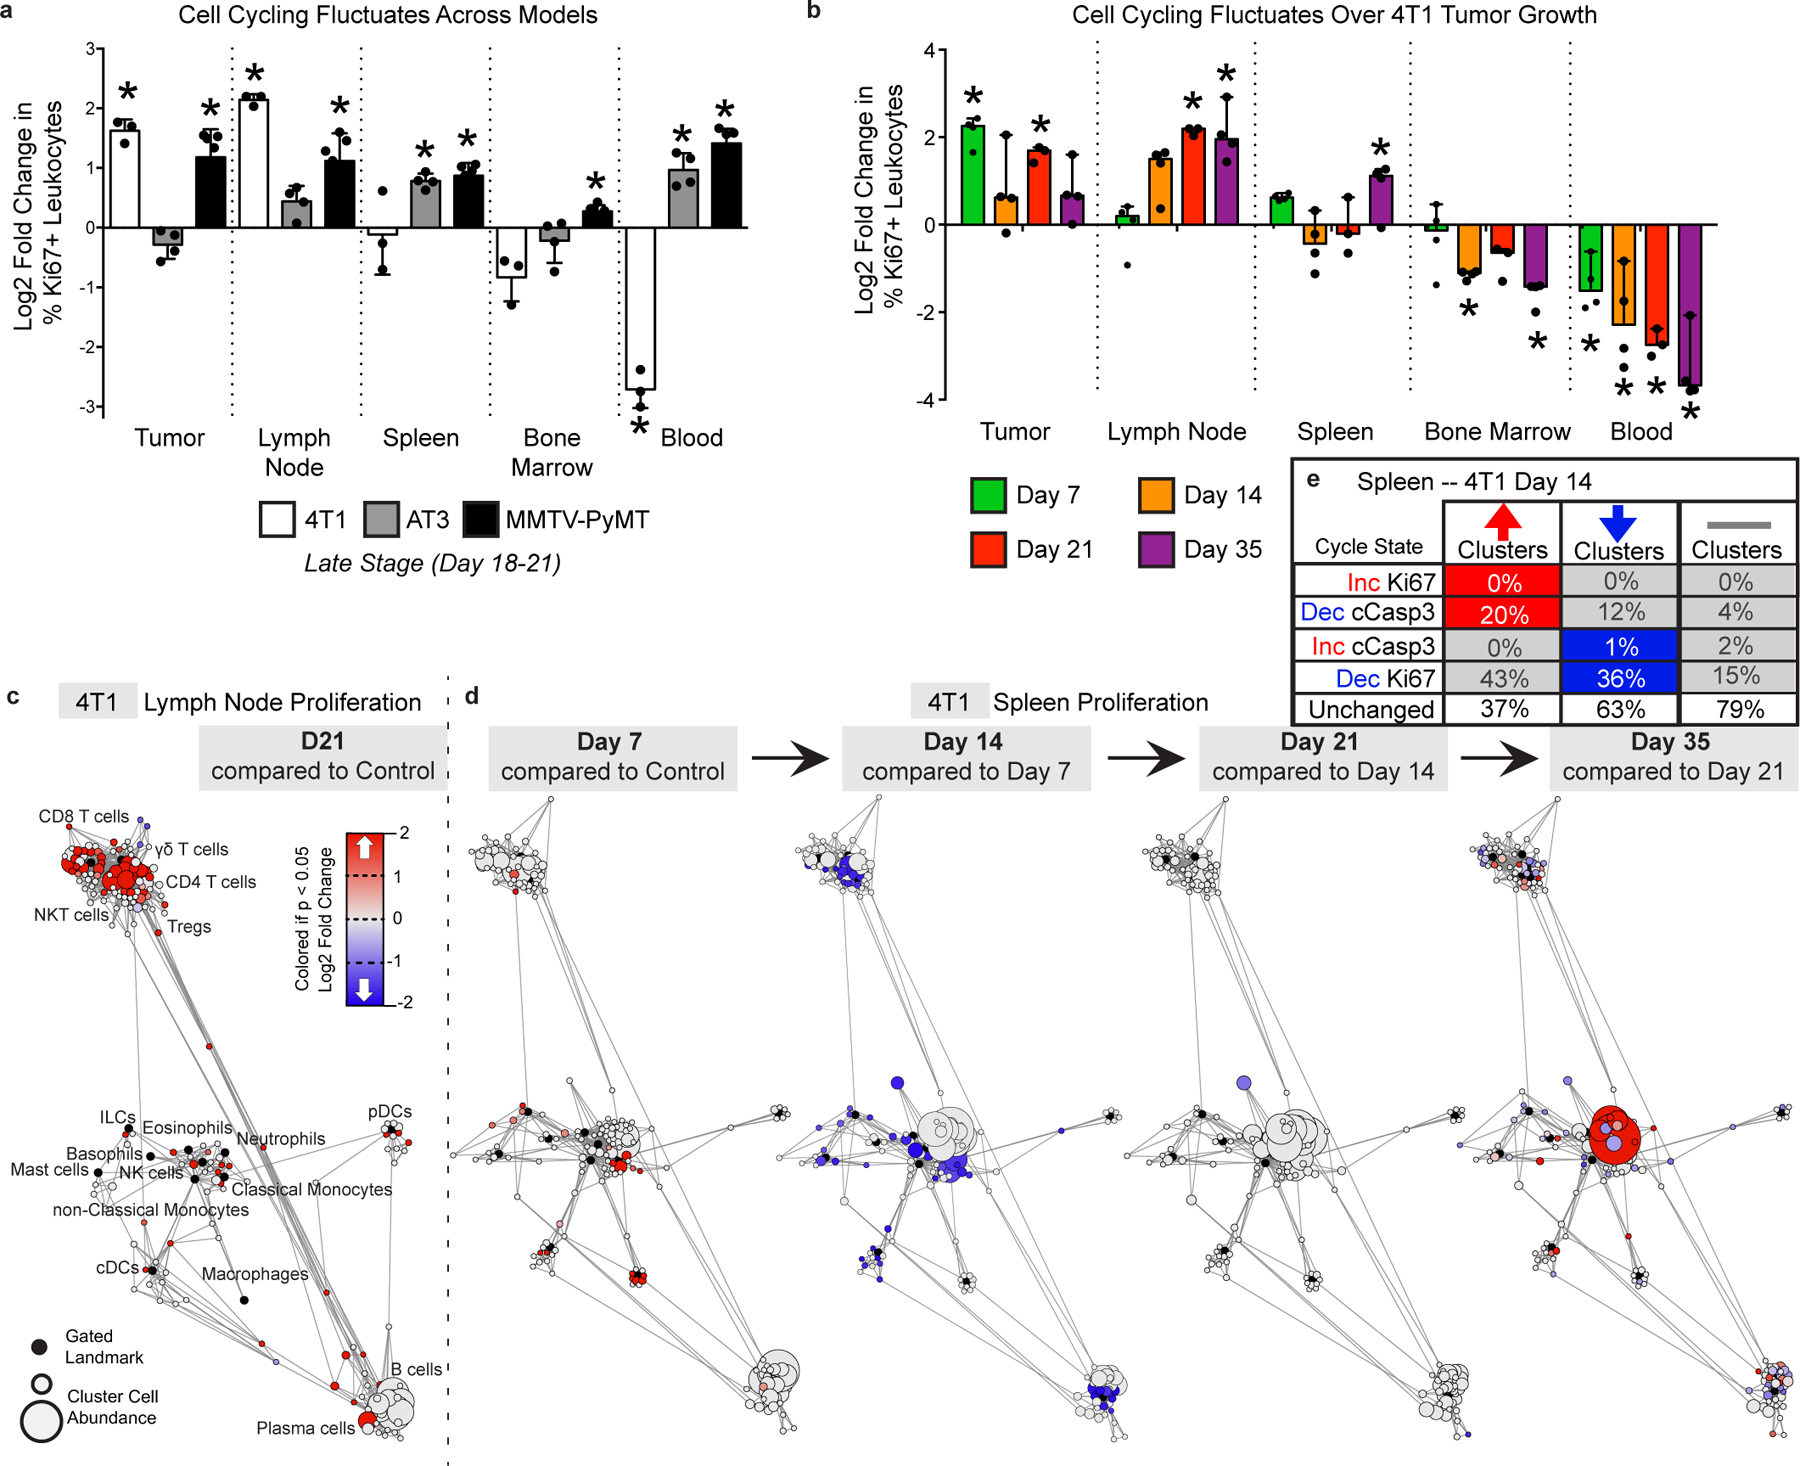
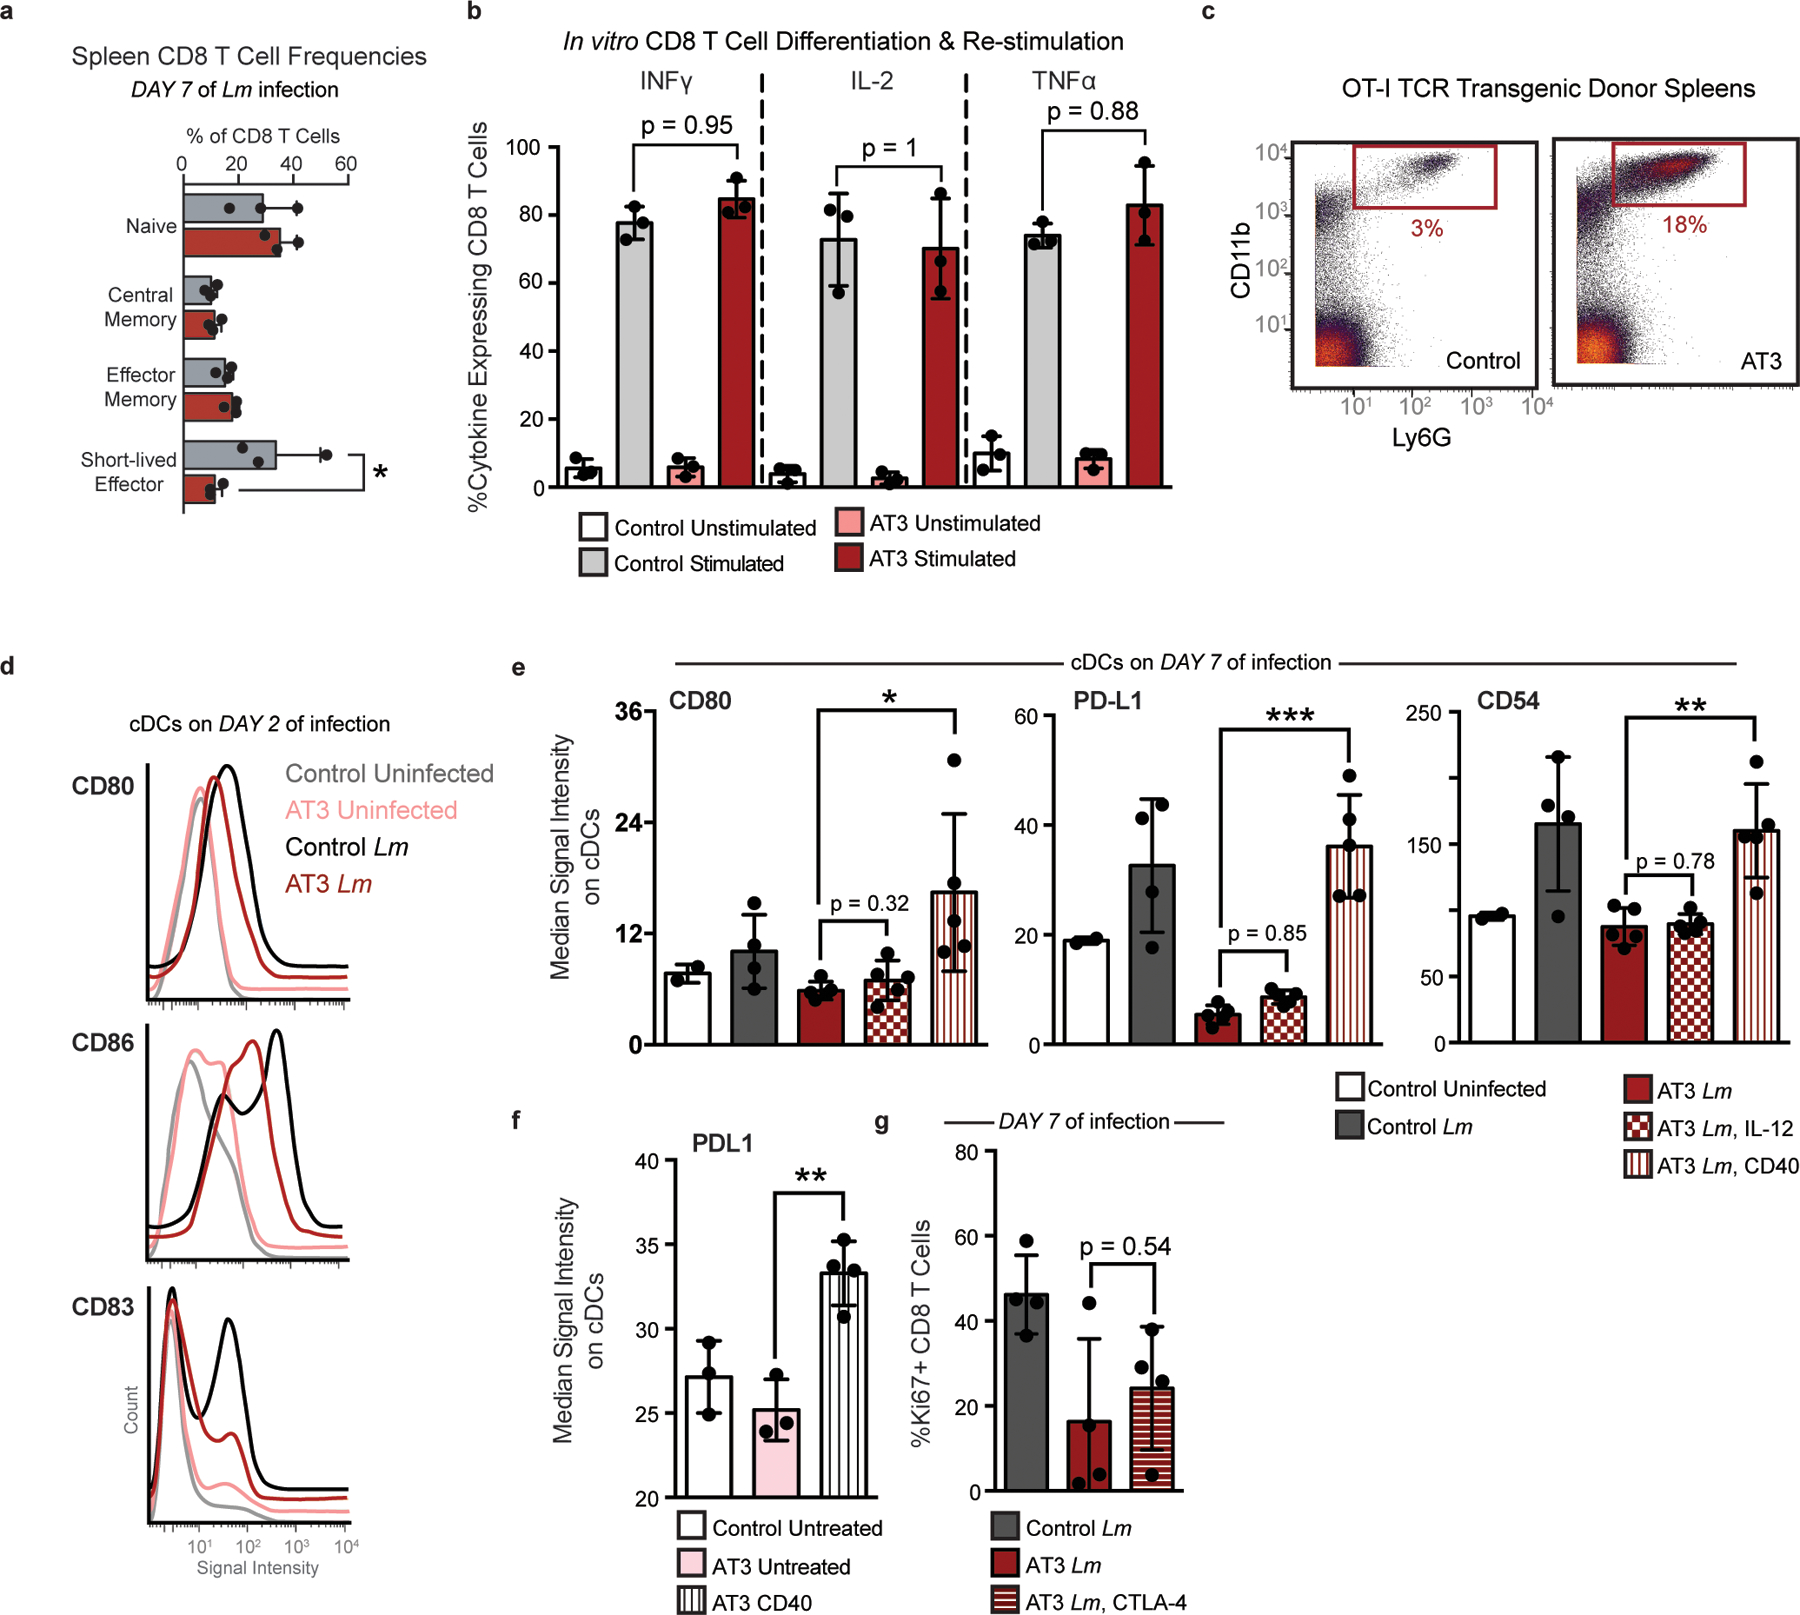
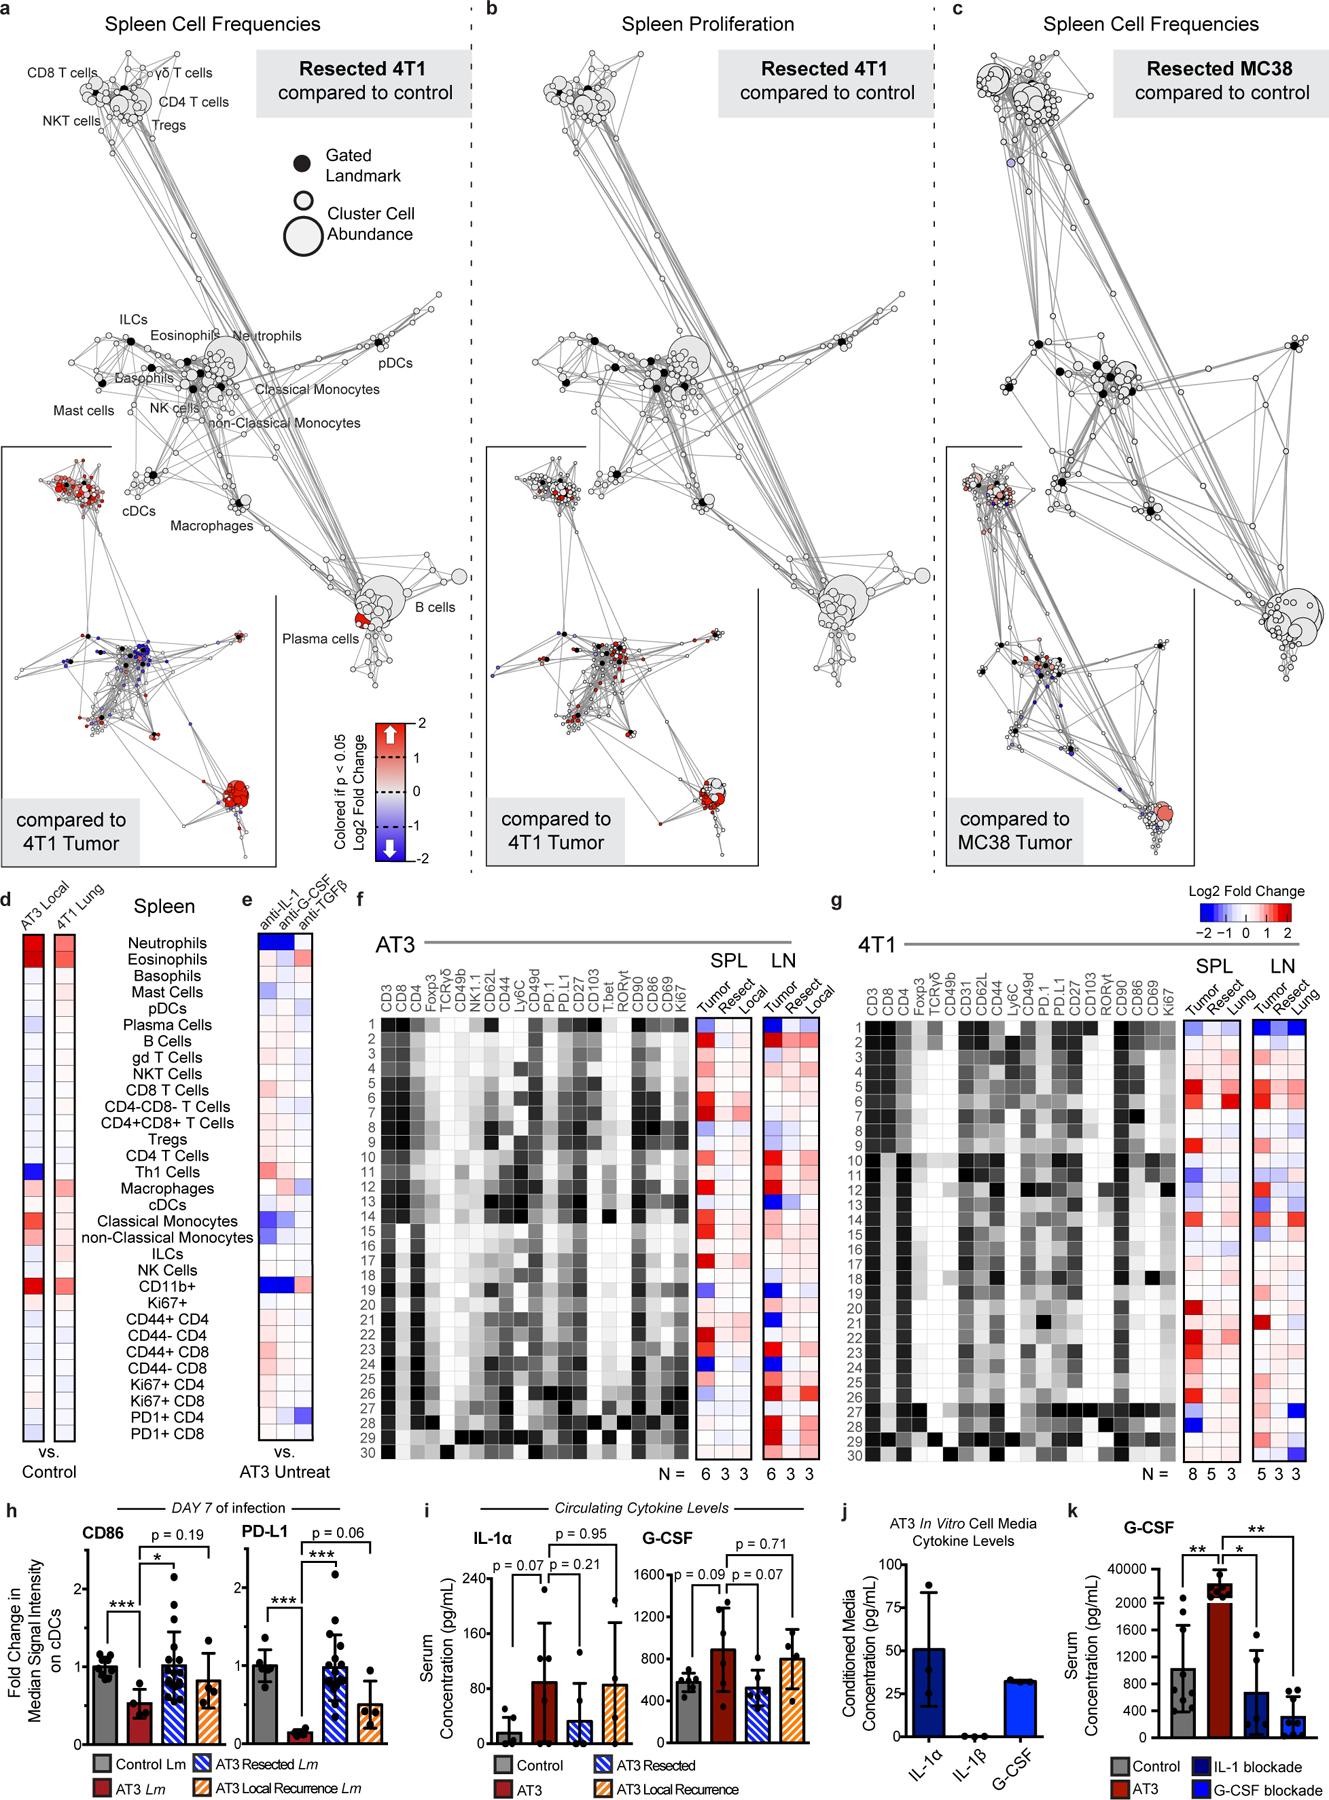
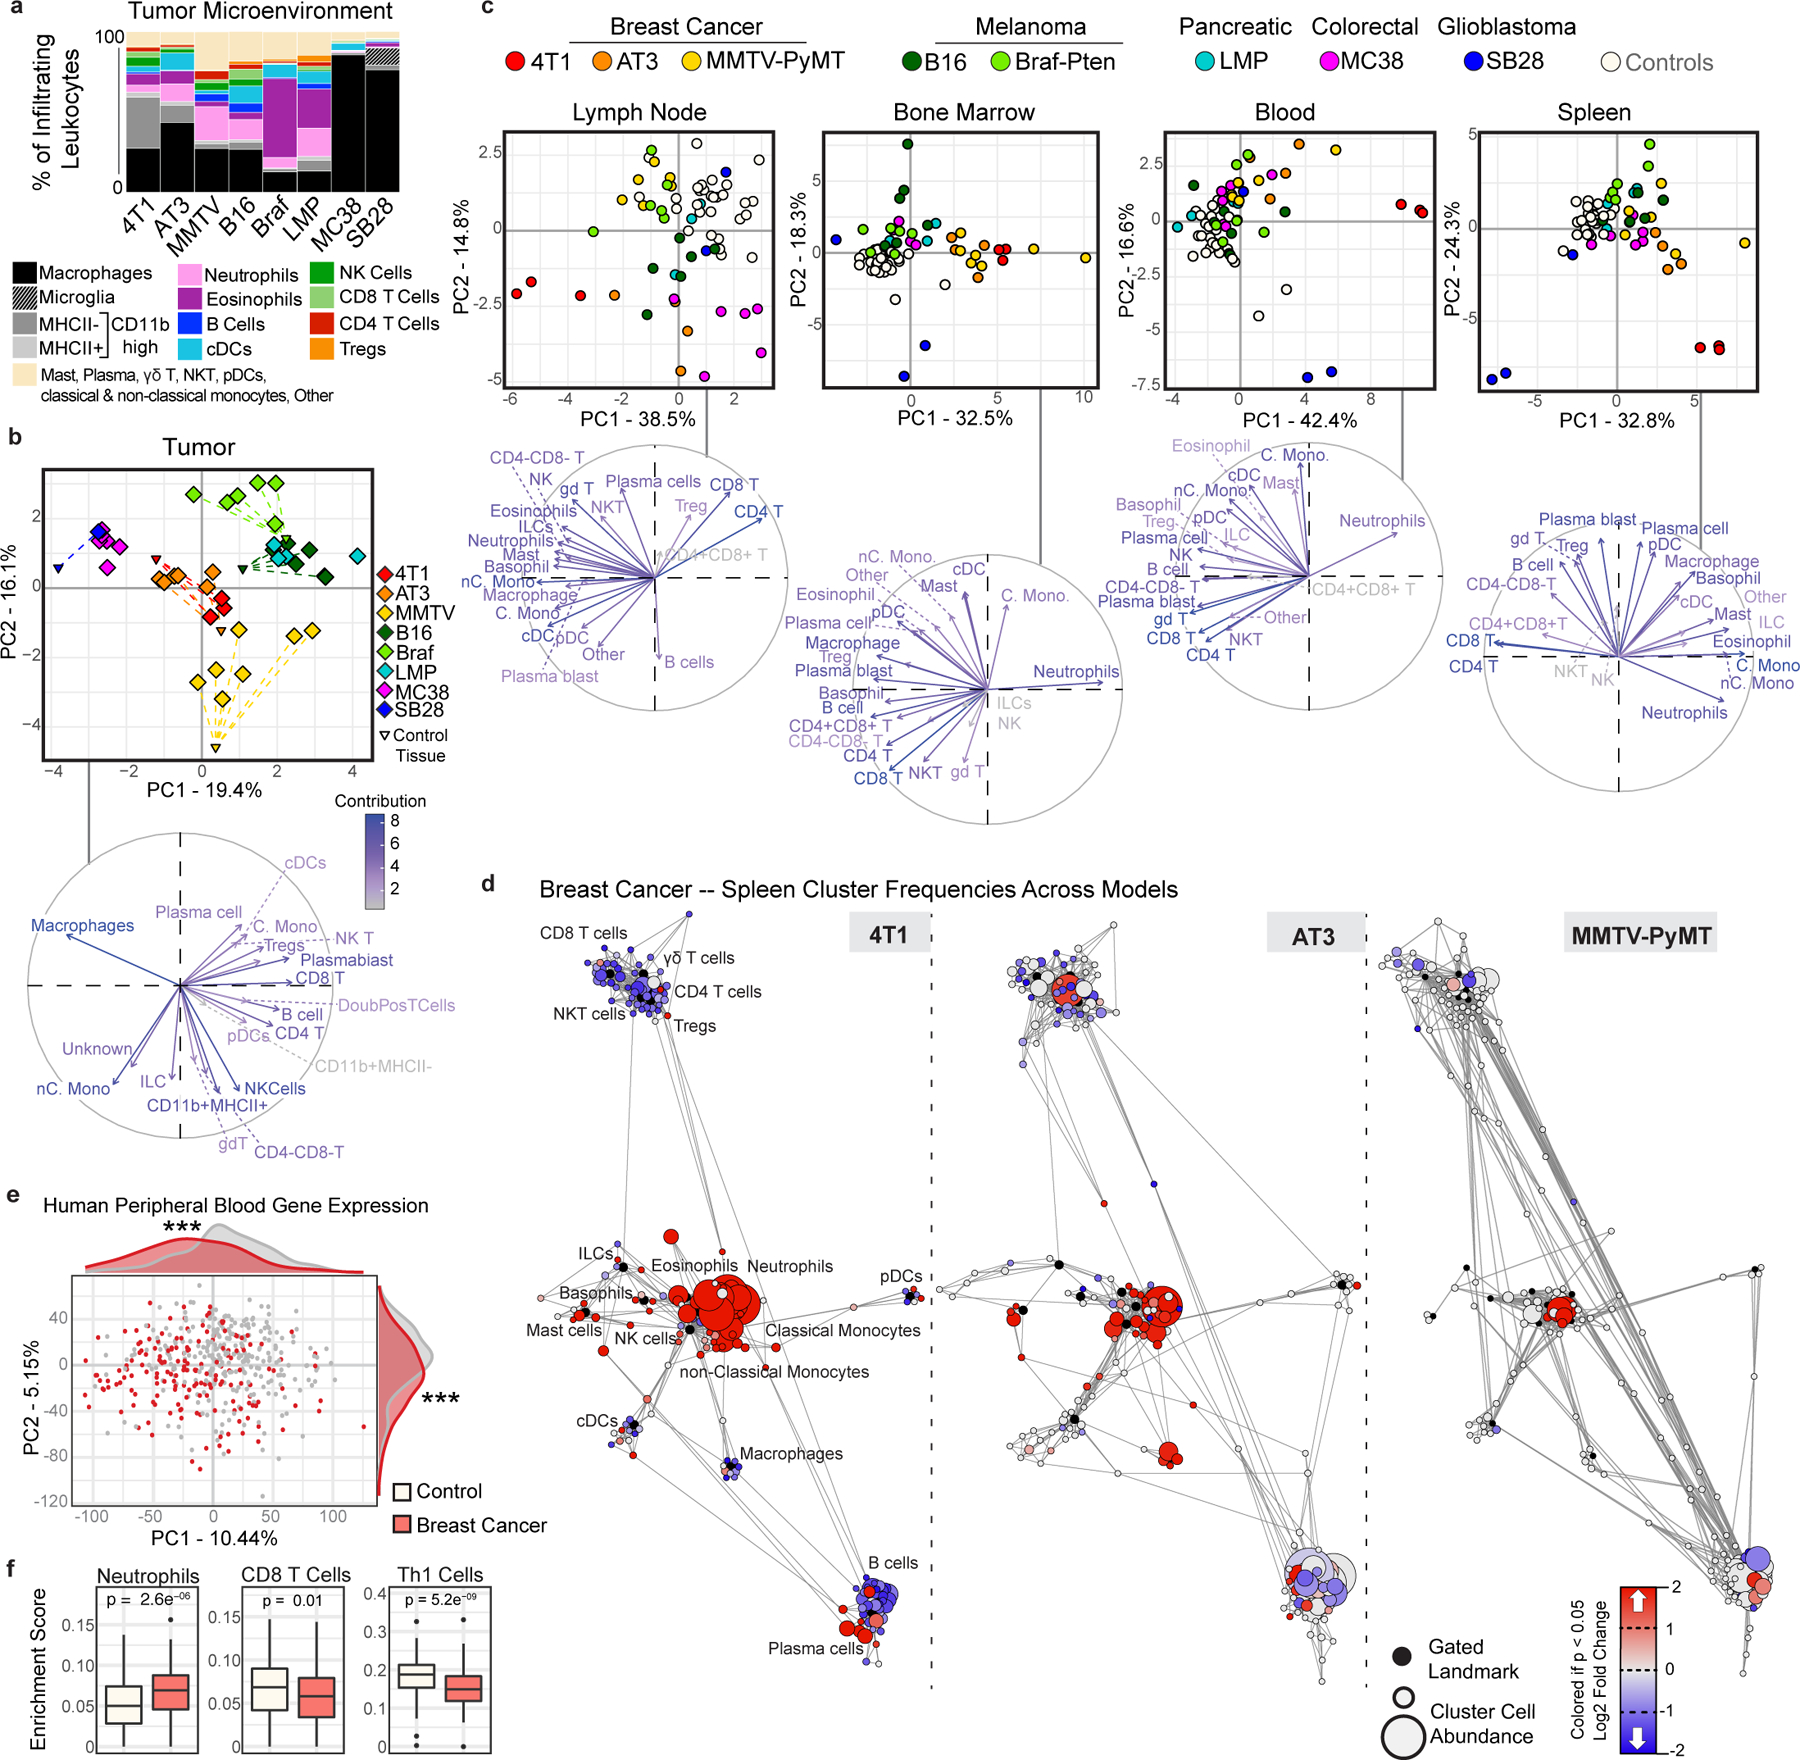
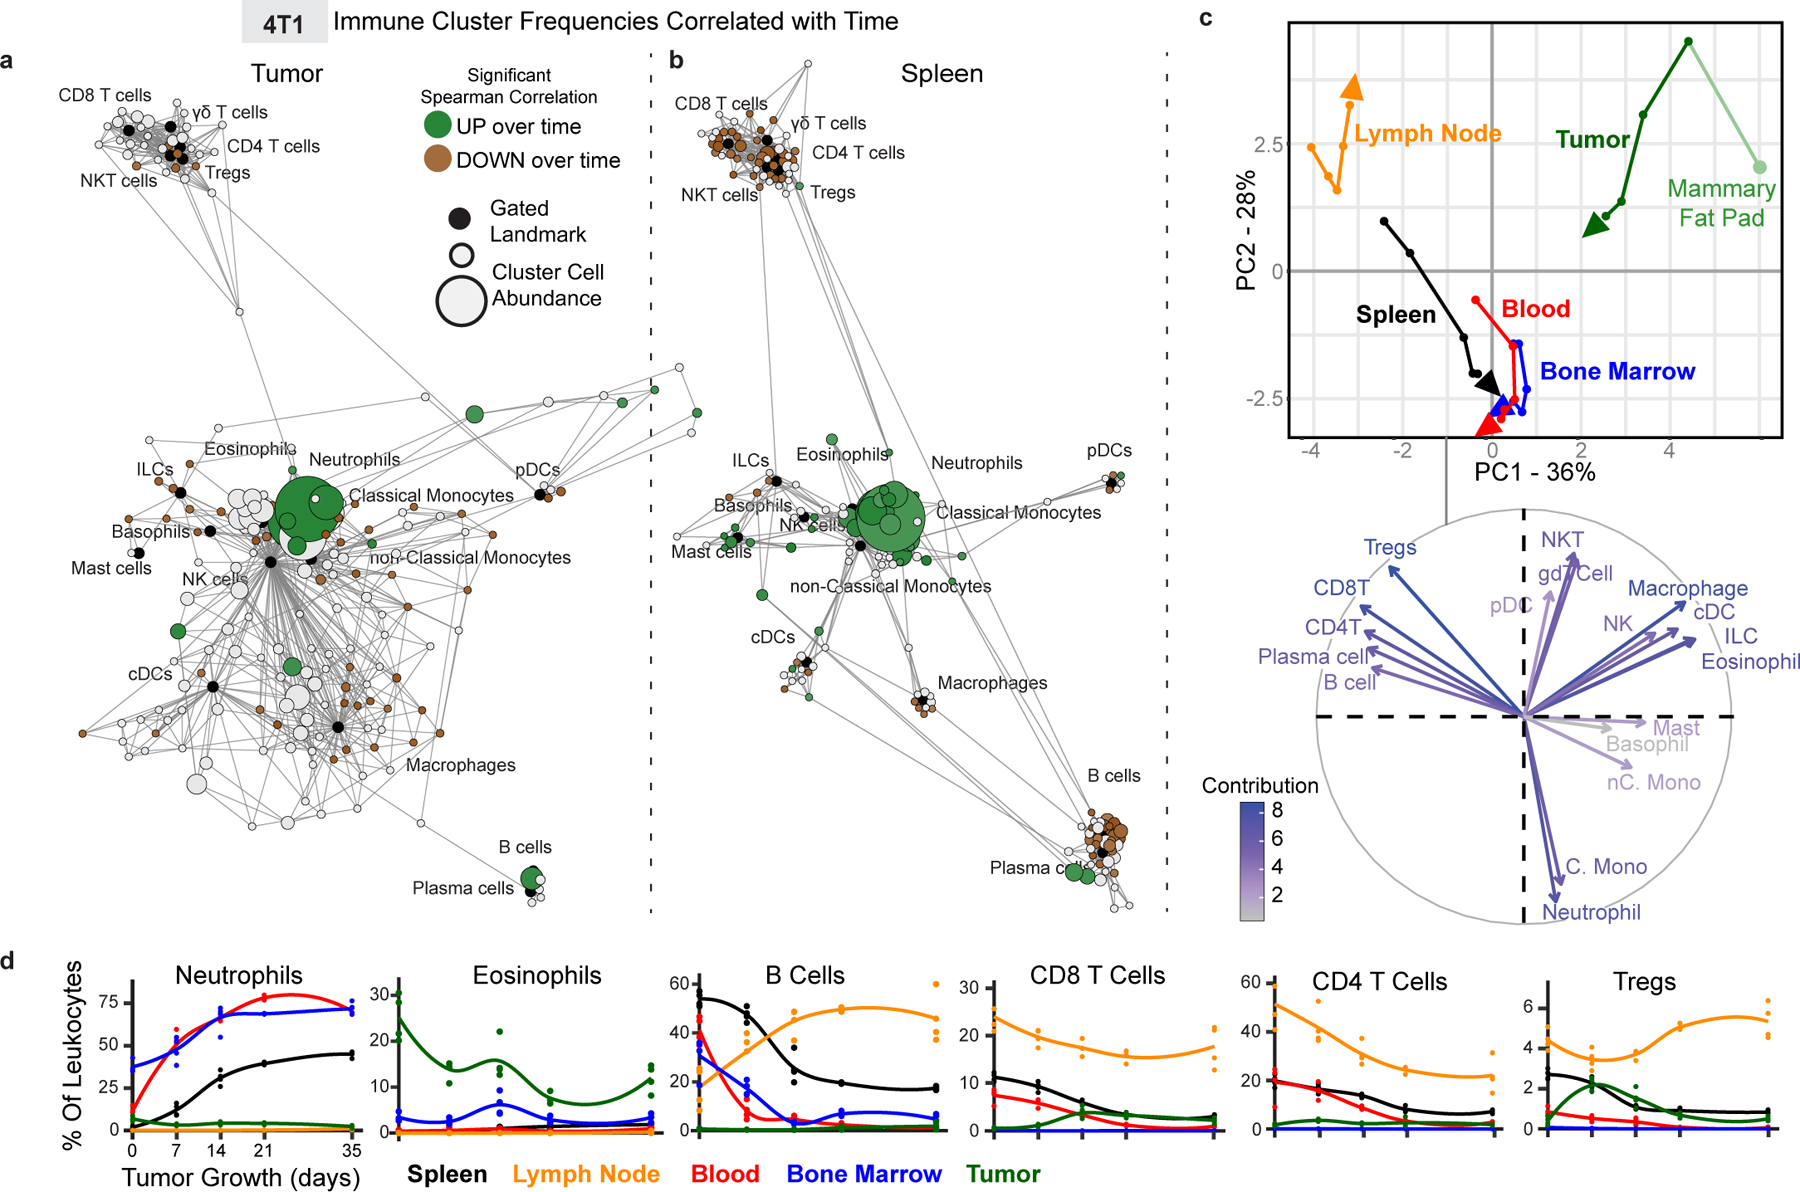
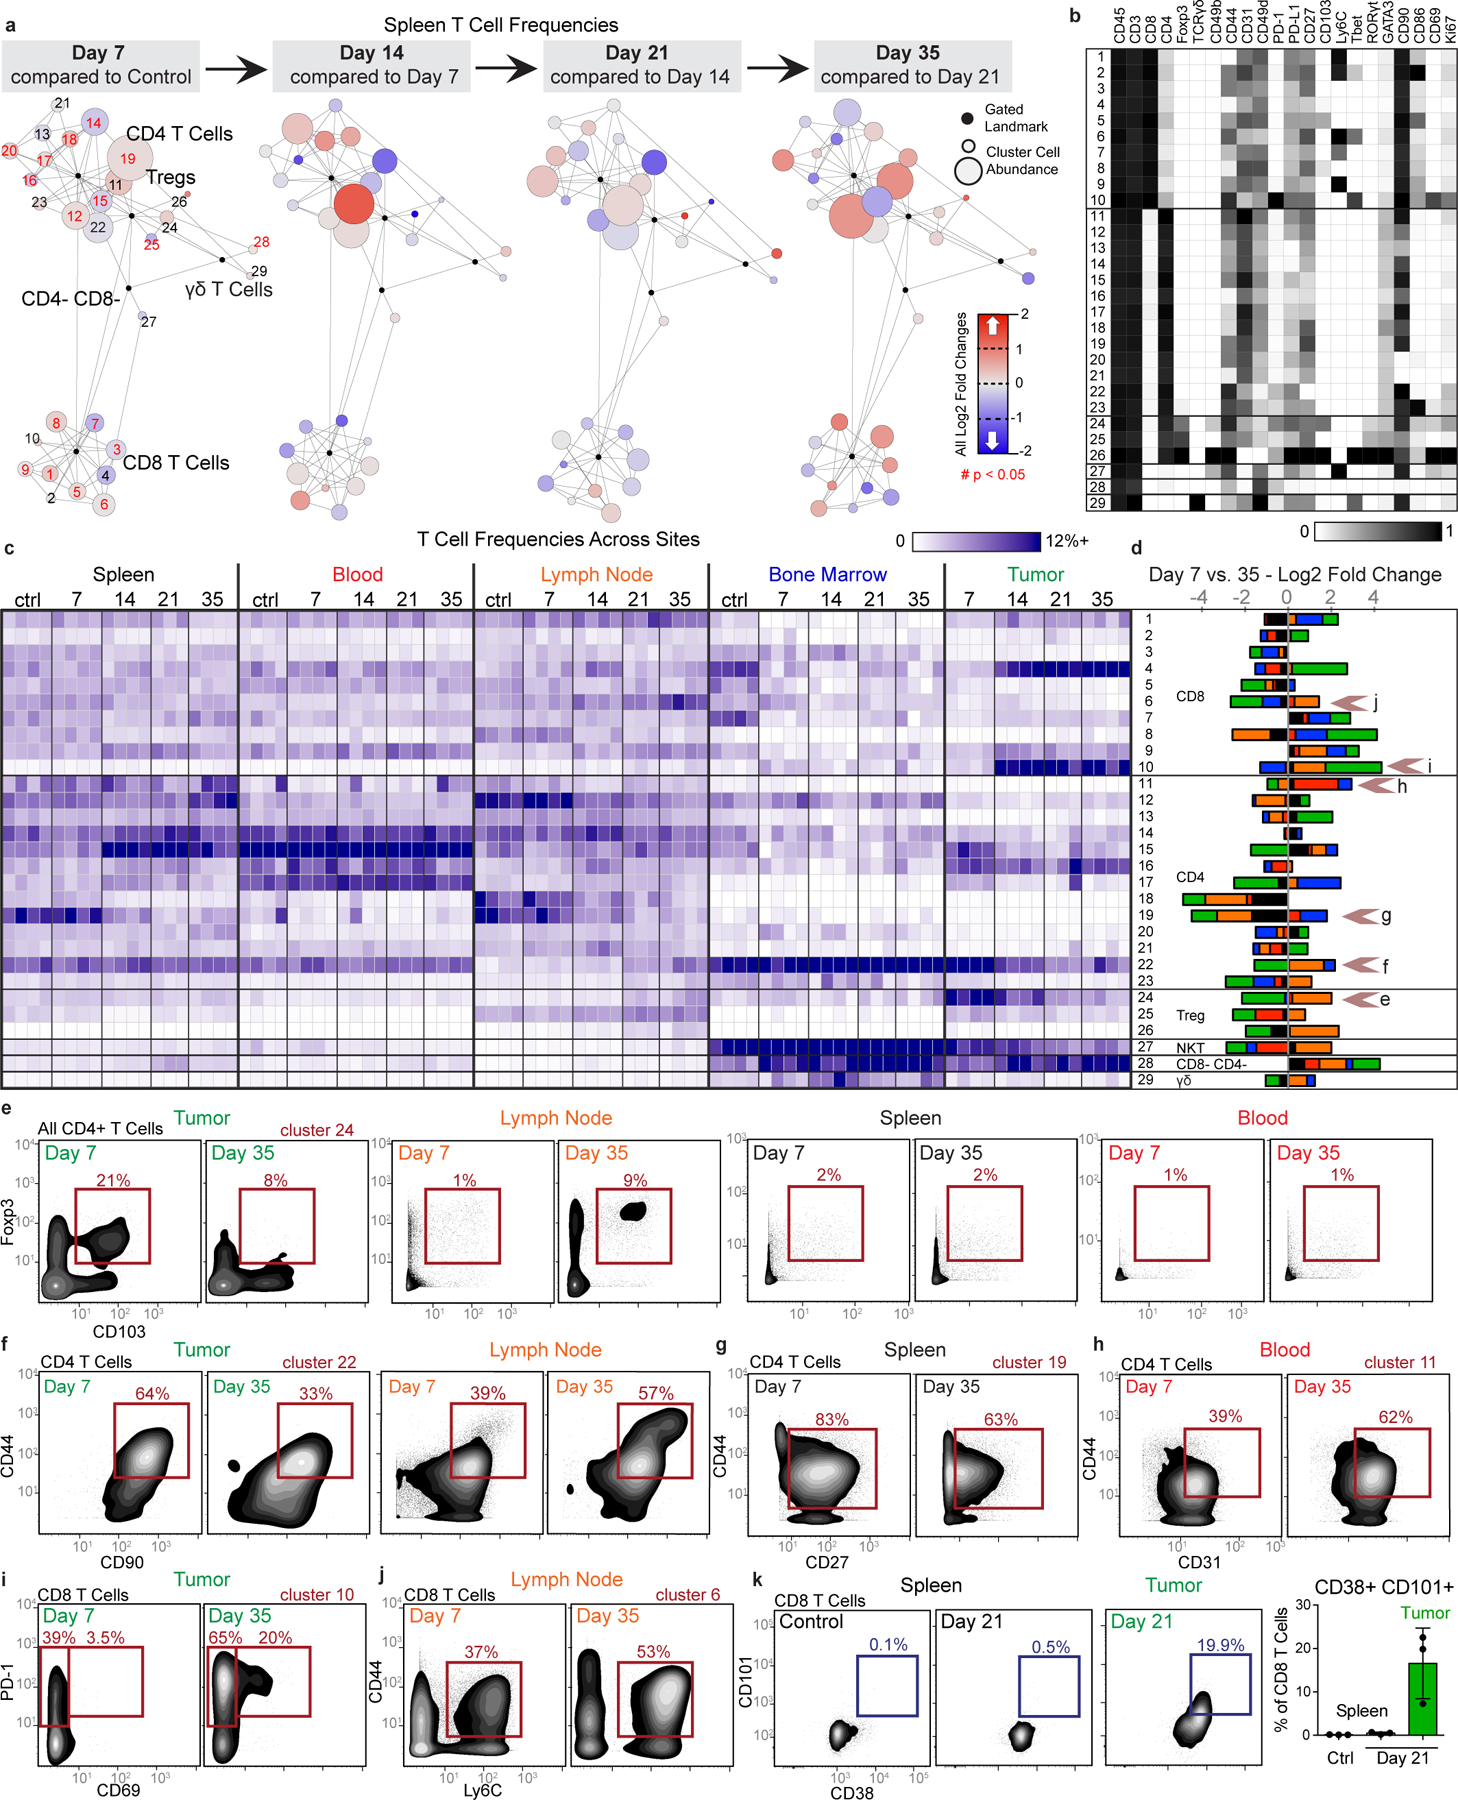
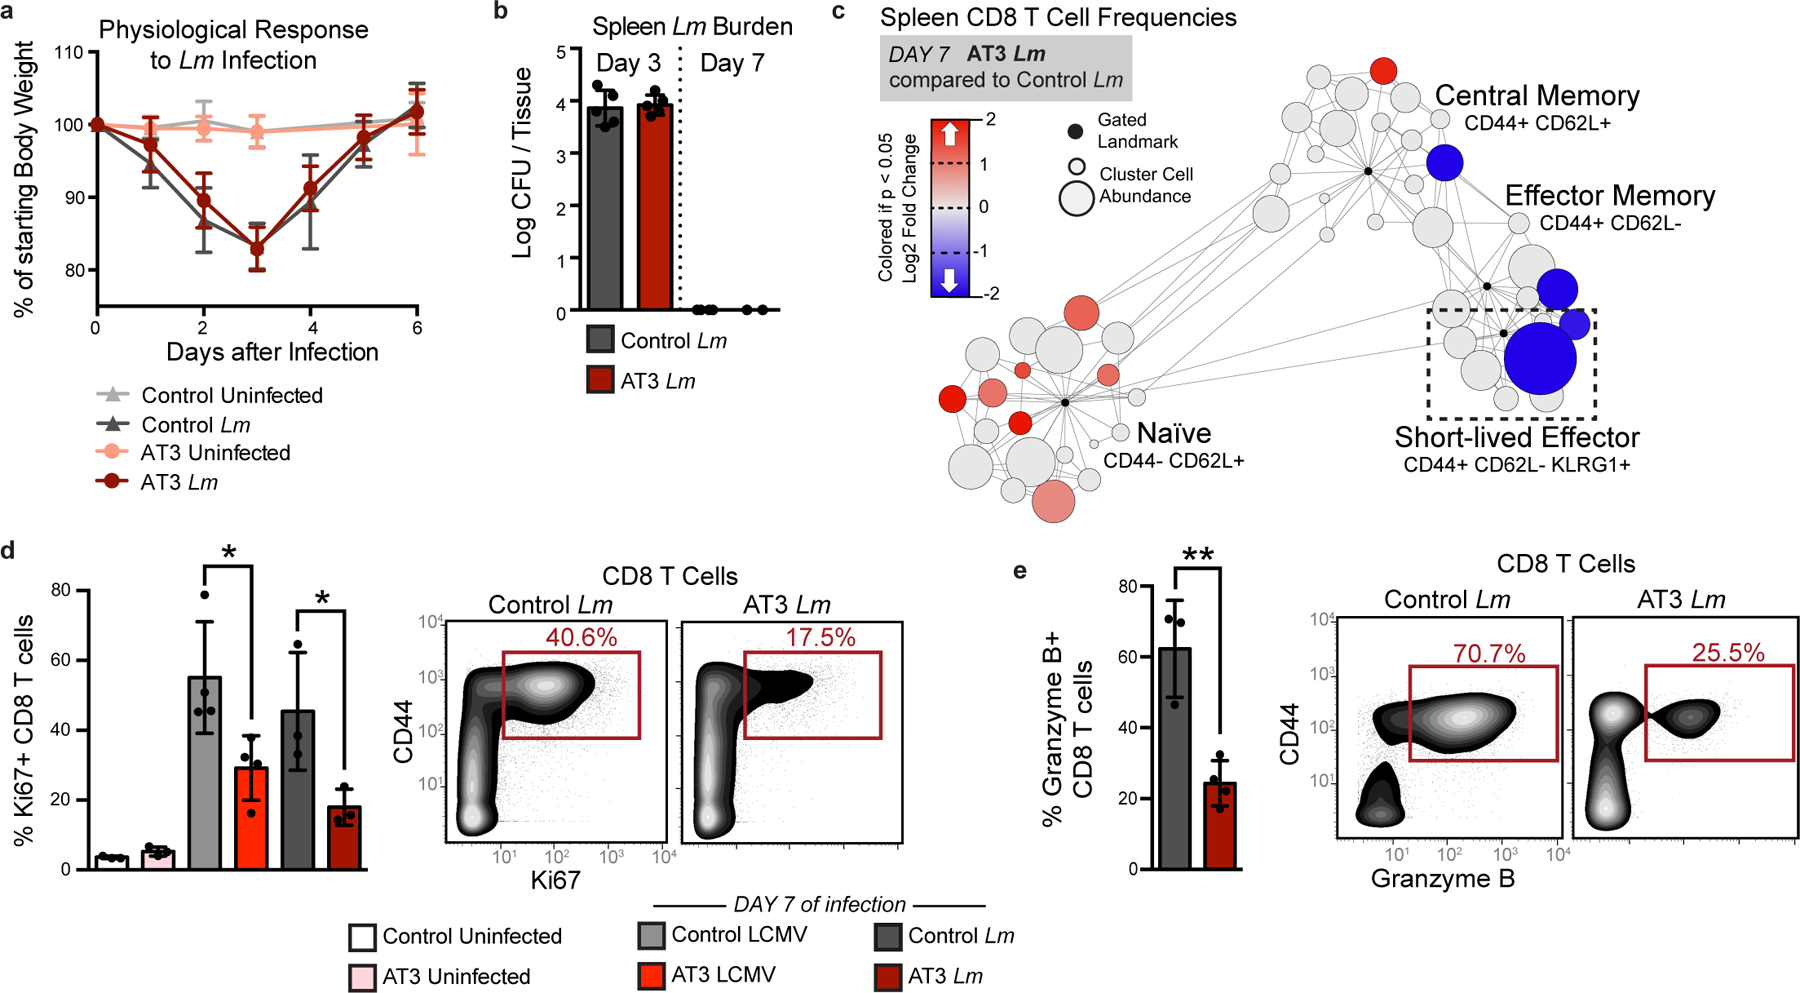
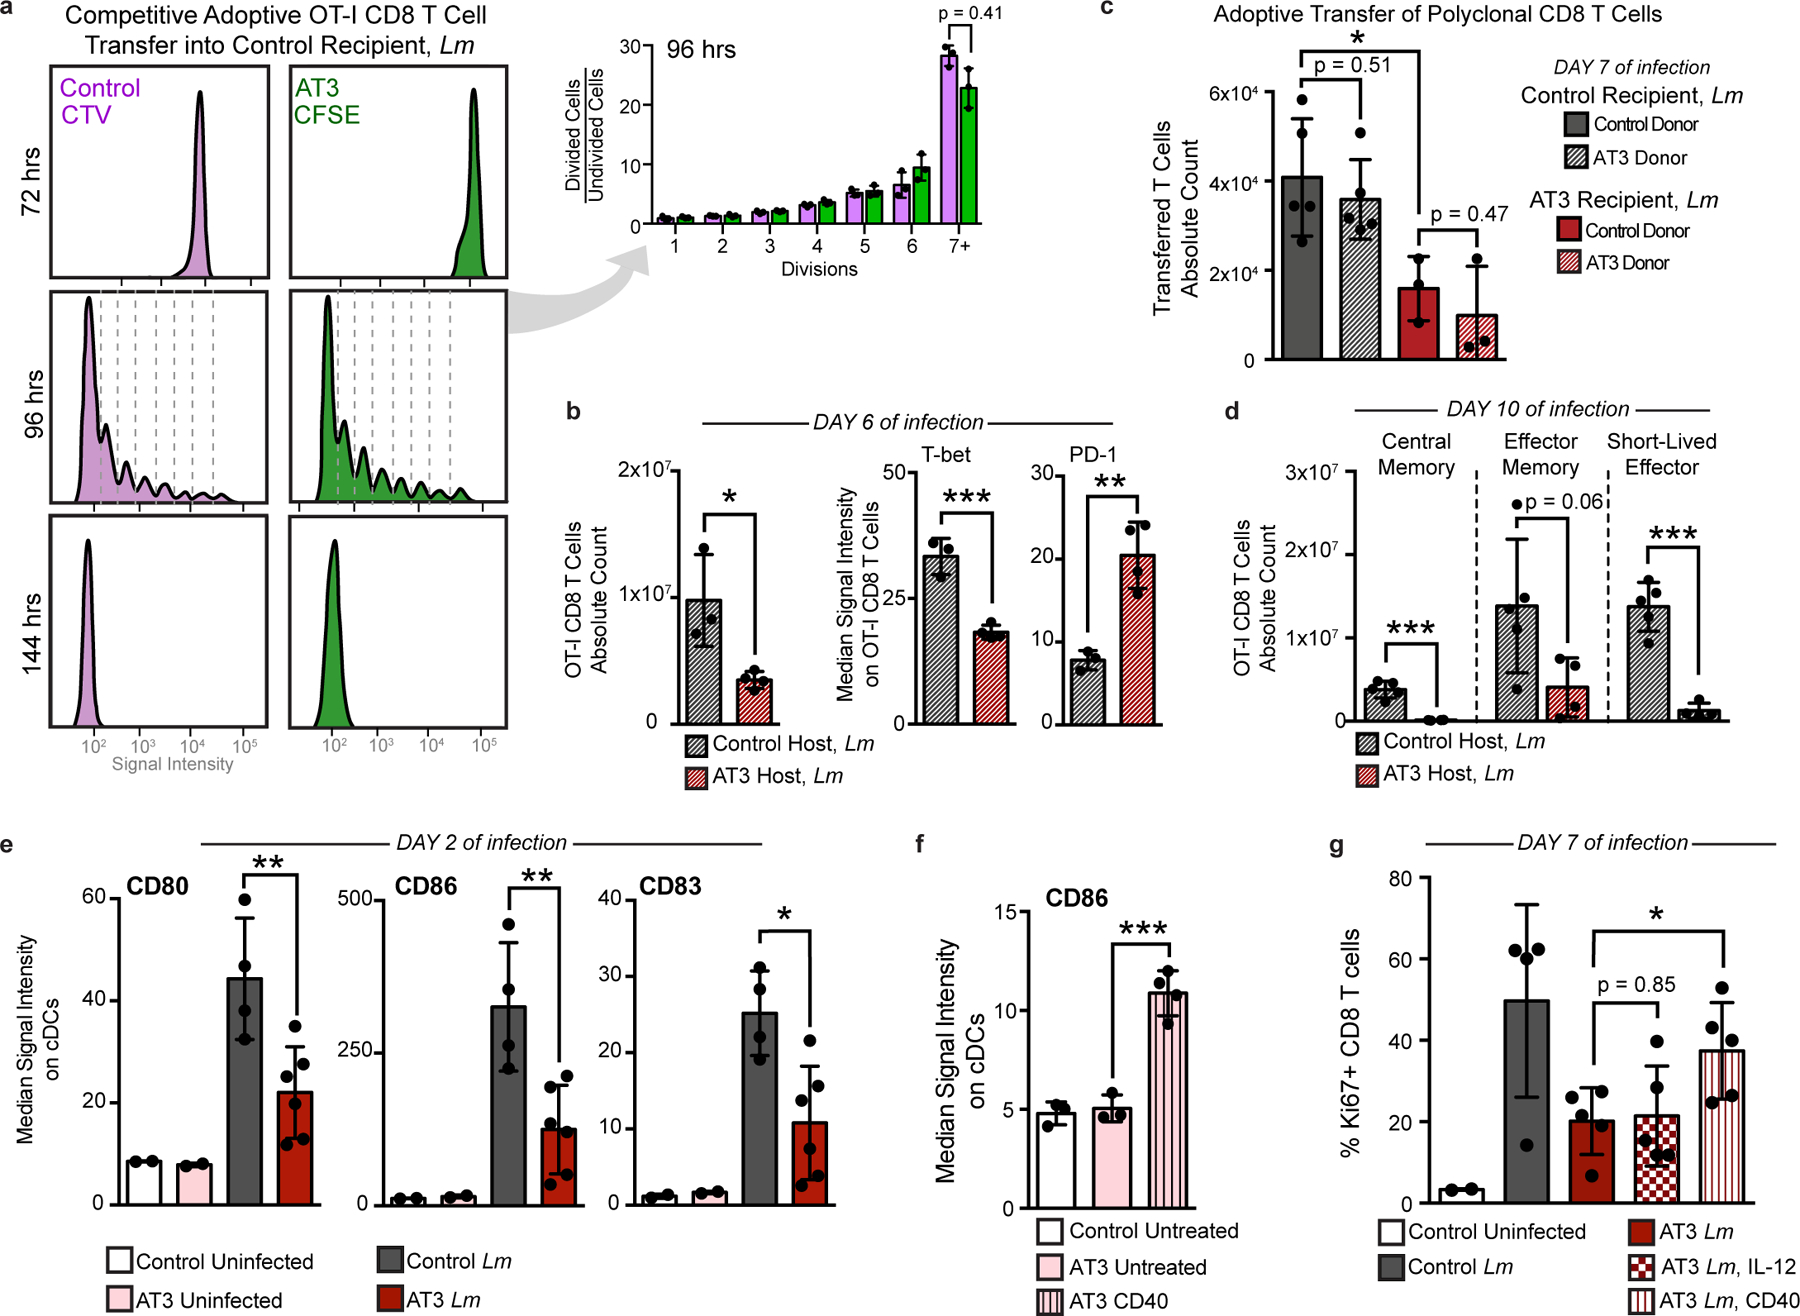
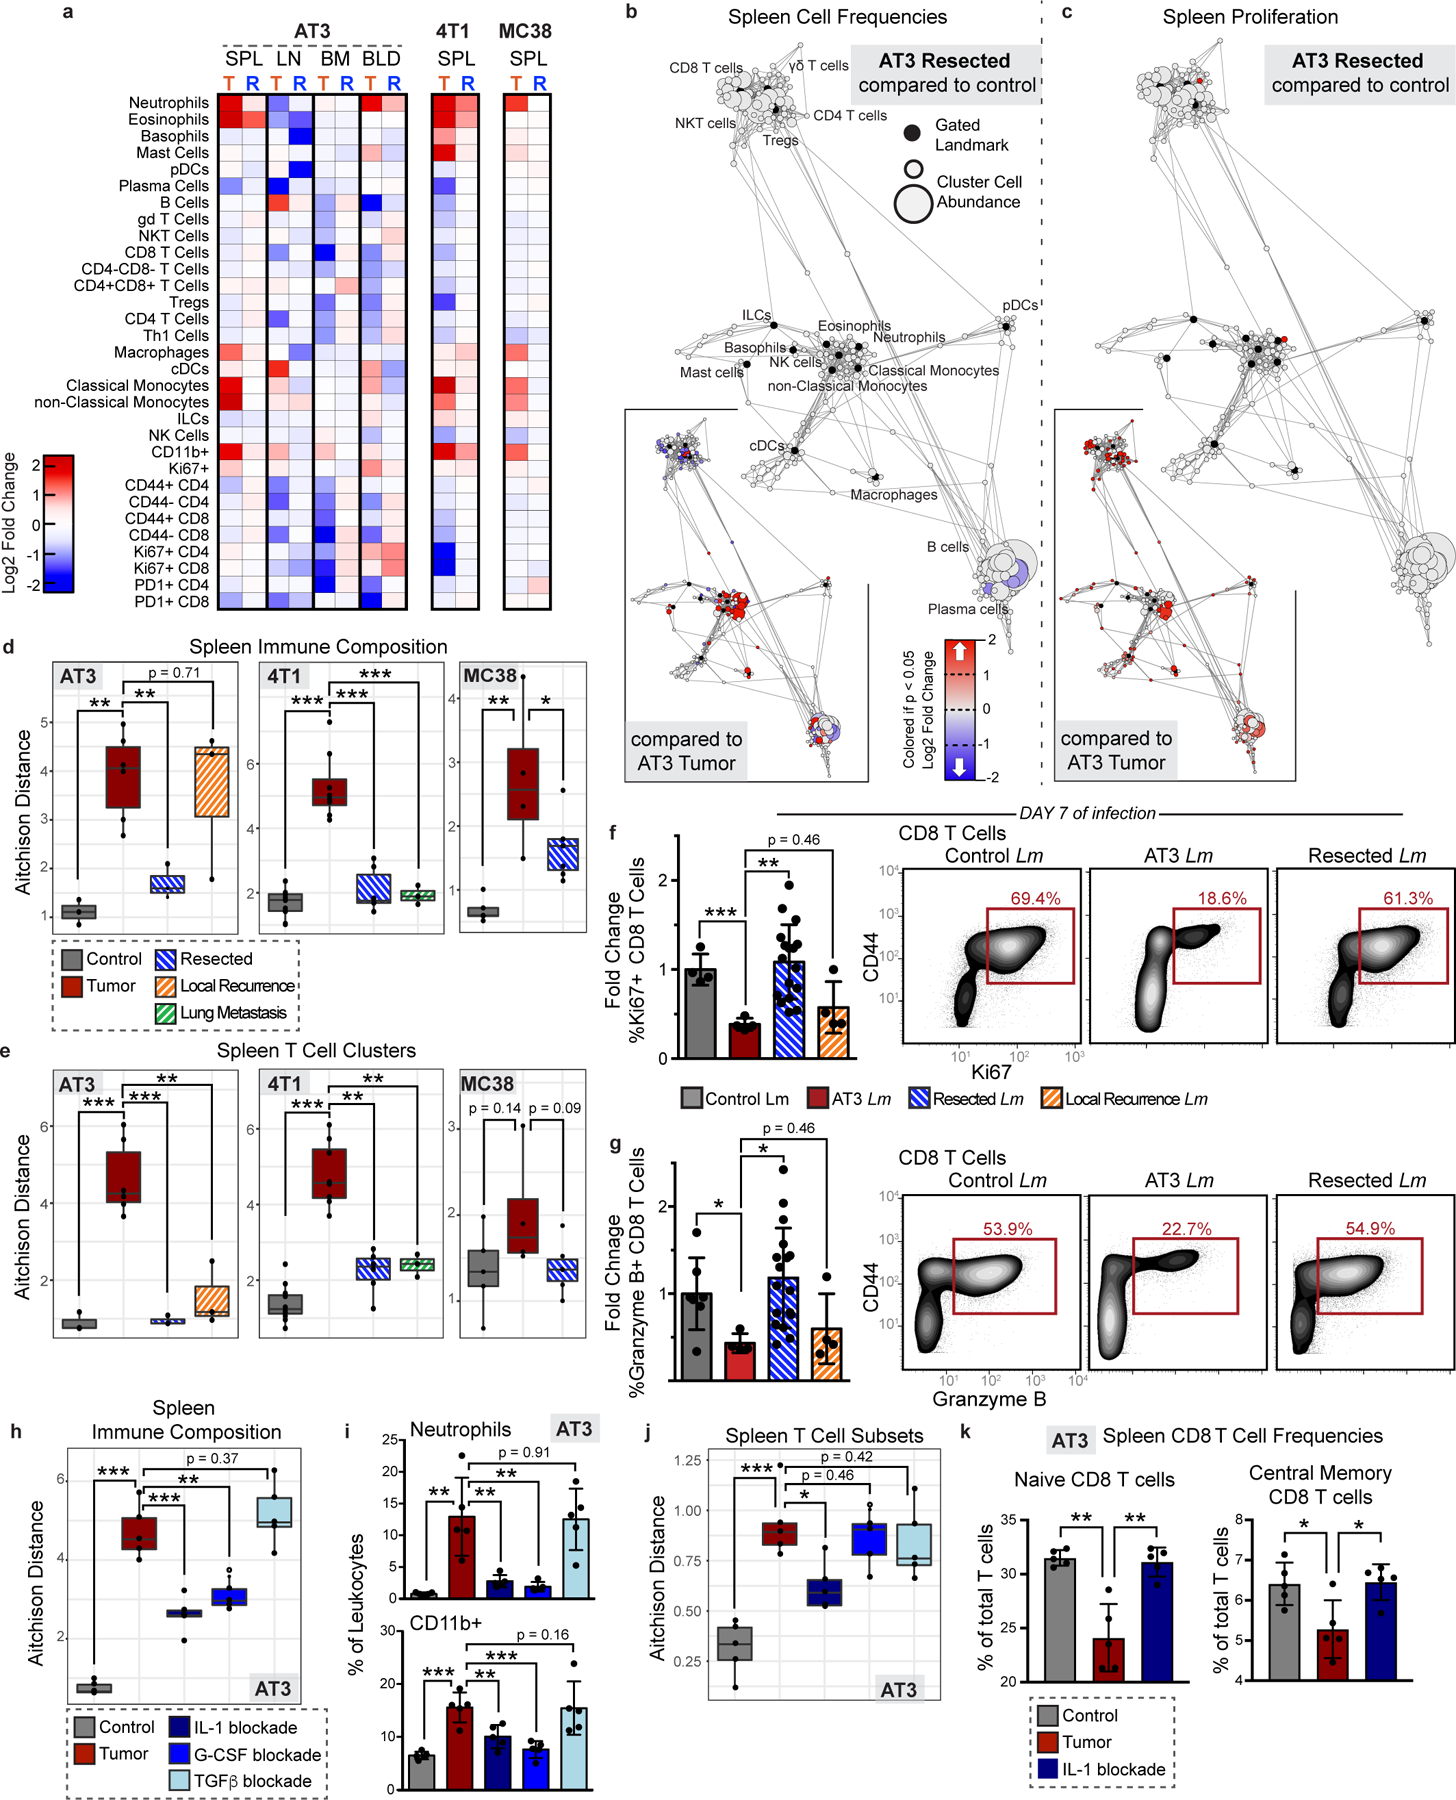
Understanding of the factors governing immune responses in cancer remains incomplete, limiting patient benefit. In this study, we used mass cytometry to define the systemic immune landscape in response to tumor development across five tissues in eight mouse tumor models. Systemic immunity was dramatically altered across models and time, with consistent findings in the peripheral blood of patients with breast cancer. Changes in peripheral tissues differed from those in the tumor microenvironment. Mice with tumor-experienced immune systems mounted dampened responses to orthogonal challenges, including reduced T cell activation during viral or bacterial infection. Antigen-presenting cells (APCs) mounted weaker responses in this context, whereas promoting APC activation rescued T cell activity. Systemic immune changes were reversed with surgical tumor resection, and many were prevented by interleukin-1 or granulocyte colony-stimulating factor blockade, revealing remarkable plasticity in the systemic immune state. These results demonstrate that tumor development dynamically reshapes the composition and function of the immune macroenvironment.


Figures

Extended Data Fig. 1.
Extended Data Fig. 1.. Main Mass Cytometry Gating Strategy
Main Mass Cytometry Gating Scheme. a, Main gating strategy for identifying major immune cell populations from mass cytometry datasets.
Extended Data Fig. 2.
Extended Data Fig. 2.. Systemic immunity is distinctly remodeled across tumor types.
a, Relative abundance of total leukocytes infiltrating the TME across eight tumor models. b-f, Scaffold maps of spleen cell frequencies across five distinct tumor models, SB28 glioblastoma (b), MC38 colorectal (c), LMP pancreatic (d), B16 melanoma (e), and Braf-PTEN melanoma (f), comparing late stage tumor burden to their respective health littermate controls. g, Heatmaps of the log2 adjusted fold change in bulk immune cell frequencies across all five tissues, where relevant, across all models. h, Heatmaps of the log2 adjusted fold change in bulk immune cell frequencies comparing the parental AT3 and engineered AT3 expressing reporters GFP and Luciferase, with cell labels in g. Lower inset shows Pearson’s correlation between these systemic immune features.
Extended Data Fig. 3.
Extended Data Fig. 3.. Systemic immunity is distinctly remodeled over tumor development.
a, Pearson’s correlation between MMTV-PyMT primary tumor size and change in systemic immune composition, measured as Aitchison distance. b, Degree of systemic immune change by Aitchison distance over tumor growth (left) and after removing the contribution of primary tumor size by linear regression (right). c, Percent of PyMT expressing metastatic cancer cells in the lung (green) and primary draining lymph node (blue). d, Pearson’s correlation between lung or lymph node metastasis and the residual changes in systemic immune composition after regressing out primary tumor burden. e, Heatmap of the log2 adjusted fold change in bulk spleen immune cell frequencies for each 400mm2 tumor-bearing mouse, ranging from 0 to high metastatic disease. f, Pearson’s correlation between tumor mass and absolute number of infiltrating leukocytes in 4T1 breast tumors. g, Spleen immune absolute cell counts, adjusted absolute cell counts per mg of tissue, and unadjusted immune frequencies at each time point for neutrophils, B cells and T cells of the 4T1 breast tumor model. h, PCA of relative immune cell frequencies from each major immune tissue over time in the MMTV-PyMT breast tumor model. Vectors designate progression from control (first point) to 25 mm2, 50mm2, 125mm2, and 400mm2 (last point, arrowhead). i, Scaffold maps of immune cell frequencies in the spleen at each time point of 4T1 tumor burden, colored by log2 fold change in frequency compared to the previous time point.
Extended Data Fig. 4.
Extended Data Fig. 4.. Immunity is distinctly remodeled by compartment over tumor development.
a-d, Scaffold maps of immune cell frequencies over 4T1 tumor progression in the tumor draining lymph node (a) blood (b), bone marrow (c), and tumor (d), colored by fold change from the previous time point.
Extended Data Fig. 5.
Extended Data Fig. 5.. Tumor growth shifts the systemic T cell composition across models.
a-b, PCA of T cell cluster frequencies across lymphoid tissues over tumor development for the 4T1 (a) and MMTV-PyMT (b) breast tumor models. Vectors designate directional progression from control (first point) to late stage disease (last point, arrowhead). In a, tumor time points include day 7, 14, 21, and 35 after 4T1 cancer cell transplant. In b, tumor time points include tumor sizes of 25 mm2, 50 mm2, 125 mm2, and 400 mm2. c-e, CD3+ CD11b- leukocytes from all tissues clustered together from healthy and MMTV-PyMT tumor-burdened animals at progressive tumor sizes. c, Heatmap of each T cell cluster frequency, by row, in each site and across the individual 2–3 animals per time point. d, Stacked bar plot of the log2 fold change in cluster frequency between early (25 mm2) and late (400 mm2) disease time points, colored by tissue. e, Heatmap of the protein expression defining each T cell cluster, column normalized to each protein’s maximum positive expression. f-h, Representative scatter plots of key proteins that define T cell clusters changing in frequency in the designated site between early and late disease stage for CD8 T cells (f), Tregs (g), and CD4 T Cells (h).
Extended Data Fig. 6.
Extended Data Fig. 6.. Tumor growth shifts the systemic mononuclear phagocyte composition.
a, CD3- CD19- leukocytes from all tissues clustered together from healthy and 4T1 tumor-burdened animals at progressive time points. Left, stacked bar plot of the log2 fold change in cluster frequency between early (day 7) and late (day 35) times points, colored by tissue. Right, heatmap of the protein expression defining each cluster, column normalized to each protein’s maximum positive expression. b, Curves of the mean cell frequencies over time in the 4T1 breast tumor model from designated mononuclear phagocyte cell types, colored by tissue. c, PCA of the mononuclear phagocyte cell frequencies from each tissue over time in the 4T1 breast tumor model. Vectors designate progression from control (first point) to day 7, 14, 21, and 35 (last point, arrowhead). Coloring of tissues for a-c corresponds to labels in c.
Extended Data Fig. 7.
Extended Data Fig. 7.. PD-1 and PD-L1 expression is dynamic over tumor growth.
a, Distribution of PD-1 and PD-L1 signal intensities on tumor infiltrating leukocytes over time in the 4T1 or AT3 breast tumor models. Coloring of time points for a-d corresponds to legend in a. b, Percent of total infiltrating leukocytes (left of dashed line) or CD45-, non-endothelial cells (right of dashed line) with high PD-1 or PD-L1 expression in the 4T1 or AT3 tumor models. c, Percent of leukocytes with high PD-1 or PD-L1 expression over time and across tissues, 4T1 model. d, Pearson’s correlation between median PD-L1 signal intensity on blood versus tumor infiltrating leukocytes, 4T1 model. e, Percent of each major immune cell subset expressing high PD-1 or PD-L1 in the tumor, blood, and spleen, identified manually. Cell subsets below 0.2% of total leukocytes were not included, X. Bars ordered by time point, beginning at healthy control. Double positive PD-1/PD-L1 expression was rare and not illustrated. p*< 0.05, One-Way ANOVA, with Tukey correction versus control tissue or healthy mammary fat pad (blue in b-c, fill corresponding to bar color in e), or versus day 7 (green in b-c).
Extended Data Fig. 8.
Extended Data Fig. 8.. Tumor burden induces organ-specific changes in immune cell cycling.
a-b, Log2 fold change in bulk Ki67 expressing leukocytes in each tissue tissues for 4T1, AT3 and MMTV breast tumors (a), and over 4T1 tumor progression (b). p*< 0.05, One-Way ANOVA, with Tukey correction versus control. c-d, Statistical Scaffold maps of Ki67 expression in immune cells of the tumor draining lymph node comparing control to day 21 (c) and the Spleen over time (d) in 4T1 tumor burdened animals. e, Percent of increasing clusters (red, total of 56), decreasing clusters (blue, total of 90), or unchanged cluster that have corresponding changes in cell cycle markers Ki67 and cleaved Caspase-3.
Extended Data Fig. 9.
Extended Data Fig. 9.. Tumor driven deficits in T cell responses are cell-extrinsic.
a, Quantification of bulk CD8+ T cell populations in the spleen of healthy or AT3 tumor-burdened mice after 7 days of Lm infection, Two-Way ANOVA with Bonferroni correction. b, Expression of inflammatory cytokines, INFy, IL-2, and TNFa in splenic CD8 T Cells isolated from control or AT3 tumor-burdened mice after in vitro differentiation with CD3, CD28 and IL-2, and re-stimulation with BrefeldinA and PMA Ionomycin. c, Scatter plots of CD11b and Ly6G showing expected neutrophilia in OT-I TCR transgenic mice with AT3 tumor burden. d, Histograms of CD80, CD86, and CD83 signal intensity on cDCs from healthy or AT3 tumor-burdened mice at day 2 of Lm-OVA infection. e, Median signal intensity of CD80, PD-L1 and CD54 activation markers on splenic cDCs from healthy or AT3 tumor-burdened mice compared to IL-12p70 or CD40 treatment at day 7 of Lm-OVA infection. F, Median signal intensity of PD-L1 on splenic cDCs from untreated or CD40 treated AT3 tumor-burdened (day 21) mice. G, Quantification of splenic CD8+ T cell proliferation in healthy, untreated or CTLA-4 treated AT3 tumor-burdened animals in response to 7 days of Lm-OVA infection. p*<0.05, two-tailed t-test.
Extended Data Fig. 10.
Extended Data Fig. 10.. Tumor resection resets systemic immune organization and function.
a-c, Statistical scaffold maps of spleen immune cell frequencies (a) and proliferation by Ki67 expression (b) in 4T1 resected mice, and of spleen immune cell frequencies in MC38 resected mice (c) compared to healthy control. Insets show resected mice compared to tumor-burdened mice. d-e, Heatmap of the log2 fold changes in splenic immune cell frequencies for local or lung recurrences from control mice (d), and for IL-1, G-CSF, or TGFβ blockade from untreated AT3 tumor-burdened mice (e). f-g, Heatmaps of T cell cluster expression profiles and log2 fold change from control for AT3 (f) and 4T1 (g) for the spleen and draining lymph node. h, Median signal intensity of CD86 and PD-L1 on splenic cDCs from healthy, AT3 tumor-burdened, resected, or resected mice with local recurrence at day 7 of Lm-OVA infection. i, Concentration of circulating cytokines, IL-1α and G-CSF from healthy, AT3 tumor-burdened, resected, or resected mice with local recurrence. j, Concentration of cytokines, IL-1α, IL-1β and G-CSF from in vitro cell culture media conditioned with AT3 cancer cells. k, Concentration of circulating G-CSF from control or AT3 tumor-bearing mice, or AT3 tumor-bearing mice treated with either IL-1 or G-CSF blocking antibodies. p*<0.05, two-tailed t-test.
Fig. 1:
Fig. 1:. The systemic immune landscape is remodeled across tumor models.
a, Composition of tumor immune infiltrates across late stage mouse models, identified by manual gating (n = 3 independent animals for 4T1; n = 6 AT3; n = 7 MMTV-PyMT; n = 6 B16; n = 6 Braf-Pten; n = 4 LMP; n = 6 MC38; n = 1 SB28; n = 30 Controls). b-c, Principal component analysis (PCA) and corresponding vector plot of individual contributions for the tumor infiltrating immune frequencies (b), and the log2 fold change of immune frequencies for the tumor draining lymph node, bone marrow, blood, and spleen (c) identified manually (n = 3 for SB28, otherwise as in panel (a)) d, Scaffold maps of spleen immune frequencies in breast tumor models (4T1, AT3, and MMTV-PyMT). Black nodes represent canonical cell populations identified manually. Other nodes reflect unsupervised clustering of leukocytes. Nodes are arranged by similarity using a force-directed graphing algorithm (see Methods). Red denotes populations significantly higher in frequency in tumor-burdened animals compared to controls; blue denotes significantly lower frequency. For significant nodes (q < 0.05 by significance analysis of microarrays), the degree of coloring reflects log2 fold change (n as in panel (a)). e-f, PCA (e) and significant immune changes by cellular enrichment analysis (f) from human whole blood gene expression, comparing breast cancer patients (n = 173) and matched controls (n = 281), p*** < 0.001 by two-sided Wilcoxon rank-sum test with Benjamini-Hochberg correction. Box plots: center line, median; box limits, upper and lower quartiles; whiskers, 1.58x interquartile range / sqrt(n); points, outliers.
Fig. 2:
Fig. 2:. The systemic immune landscape is remodeled progressively with tumor development.
a-b, Scaffold maps of 4T1 tumor (a) and spleen (b) cell frequencies colored by significant Spearman correlation with time (across day 0, 7, 14, 21 and 35), p < 0.05 by two-sided t-test with Benjamini-Hochberg correction. Green denotes positive correlation, and brown denotes negative correlation. c, CA and corresponding vector plot of contributions for immune cell frequencies from each immune tissue over 4T1 breast tumor growth. Vectors designate progression from control day 0 (first point) to day 7, 14, 21, and 35 (last point, arrowhead). d, Curves of mean cell frequencies across time from a subset of immune cell types contributing to c, colored by tissue corresponding with c. All panels from one experiment, n = 3 independent animals for day 21 and n = 4 for all other timepoints.
Fig. 3:
Fig. 3:. Tumor burden progressively changes the systemic T cell composition.
a-d, CD3+ CD11b- leukocytes from all tissues from healthy and 4T1 tumor-burdened animals at progressive time points. a, Scaffold maps of the T cell cluster frequencies in the spleen at each disease stage, all colored by log2 fold change in frequency. Clusters with significant change over time are highlighted in red in the first map, q < 0.05 by multiclass significance analysis of microarrays. b, Heatmap of the protein expression defining each T cell cluster, column normalized to each protein’s maximum positive expression. c, Heatmap of each T cell cluster frequency, by row, in each site and across the individual 3–4 animals per time point. d, Stacked bar plot of the log2 fold change in cluster frequency between early (day 7) and late (day 35) disease stage, colored by tissue. e-j, Representative scatter plots of key proteins defining T cell clusters that change in frequency in the designated tissues between early and late disease stage for Tregs (e), CD4 T cells (f-h), and CD8 T cells (i-j). k, Representative scatter plots and quantification of CD101+ CD38+ dysfunctional CD8 T cells in the spleen and tumor of health or day 21 tumor-burdened animals. All panels from one experiment, n = 3 independent animals for day 21 and n = 4 for all other timepoints. Barplot: centre, mean; whiskers, standard deviation.
Fig. 4:
Fig. 4:. Tumor burden leads to impaired T cell responses to secondary infection.
a-b, Fold change in body weight after Listeria monocytogenes (Lm) infection (n = 11 independent animals for control groups and n = 9 for AT3 groups) (a), and quantification of Lm bacterial burden (b) in control and AT3 tumor-burdened animals (n = 5 for day 3 groups, n = 4 for control day 8, and n = 2 for AT3 day 8). c, Scaffold map of CD8 T cell frequencies in the spleen in AT3 tumor-burdened mice after 7 days of Lm infection, colored by fold change in frequency compared to infected control mice (n = 3 uninfected, n = 3 Lm infected), q < 0.05 by significance analysis of microarrays. d-e, Quantification and representative scatter plots of splenic CD8+ T cell proliferation (d) and Granzyme B production (e) in response to LCMV Armstrong or Lm in healthy or AT3 tumor-burdened animals (n = 3 uninfected, n = 4 LCMV, and n = 3 Lm infected). For all barplots: p* < 0.05, p** < 0.01 by two-sided t-test; centre, mean; whiskers, standard deviation.
Fig. 5:
Fig. 5:. Tumor burden attenuates dendritic cell activation during secondary infection.
a, OT-I T cell proliferation from control or tumor-burdened animals transferred into control recipients, and analyzed at 72, 96, and 144 hours post Lm-Ova infection (n = 3 independent animals per group). Quantification of 96 hours. b, Transferred OT-I T cell counts and median signal intensity of T-bet and PD-1 at day 6 of Lm-OVA infection (n = 3 for control, and n = 4 for AT3 hosts). c, Competitively transferred polyclonal CD8 T cell counts from congenic (CD45.1+ AT3 tumor-burdened or CD45.1+CD45.2+ control) donors into CD45.2 control (n = 5) or AT3 tumor-burdened recipients (n = 4), after 7 days of Lm infection. d, CD8+ T cell subtype counts from transferred CD45.1+ OT-I T cells at day 10 of Lm-OVA infection (n = 5 for control, and n = 4 for AT3 hosts). e, Median signal intensity of CD80, CD86, and CD83 on splenic classical dendritic cells (cDCs) from healthy (n = 4) or AT3 tumor-burdened (day 28, n = 6) mice, at day 2 of Lm-OVA infection (n = 2 for uninfected groups). f, Median signal intensity of CD86 on splenic cDCs from untreated (n = 3) or CD40 treated (n = 4) AT3 tumor-burdened (day 21) mice. g, Quantification of splenic CD8+ T cell proliferation in healthy versus untreated, IL-12p70 treated, or anti-CD40 treated AT3 tumor-burdened animals at day 7 of Lm-OVA infection (n = 2 control uninfected, n = 4 control Lm, and n = 5 for AT3 groups). For all barplots: p* < 0.05, p** < 0.01, p*** < 0.001 by two-sided t-test; centre, mean; whiskers, standard deviation.
Fig. 6:
Fig. 6:. Tumor resection completely resets the systemic immune landscape.
a, Heatmaps of log2 fold changes in peripheral immune frequencies from tumor-burdened (T) or resected (R) mice. b-c, Scaffold maps of spleen immune frequencies (b) and proliferation (c) after AT3 resection compared to control (n = 3 per group). Insets show resected compared to tumor-burden (n = 4), q < 0.05 by significance analysis of microarrays. d-e, Compositional Aitchison distances in spleen immune frequencies (d) or T cell cluster frequencies (e) from control (n = 3 for AT3, 8 for 4T1, and 5 for MC38), tumor-burdened (n = 6, 8, and 4), resected (n = 3, 6 and 6), or locally recurrent mice for AT3 and distal lung metastasis for 4T1 (n = 3 for both)(2 independent experiments for 4T1 and 1 experiment for AT3 and MC38). f-g, Quantification and representative scatter plots of splenic CD8+ T cell proliferation (f) and Granzyme B production (g) after Lm infection in control (n = 4 and n = 7), AT3 tumor-burdened (n = 4), resected (n = 17), or recurrent mice (n = 4), 3 independent experiments. h-k, Compositional Aitchison distances of spleen immune frequencies (h), spleen frequencies of neutrophil (top) and undefined CD11b+ cells (bottom) (i), compositional Aitchison distances of T cell subset frequencies (j), and splenic CD8+ T cell frequencies (k) from control, or tumor-burdened mice untreated or with IL-1, G-CSF, or TGFb antibody blockade (n = 5 per group, from 1 experiment). All box plots: center line, median; box limits, upper and lower quartiles; whiskers, 1.58x interquartile range / sqrt(n); points, outliers. All barplots: p* < 0.05, p** < 0.01, p*** < 0.001 by two-sided t-test; centre, mean; whiskers, standard deviation.

Comment in

  • Tumours disrupt the immune scenery.
    Gummlich L. Gummlich L. Nat Rev Cancer. 2020 Aug;20(8):415. doi: 10.1038/s41568-020-0286-6. Nat Rev Cancer. 2020. PMID: 32620876 No abstract available.

References

    1. Philip M et al. Chromatin states define tumour-specific T cell dysfunction and reprogramming. Nature 545, 452–456 (2017). - PMC - PubMed
    1. Spitzer MH et al. Systemic Immunity Is Required for Effective Cancer Immunotherapy. Cell 168, 487–502.e15 (2017). - PMC - PubMed
    1. Fransen MF et al. Tumor-draining lymph nodes are pivotal in PD-1/PD-L1 checkpoint therapy. JCI Insight 3, 1–7 (2018). - PMC - PubMed
    1. Tang H et al. PD-L1 on host cells is essential for PD-L1 blockade-mediated tumor regression. J Clin Invest 128, 580–588 (2018). - PMC - PubMed
    1. Chamoto K et al. Mitochondrial activation chemicals synergize with surface receptor PD-1 blockade for T cell-dependent antitumor activity. PNAS 114, E761–E770 (2017). - PMC - PubMed

Publication types

MeSH terms

Substances